From Wikipedia, the free encyclopedia
1985 Kilkenny County Council election|
|
|
|
|
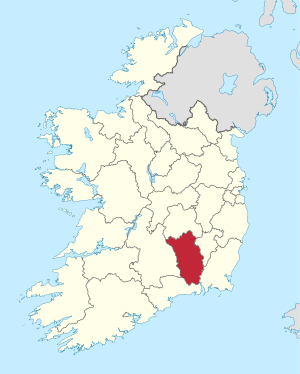 Map showing the area of Kilkenny County Council |
|
An election to Kilkenny County Council took place on 20 June 1985 as part of that year's Irish local elections. 26 councillors were elected from five electoral divisions by PR-STV voting for a six-year term of office.
Results by party[]
| Party
|
Seats
|
±
|
First Pref. votes
|
FPv%
|
±%
|
|
|
Fianna Fáil
|
11
|
-
|
14,722
|
44.77
|
|
|
|
Fine Gael
|
10
|
-
|
11,631
|
35.37
|
|
|
|
Labour
|
3
|
-1
|
3,509
|
10.67
|
|
|
|
Workers' Party
|
1
|
-
|
1,644
|
5.0
|
|
|
|
Independent
|
1
|
+1
|
1,370
|
4.17
|
|
| Totals
|
26
|
-
|
32,886
|
100.0
|
—
|
Results by Electoral Area[]
Ballyragget[]
Ballyragget - 5 seats
| Party |
Candidate |
FPv% |
Count
|
| 1 |
2 |
3 |
4 |
5 |
6 |
7
|
|
|
Fine Gael
|
Mary Hilda Cavanagh*
|
|
1,078
|
1,087
|
1,092
|
1,274
|
|
|
|
|
|
Fianna Fáil
|
John Murphy*
|
|
1,058
|
1,063
|
1,097
|
1,188
|
|
|
|
|
|
Fianna Fáil
|
Martin Fitzpatrick*
|
|
959
|
959
|
1,009
|
1,022
|
1,029
|
1,115
|
1,117
|
|
|
Labour
|
Dick Brennan*
|
|
851
|
946
|
1,044
|
1,067
|
1,074
|
1,146
|
1,149
|
|
|
Fine Gael
|
Thomas Coogan
|
|
680
|
734
|
776
|
950
|
1,043
|
1,135
|
1,149
|
|
|
Fianna Fáil
|
Martin Gibbons
|
|
660
|
666
|
743
|
799
|
807
|
1,109
|
1,121
|
|
|
Fine Gael
|
Kieran Brennan
|
|
529
|
558
|
566
|
|
|
|
|
|
|
Fianna Fáil
|
Patricia Owens
|
|
442
|
464
|
586
|
599
|
601
|
|
|
|
|
Fianna Fáil
|
Charles Brennan
|
|
432
|
454
|
|
|
|
|
|
|
|
Fine Gael
|
John Brennan
|
|
249
|
|
|
|
|
|
|
| Electorate: 9,852 Valid: 6,938 (71.42%) Spoilt: 98 Quota: 1,157 Turnout: 7,036
|
Kilkenny[]
Kilkenny - 4 seats
| Party |
Candidate |
FPv% |
Count
|
| 1 |
2 |
3 |
4 |
5 |
6 |
7 |
8
|
|
|
Fine Gael
|
Kieran CrottyTD*
|
|
1,007
|
1,056
|
|
|
|
|
|
|
|
|
Fianna Fáil
|
Senator Michael Lanigan*
|
|
838
|
850
|
851
|
860
|
891
|
918
|
990
|
1,007
|
|
|
Labour
|
Seamus PattisonTD*
|
|
800
|
826
|
834
|
863
|
940
|
974
|
1,073
|
|
|
|
Fianna Fáil
|
Michael McGuinness*
|
|
753
|
758
|
758
|
772
|
795
|
816
|
881
|
892
|
|
|
Independent
|
John Bolger
|
|
559
|
581
|
585
|
603
|
663
|
714
|
869
|
895
|
|
|
Independent
|
John Dalton
|
|
298
|
304
|
306
|
361
|
372
|
554
|
|
|
|
|
Independent
|
Ken Coogan
|
|
266
|
269
|
270
|
327
|
333
|
|
|
|
|
|
Workers' Party
|
Noel O'Farrell
|
|
198
|
201
|
201
|
|
|
|
|
|
|
|
Fine Gael
|
Tom Crotty
|
|
195
|
217
|
243
|
250
|
|
|
|
|
|
|
Fine Gael
|
Geraldine Maher
|
|
151
|
|
|
|
|
|
|
|
| Electorate: 8,160 Valid: 5,065 (63.87%) Spoilt: 147 Quota: 1,014 Turnout: 5,212
|
Piltown[]
Piltown - 7 seats
| Party |
Candidate |
FPv% |
Count
|
| 1 |
2 |
3 |
4 |
5 |
6 |
7 |
8 |
9
|
|
|
Fianna Fáil
|
Liam AylwardTD*
|
|
1,785
|
|
|
|
|
|
|
|
|
|
|
Fine Gael
|
Dick DowlingTD*
|
|
1,212
|
|
|
|
|
|
|
|
|
|
|
Workers' Party
|
Sean Walsh*
|
|
1,145
|
|
|
|
|
|
|
|
|
|
|
Fianna Fáil
|
Eamonn Meade*
|
|
824
|
950
|
952
|
954
|
958
|
967
|
1,028
|
1,087
|
|
|
|
Fine Gael
|
Andy Cotterell*
|
|
654
|
708
|
754
|
759
|
764
|
840
|
890
|
958
|
991
|
|
|
Fianna Fáil
|
Dermot Kavanagh
|
|
544
|
618
|
626
|
630
|
634
|
640
|
643
|
660
|
860
|
|
|
Fine Gael
|
John Maher
|
|
513
|
549
|
566
|
573
|
576
|
651
|
858
|
974
|
988
|
|
|
Fianna Fáil
|
Thomas Walsh
|
|
477
|
579
|
588
|
590
|
611
|
615
|
618
|
635
|
|
|
|
Fianna Fáil
|
Dick Dunphy*
|
|
430
|
704
|
708
|
719
|
727
|
771
|
780
|
834
|
1,071
|
|
|
Labour
|
Desmond Scahill
|
|
326
|
347
|
354
|
441
|
459
|
469
|
505
|
|
|
|
|
Fine Gael
|
Mick Wall
|
|
315
|
327
|
337
|
344
|
346
|
382
|
|
|
|
|
|
Fine Gael
|
Joe Cummins
|
|
226
|
241
|
272
|
278
|
284
|
|
|
|
|
|
|
Labour
|
John Mahon
|
|
127
|
134
|
138
|
|
|
|
|
|
|
| Electorate: 12,979 Valid: 8,588 (70.14%) Spoilt: 119 Quota: 1,074 Turnout: 8,707
|
Thomastown[]
Thomastown - 6 seats
| Party |
Candidate |
FPv% |
Count
|
| 1 |
2 |
3 |
4 |
5 |
6 |
7 |
8 |
9
|
|
|
Fianna Fáil
|
James Brett*
|
|
1,189
|
|
|
|
|
|
|
|
|
|
|
Fianna Fáil
|
Breda Somers
|
|
768
|
790
|
821
|
828
|
834
|
1,075
|
1,103
|
1,114
|
|
|
|
Fianna Fáil
|
Michael Fenlon*
|
|
636
|
650
|
670
|
692
|
808
|
920
|
958
|
965
|
993
|
|
|
Labour
|
Michael O'Brien*
|
|
629
|
631
|
729
|
740
|
968
|
1,029
|
1,184
|
|
|
|
|
Fine Gael
|
Billy Ireland*
|
|
626
|
628
|
643
|
717
|
742
|
789
|
963
|
987
|
1,241
|
|
|
Fianna Fáil
|
John Fennelly*
|
|
579
|
598
|
622
|
622
|
631
|
|
|
|
|
|
|
Fine Gael
|
Philip Brennan*
|
|
571
|
576
|
582
|
634
|
665
|
676
|
797
|
812
|
1,086
|
|
|
Fine Gael
|
Tom Maher*
|
|
568
|
576
|
583
|
647
|
650
|
665
|
737
|
751
|
|
|
|
Fianna Fáil
|
Tom Quinn
|
|
553
|
559
|
564
|
627
|
637
|
732
|
762
|
767
|
812
|
|
|
Fine Gael
|
Joe Prendergast
|
|
463
|
464
|
498
|
614
|
638
|
662
|
|
|
|
|
|
Labour
|
John Bolger
|
|
445
|
445
|
479
|
486
|
|
|
|
|
|
|
|
Fine Gael
|
Frank Prendergast
|
|
427
|
428
|
431
|
|
|
|
|
|
|
|
|
Workers' Party
|
Joe Doyle
|
|
301
|
302
|
|
|
|
|
|
|
|
| Electorate: 11,440 Valid: 7,755 (68.77%) Spoilt: 122 Quota: 1,108 Turnout: 7,867
|
Tullaroan[]
External links[]

Categories:
- 1985 Irish local elections
- Kilkenny County Council elections
Hidden categories:
- Use dmy dates from October 2020
- Use Hiberno-English from October 2020
- All Wikipedia articles written in Hiberno-English
