From Wikipedia, the free encyclopedia
1991 North Tipperary County Council election|
|
|
|
|
First party
|
Second party
|
Third party
|
|
|
|
|
|
| Party
|
Fianna Fáil
|
Fine Gael
|
Labour
|
| Seats won
|
12
|
6
|
1
|
| Seat change
|
+3
|
-2
|
-2
|
|
|
|
Fourth party
|
|
|
|
|
|
| Party
|
Independent
|
|
| Seats won
|
2
|
|
| Seat change
|
+1
|
|
|
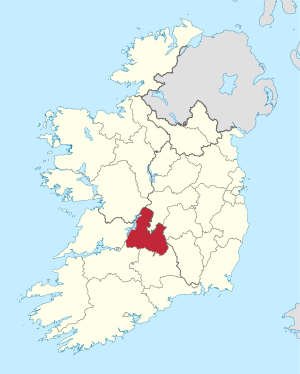 Map showing the area of North Tipperary County Council |
|
|
Council control after election
TBD
| |
An election to North Tipperary County Council took place on 20 June 1985 as part of that year's Irish local elections. 21 councillors were elected from four electoral divisions by PR-STV voting for a six-year term of office.
Results by party[]
| Party
|
Seats
|
±
|
First Pref. votes
|
FPv%
|
±%
|
|
|
Fianna Fáil
|
12
|
+3
|
15,818
|
52.78
|
|
|
|
Fine Gael
|
6
|
-2
|
8,736
|
29.15
|
|
|
|
Labour
|
1
|
-2
|
3,784
|
12.63
|
|
|
|
Independent
|
2
|
+1
|
1,649
|
5.5
|
|
| Totals
|
21
|
-
|
28,588
|
100.0
|
—
|
Results by Electoral Area[]
Borrisokane[]
Borrisokane - 4 seats
| Party |
Candidate |
FPv% |
Count
|
| 1 |
2 |
3 |
4 |
5
|
|
|
Fianna Fáil
|
Jim Casey
|
|
1,089
|
1,094
|
1,120
|
1,174
|
|
|
|
Fianna Fáil
|
Michael Hough*
|
|
966
|
975
|
1,028
|
1,068
|
1,284
|
|
|
Fianna Fáil
|
Tony McKenna*
|
|
876
|
888
|
931
|
957
|
1,325
|
|
|
Fine Gael
|
Liam Whyte*
|
|
742
|
762
|
838
|
1,077
|
1,115
|
|
|
Fianna Fáil
|
John Carroll
|
|
616
|
662
|
712
|
729
|
|
|
|
Fine Gael
|
Paddy Brennan
|
|
518
|
553
|
599
|
757
|
785
|
|
|
Fine Gael
|
Gerard Darcy
|
|
461
|
502
|
554
|
|
|
|
|
Labour
|
Jim Hough
|
|
288
|
409
|
|
|
|
|
|
Labour
|
Maureen Carmody
|
|
277
|
|
|
|
|
| Electorate: 7,793 Valid: 5,833 (75.66%) Spoilt: 54 Quota: 63 Turnout: 5,896
|
Nenagh-Newport[]
Nenagh-Newport - 7 seats
| Party |
Candidate |
FPv% |
Count
|
| 1 |
2 |
3 |
4 |
5 |
6 |
7 |
8 |
9 |
10 |
11
|
|
|
Labour
|
John RyanTD*
|
|
1,243
|
1,270
|
1,295
|
|
|
|
|
|
|
|
|
|
|
Fianna Fáil
|
Mairead Ryan
|
|
1,183
|
1,194
|
1,328
|
|
|
|
|
|
|
|
|
|
|
Fianna Fáil
|
Tom Harrington*
|
|
1,056
|
1,066
|
1,130
|
1,161
|
1,182
|
1,190
|
1,191
|
1,438
|
|
|
|
|
|
Independent
|
Joseph O'Connor*
|
|
946
|
949
|
959
|
1,034
|
1,090
|
1,092
|
1,093
|
1,130
|
1,133
|
1,287
|
|
|
|
Fianna Fáil
|
John Sheehy*
|
|
792
|
793
|
843
|
865
|
928
|
945
|
948
|
1,055
|
1,112
|
1,523
|
|
|
|
Fine Gael
|
Tom Ryan
|
|
770
|
773
|
775
|
860
|
899
|
899
|
899
|
916
|
917
|
1,005
|
1,030
|
|
|
Fine Gael
|
Tom Berkery*
|
|
739
|
751
|
757
|
815
|
953
|
954
|
955
|
1,007
|
1,013
|
1,046
|
1,062
|
|
|
Fianna Fáil
|
Ger Ryan*
|
|
690
|
693
|
718
|
782
|
789
|
792
|
792
|
852
|
909
|
|
|
|
|
Fine Gael
|
Willie Kennedy
|
|
688
|
715
|
726
|
739
|
836
|
837
|
838
|
1,010
|
1,041
|
1,065
|
1,077
|
|
|
Fianna Fáil
|
Jacksie Ryan
|
|
677
|
680
|
717
|
727
|
767
|
780
|
785
|
|
|
|
|
|
|
Fine Gael
|
Martin O'Sullivan
|
|
495
|
496
|
547
|
561
|
|
|
|
|
|
|
|
|
|
Fianna Fáil
|
Ned Foley
|
|
429
|
430
|
|
|
|
|
|
|
|
|
|
|
|
Labour
|
Frank Lewis*
|
|
419
|
446
|
451
|
|
|
|
|
|
|
|
|
|
|
Labour
|
Mary Brosnan
|
|
133
|
|
|
|
|
|
|
|
|
|
|
| Electorate: 13,646 Valid: 10,260 (76.13%) Spoilt: 129 Quota: 1,283 Turnout: 10,389
|
Roscrea-Templemore[]
Roscrea-Templemore - 5 seats
| Party |
Candidate |
FPv% |
Count
|
| 1 |
2 |
3 |
4 |
5 |
6 |
7
|
|
|
Fianna Fáil
|
Senator Michael Smith*
|
|
1,948
|
|
|
|
|
|
|
|
|
Fianna Fáil
|
Seán Mulrooney
|
|
1,071
|
1,344
|
|
|
|
|
|
|
|
Fianna Fáil
|
John Egan*
|
|
1,035
|
1,337
|
|
|
|
|
|
|
|
Fine Gael
|
Denis Ryan*
|
|
834
|
895
|
935
|
954
|
969
|
1,303
|
|
|
|
Fine Gael
|
Denis Meagher
|
|
700
|
755
|
763
|
796
|
846
|
924
|
1,026
|
|
|
Fine Gael
|
John Butler
|
|
679
|
703
|
710
|
747
|
783
|
840
|
873
|
|
|
Labour
|
Tommy Shanahan*
|
|
560
|
603
|
651
|
659
|
731
|
|
|
|
|
Labour
|
Kevin Devaney
|
|
178
|
200
|
204
|
217
|
|
|
|
| Electorate: 9,696 Valid: 7,005 (73.08%) Spoilt: 81 Quota: 1,168 Turnout: 7,086
|
Thurles[]
Thurles - 5 seats
| Party |
Candidate |
FPv% |
Count
|
| 1 |
2 |
3 |
4 |
5
|
|
|
Fianna Fáil
|
Jane Hanafin*
|
|
1,,751
|
|
|
|
|
|
|
Fine Gael
|
Michael Lowry*
|
|
1,542
|
|
|
|
|
|
|
Fianna Fáil
|
Harry Ryan*
|
|
978
|
1,140
|
1,193
|
|
|
|
|
Independent
|
Frank Dwan*
|
|
703
|
826
|
870
|
878
|
1,156
|
|
|
Labour
|
Andrew Callinan
|
|
686
|
747
|
795
|
807
|
|
|
|
Fianna Fáil
|
Larry Looby
|
|
661
|
879
|
916
|
930
|
1,061
|
|
|
Fine Gael
|
Mae Quinn
|
|
568
|
609
|
805
|
818
|
1,020
|
| Electorate: 10,297 Valid: 6,871 (67.55%) Spoilt: 85 Quota: 1,146 Turnout: 6,956
|
External links[]

Categories:
- 1985 Irish local elections
- North Tipperary County Council elections
Hidden categories:
- Use dmy dates from October 2021
- Use Hiberno-English from October 2021
- All Wikipedia articles written in Hiberno-English
