Election in North Carolina
Main article: 1988 United States presidential election
1988 United States presidential election in North Carolina
Nominee
George H. W. Bush Michael Dukakis
Party
Republican
Democratic
Home state
Texas
Massachusetts
Running mate
Dan Quayle Lloyd Bentsen
Electoral vote
13
0
Popular vote
1,237,258
890,167
Percentage
57.97%
41.71%
County Results
Bush
50–60%
60–70%
70–80%
Dukakis
40–50%
50–60%
60–70%
President before election Ronald Reagan Republican
Elected President George H.W. Bush Republican
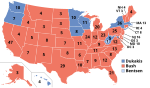
The 1988 United States presidential election in North Carolina took place on November 8, 1988, and was part of the 1988 United States presidential election . Voters chose 13 representatives, or electors to the Electoral College , who voted for president and vice president .
North Carolina Republican nominee, Vice President George H. W. Bush , over the Democratic nominee, Massachusetts governor Michael Dukakis . The final margin was 57.97% to 41.71%, which compared to the other southern states, was close to the southern average. As of the 2020 presidential election Pasquotank County voted for a Republican presidential candidate.[1]
Results [ ]
1988 United States presidential election in North Carolina[2]
Party
Candidate
Votes
Percentage
Electoral votes
Republican George H. W. Bush 1,237,258
57.97%
13
Democratic
Michael Dukakis
890,167
41.71%
0
New Alliance
Lenora Fulani
5,682
0.27%
0
Write-in
Ron Paul
1,263
0.06%
0
Invalid or blank votes
—
Totals
2,134,370
100.00%
13
Voter turnout
—
Results by county [ ]
George Herbert Walker Bush [3] Michael Stanley Dukakis [3] Leonora Branch Fulani [3] Ronald Ernest Paul[3]
Margin
Mitchell
76.82%
4,620
22.90%
1,377
0.28%
17
53.92%
3,243
Avery
75.33%
4,277
24.08%
1,367
0.39%
22
0.21%
12
51.25%
2,910
Randolph
73.32%
23,881
26.53%
8,641
0.15%
49
46.79%
15,240
Davie
71.37%
7,988
28.29%
3,166
0.34%
38
43.08%
4,822
Yadkin
71.10%
7,918
28.69%
3,195
0.22%
24
42.41%
4,723
Gaston
70.32%
34,775
29.49%
14,582
0.18%
87
0.01%
7
40.83%
20,193
Catawba
69.01%
28,872
30.89%
12,922
0.11%
44
38.12%
15,950
Davidson
68.11%
28,374
31.72%
13,215
0.17%
70
0.01%
3
36.39%
15,159
Henderson
67.68%
19,711
32.06%
9,338
0.20%
58
0.06%
18
35.62%
10,373
Cabarrus
67.75%
22,524
32.14%
10,686
0.08%
26
0.04%
12
35.61%
11,838
Wilkes
67.65%
15,231
32.11%
7,230
0.24%
53
35.54%
8,001
Iredell
67.02%
21,536
32.77%
10,530
0.19%
62
0.02%
7
34.25%
11,006
Caldwell
65.78%
15,176
34.08%
7,862
0.14%
33
31.70%
7,314
Union
65.71%
17,015
34.06%
8,820
0.18%
46
0.06%
15
31.65%
8,195
Alexander
65.56%
7,968
34.13%
4,148
0.27%
33
0.04%
5
31.43%
3,820
Rowan
65.48%
23,192
34.24%
12,127
0.27%
96
0.00%
1
31.24%
11,065
Alamance
65.48%
24,131
34.31%
12,642
0.19%
69
0.02%
9
31.18%
11,489
Moore
65.37%
14,543
34.35%
7,642
0.12%
27
0.16%
36
31.02%
6,901
Dare
64.85%
5,234
34.77%
2,806
0.36%
29
0.02%
2
30.08%
2,428
Nash
64.34%
15,906
35.35%
8,740
0.13%
32
0.18%
44
28.99%
7,166
Lincoln
64.26%
11,651
35.54%
6,444
0.18%
32
0.02%
3
28.72%
5,207
Stanly
64.13%
11,885
35.76%
6,627
0.09%
17
0.02%
3
28.37%
5,258
Johnston
63.97%
15,563
35.83%
8,717
0.14%
35
0.06%
14
28.14%
6,846
Cherokee
63.78%
4,557
35.93%
2,567
0.29%
21
27.85%
1,990
Onslow
62.87%
12,253
36.75%
7,162
0.36%
71
0.01%
2
26.12%
5,091
Clay
62.47%
2,174
37.04%
1,289
0.37%
13
0.11%
4
25.43%
885
Lee
62.47%
7,104
37.21%
4,231
0.30%
34
0.02%
2
25.27%
2,873
Wayne
62.48%
15,292
37.33%
9,135
0.19%
47
25.16%
6,157
Craven
62.10%
12,057
37.66%
7,313
0.24%
46
0.01%
1
24.43%
4,744
Transylvania
61.86%
7,009
37.78%
4,280
0.17%
19
0.19%
22
24.09%
2,729
Stokes
61.81%
8,661
37.96%
5,319
0.19%
27
0.04%
5
23.85%
3,342
Carteret
61.55%
11,076
38.12%
6,859
0.28%
51
0.04%
8
23.44%
4,217
Macon
61.39%
6,026
38.44%
3,773
0.13%
13
0.04%
4
22.95%
2,253
Graham
61.16%
2,091
38.40%
1,313
0.44%
15
22.76%
778
Surry
61.06%
11,393
38.83%
7,245
0.12%
22
22.23%
4,148
Currituck
60.98%
2,443
38.82%
1,555
0.12%
5
0.07%
3
22.17%
888
New Hanover
60.56%
23,807
39.18%
15,401
0.21%
82
0.06%
23
21.38%
8,406
Beaufort
60.35%
8,190
39.44%
5,352
0.21%
28
20.91%
2,838
Polk
60.31%
3,874
39.45%
2,534
0.20%
13
0.03%
2
20.86%
1,340
Rutherford
59.73%
10,337
40.02%
6,926
0.25%
43
19.71%
3,411
Ashe
59.69%
6,019
40.01%
4,034
0.17%
17
0.13%
13
19.69%
1,985
Mecklenburg
59.42%
106,236
40.22%
71,907
0.35%
619
0.02%
34
19.20%
34,329
Burke
59.41%
15,933
40.45%
10,848
0.10%
26
0.04%
12
18.96%
5,085
McDowell
59.34%
6,526
40.46%
4,449
0.20%
22
18.89%
2,077
Forsyth
59.02%
57,688
40.65%
39,726
0.31%
302
0.02%
19
18.38%
17,962
Watauga
58.59%
8,662
40.91%
6,048
0.39%
57
0.12%
18
17.68%
2,614
Lenoir
58.13%
10,669
41.68%
7,649
0.19%
34
0.01%
1
16.46%
3,020
Buncombe
57.55%
36,828
42.14%
26,964
0.29%
185
0.02%
15
15.41%
9,864
Cleveland
57.54%
14,039
42.30%
10,321
0.11%
28
0.04%
9
15.24%
3,718
Harnett
57.25%
9,749
42.63%
7,259
0.12%
21
14.62%
2,490
Wilson
57.11%
10,997
42.65%
8,214
0.21%
40
0.03%
6
14.45%
2,783
Wake
56.87%
81,613
42.75%
61,352
0.34%
482
0.04%
57
14.12%
20,261
Guilford
56.35%
66,060
42.95%
50,351
0.24%
276
0.46%
545
13.40%
15,709
Person
56.00%
4,832
43.78%
3,777
0.20%
17
0.02%
2
12.23%
1,055
Brunswick
55.78%
10,007
43.93%
7,881
0.18%
32
0.11%
19
11.85%
2,126
Rockingham
55.77%
14,591
44.15%
11,551
0.08%
21
0.00%
1
11.62%
3,040
Pitt
55.08%
18,245
44.61%
14,777
0.22%
72
0.10%
33
10.47%
3,468
Perquimans
53.32%
1,781
46.20%
1,543
0.42%
14
0.06%
2
7.13%
238
Madison
53.07%
3,453
46.62%
3,033
0.31%
20
6.46%
420
Cumberland
53.07%
27,057
46.66%
23,789
0.24%
121
0.02%
12
6.41%
3,268
Montgomery
52.80%
4,504
46.83%
3,995
0.36%
31
5.97%
509
Pender
52.84%
4,926
46.95%
4,377
0.14%
13
0.08%
7
5.89%
549
Yancey
52.00%
4,160
47.54%
3,803
0.46%
37
4.46%
357
Chowan
51.56%
1,884
48.06%
1,756
0.38%
14
3.50%
128
Sampson
51.49%
8,524
48.38%
8,009
0.13%
22
3.11%
515
Camden
50.87%
1,144
48.07%
1,081
1.07%
24
2.80%
63
Pamlico
50.98%
2,297
48.56%
2,188
0.47%
21
2.42%
109
Jackson
51.03%
5,166
48.73%
4,933
0.24%
24
2.30%
233
Alleghany
50.98%
2,174
48.94%
2,087
0.07%
3
2.04%
87
Pasquotank
50.76%
4,006
48.91%
3,860
0.32%
25
0.01%
1
1.85%
146
Franklin
50.17%
5,499
49.62%
5,438
0.20%
22
0.01%
1
0.56%
61
Vance
49.88%
5,625
49.94%
5,631
0.16%
18
0.02%
2
-0.05%
-6
Haywood
49.68%
8,957
49.98%
9,010
0.27%
48
0.07%
13
-0.29%
-53
Swain
49.52%
1,795
50.23%
1,821
0.25%
9
-0.72%
-26
Duplin
49.24%
5,774
50.70%
5,945
0.06%
7
-1.46%
-171
Granville
46.75%
4,880
50.58%
5,280
2.62%
274
0.05%
5
-3.83%
-400
Chatham
47.81%
6,999
51.92%
7,600
0.18%
27
0.09%
13
-4.11%
-601
Greene
47.69%
2,498
52.10%
2,729
0.21%
11
-4.41%
-231
Martin
46.61%
3,149
53.26%
3,598
0.10%
7
0.03%
2
-6.65%
-449
Halifax
46.03%
7,462
53.83%
8,726
0.14%
23
-7.80%
-1,264
Jones
45.78%
1,649
54.03%
1,946
0.19%
7
-8.25%
-297
Durham
45.43%
29,928
53.79%
35,441
0.73%
478
0.05%
36
-8.37%
-5,513
Scotland
45.16%
3,199
54.56%
3,865
0.28%
20
-9.40%
-666
Tyrrell
44.70%
637
55.09%
785
0.21%
3
-10.39%
-148
Caswell
43.93%
3,299
55.79%
4,189
0.27%
20
0.01%
1
-11.85%
-890
Washington
43.69%
2,186
56.08%
2,806
0.22%
11
0.02%
1
-12.39%
-620
Edgecombe
42.92%
6,831
56.82%
9,044
0.19%
31
0.06%
10
-13.90%
-2,213
Bladen
42.77%
3,770
57.08%
5,031
0.15%
13
-14.31%
-1,261
Columbus
41.93%
6,659
57.75%
9,172
0.32%
51
-15.82%
-2,513
Gates
41.64%
1,451
58.08%
2,024
0.29%
10
-16.44%
-573
Hyde
41.52%
940
58.13%
1,316
0.35%
8
-16.61%
-376
Richmond
41.39%
5,073
58.34%
7,151
0.21%
26
0.06%
7
-16.95%
-2,078
Orange
39.13%
14,503
60.23%
22,326
0.35%
131
0.29%
107
-21.11%
-7,823
Hoke
37.88%
2,020
61.52%
3,281
0.60%
32
-23.65%
-1,261
Hertford
37.54%
2,977
62.33%
4,943
0.11%
9
0.01%
1
-24.79%
-1,966
Robeson
36.70%
9,908
62.92%
16,988
0.39%
104
-26.22%
-7,080
Anson
36.45%
2,782
63.29%
4,831
0.26%
20
-26.84%
-2,049
Bertie
36.24%
2,145
63.56%
3,762
0.20%
12
-27.32%
-1,617
Northampton
34.34%
2,415
65.39%
4,599
0.27%
19
-31.05%
-2,184
Warren
33.64%
2,163
66.09%
4,249
0.26%
17
-32.45%
-2,086
References [ ] show State and district results of the 1988 U.S. presidential election
Alabama Alaska Arizona Arkansas California Colorado Connecticut Delaware District of Columbia Florida Georgia Hawaii Idaho Illinois Indiana Iowa Kansas Kentucky Louisiana Maine Maryland Massachusetts Michigan Minnesota Mississippi Missouri Montana Nebraska Nevada New Hampshire New Jersey New Mexico New York North Carolina North Dakota Ohio Oklahoma Oregon Pennsylvania Rhode Island South Carolina South Dakota Tennessee Texas Utah Vermont Virginia Washington West Virginia Wisconsin Wyoming