1988 United States presidential election in South Carolina
| ||||||||||||||||||||||||||
| ||||||||||||||||||||||||||
 County Results
| ||||||||||||||||||||||||||
| ||||||||||||||||||||||||||


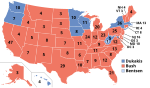
The 1988 United States presidential election in South Carolina took place on November 8, 1988. All 50 states and the District of Columbia, were part of the 1988 United States presidential election. South Carolina voters chose eight electors to the Electoral College, which selected the president and vice president.
South Carolina was won by incumbent United States Vice President George H. W. Bush of Texas, who was running against Massachusetts Governor Michael Dukakis. Bush ran with Indiana Senator Dan Quayle as Vice President, and Dukakis ran with Texas Senator Lloyd Bentsen.
South Carolina weighed in for this election as 16% more Republican than the national average, and was the fourth most Republican state in the nation behind Utah, New Hampshire and Idaho.[1]
Partisan background[]

The presidential election of 1988 was a very partisan election for South Carolina, with more than 99% of the electorate voting for either the Democratic or Republican parties, and only 4 candidates appearing on the ballot.[2] As can be seen in several states across the country during this election, the large population centers in South Carolina voted Republican, but several counties near-by the large population centers voted Democratic, suggesting the influence of suburban populations. A good example of this effect, is with the city of Columbia's Richland County, which voted Republican, while its less-populated neighbor, Fairfield County, voted Democratic. This geographic trend is opposite of what you would expect to see with these parties, and once again may suggest an element of influence from (for example) the city of Columbia's suburban districts.
As of the 2020 presidential election, this is the last election in which Richland County voted for a Republican Presidential candidate.[3]
Republican victory[]
Bush won the election in South Carolina with a solid 24 point sweep-out landslide. South Carolina has voted for the same candidate as its sister Southern States in every presidential election since 1968. Bush's easy win in the former Democratic bastion was reflective of a nationwide reconsolidation of base for the Republican Party, which took place through the 1980s. Through the passage of some very controversial economic programs, spearheaded by then President Ronald Reagan (called, collectively, "Reaganomics"), the mid-to-late 1980s saw a period of economic growth and stability. The hallmark for Reaganomics was, in part, the wide-scale deregulation of corporate interests, and tax cuts for the wealthy.[4]
Dukakis ran on a socially liberal platform, and advocated for higher economic regulation and environmental protection. Bush, alternatively, ran on a campaign of continuing the social and economic policies of former President Reagan – which gained him much support with social conservatives and people living in rural areas.
| Elections in South Carolina |
|---|
 |
Results[]
| United States presidential election in South Carolina, 1988 | |||||
|---|---|---|---|---|---|
| Party | Candidate | Votes | Percentage | Electoral votes | |
| Republican | George H. W. Bush | 606,443 | 61.50% | 8 | |
| Democratic | Michael Dukakis | 370,554 | 37.58% | 0 | |
| Libertarian | Ron Paul | 4,935 | 0.50% | 0 | |
| New Alliance Party | Lenora Fulani | 4,077 | 0.41% | 0 | |
| Totals | 986,009 | 100.0% | 8 | ||
Results by county[]
| County | George Herbert Walker Bush Republican |
Michael Stanley Dukakis Democratic |
Various candidates Other parties |
Margin | Total votes cast | ||||
|---|---|---|---|---|---|---|---|---|---|
| # | % | # | % | # | % | # | % | ||
| Abbeville | 3,738 | 50.51% | 3,629 | 49.03% | 34 | 0.46% | 109 | 1.47% | 7,401 |
| Aiken | 27,665 | 71.84% | 10,598 | 27.52% | 244 | 0.63% | 17,067 | 44.32% | 38,507 |
| Allendale | 1,295 | 41.59% | 1,796 | 57.68% | 23 | 0.74% | -501 | -16.09% | 3,114 |
| Anderson | 25,939 | 67.58% | 12,281 | 32.00% | 163 | 0.42% | 13,658 | 35.58% | 38,383 |
| Bamberg | 2,403 | 45.73% | 2,830 | 53.85% | 22 | 0.42% | -427 | -8.13% | 5,255 |
| Barnwell | 4,467 | 63.14% | 2,564 | 36.24% | 44 | 0.62% | 1,903 | 26.90% | 7,075 |
| Beaufort | 16,184 | 64.68% | 8,691 | 34.73% | 146 | 0.58% | 7,493 | 29.95% | 25,021 |
| Berkeley | 16,779 | 63.81% | 9,312 | 35.41% | 206 | 0.78% | 7,467 | 28.39% | 26,297 |
| Calhoun | 2,585 | 54.00% | 2,175 | 45.44% | 27 | 0.56% | 410 | 8.56% | 4,787 |
| Charleston | 49,149 | 59.28% | 32,977 | 39.77% | 790 | 0.95% | 16,172 | 19.50% | 82,916 |
| Cherokee | 7,763 | 63.89% | 4,322 | 35.57% | 66 | 0.54% | 3,441 | 28.32% | 12,151 |
| Chester | 3,968 | 51.21% | 3,737 | 48.23% | 43 | 0.55% | 231 | 2.98% | 7,748 |
| Chesterfield | 4,999 | 51.35% | 4,699 | 48.27% | 37 | 0.38% | 300 | 3.08% | 9,735 |
| Clarendon | 4,337 | 46.15% | 5,030 | 53.53% | 30 | 0.32% | -693 | -7.37% | 9,397 |
| Colleton | 4,962 | 51.97% | 4,508 | 47.22% | 77 | 0.81% | 454 | 4.76% | 9,547 |
| Darlington | 9,854 | 55.23% | 7,625 | 42.73% | 364 | 2.04% | 2,229 | 12.49% | 17,843 |
| Dillon | 3,793 | 53.66% | 3,251 | 45.99% | 25 | 0.35% | 542 | 7.67% | 7,069 |
| Dorchester | 14,756 | 66.37% | 7,371 | 33.15% | 105 | 0.47% | 7,385 | 33.22% | 22,232 |
| Edgefield | 3,814 | 55.57% | 3,020 | 44.00% | 29 | 0.42% | 794 | 11.57% | 6,863 |
| Fairfield | 2,714 | 41.23% | 3,827 | 58.13% | 42 | 0.64% | -1,113 | -16.91% | 6,583 |
| Florence | 19,490 | 60.50% | 12,531 | 38.90% | 193 | 0.60% | 6,959 | 21.60% | 32,214 |
| Georgetown | 7,032 | 56.23% | 5,402 | 43.20% | 72 | 0.58% | 1,630 | 13.03% | 12,506 |
| Greenville | 67,371 | 70.82% | 27,188 | 28.58% | 567 | 0.60% | 40,183 | 42.24% | 95,126 |
| Greenwood | 9,096 | 57.92% | 6,511 | 41.46% | 97 | 0.62% | 2,585 | 16.46% | 15,704 |
| Hampton | 2,826 | 44.81% | 3,435 | 54.47% | 45 | 0.71% | -609 | -9.66% | 6,306 |
| Horry | 24,843 | 64.68% | 13,316 | 34.67% | 250 | 0.65% | 11,527 | 30.01% | 38,409 |
| Jasper | 2,004 | 40.66% | 2,894 | 58.71% | 31 | 0.63% | -890 | -18.06% | 4,929 |
| Kershaw | 8,877 | 65.89% | 4,494 | 33.36% | 102 | 0.76% | 4,383 | 32.53% | 13,473 |
| Lancaster | 9,152 | 59.46% | 6,181 | 40.15% | 60 | 0.39% | 2,971 | 19.30% | 15,393 |
| Laurens | 9,731 | 61.97% | 5,930 | 37.77% | 41 | 0.26% | 3,801 | 24.21% | 15,702 |
| Lee | 2,936 | 46.17% | 3,423 | 53.83% | 0 | 0.00% | -487 | -7.66% | 6,359 |
| Lexington | 41,467 | 77.89% | 11,366 | 21.35% | 405 | 0.76% | 30,101 | 56.54% | 53,238 |
| McCormick | 1,172 | 40.22% | 1,722 | 59.09% | 20 | 0.69% | -550 | -18.87% | 2,914 |
| Marion | 4,403 | 46.42% | 5,008 | 52.79% | 75 | 0.79% | -605 | -6.38% | 9,486 |
| Marlboro | 2,921 | 42.52% | 3,937 | 57.31% | 12 | 0.17% | -1,016 | -14.79% | 6,870 |
| Newberry | 6,427 | 62.37% | 3,825 | 37.12% | 53 | 0.51% | 2,602 | 25.25% | 10,305 |
| Oconee | 10,184 | 69.83% | 4,299 | 29.48% | 102 | 0.70% | 5,885 | 40.35% | 14,585 |
| Orangeburg | 13,281 | 47.35% | 14,655 | 52.25% | 113 | 0.40% | -1,374 | -4.90% | 28,049 |
| Pickens | 17,448 | 73.63% | 6,103 | 25.76% | 145 | 0.61% | 11,345 | 47.88% | 23,696 |
| Richland | 43,841 | 52.74% | 36,420 | 43.81% | 2,862 | 3.44% | 7,421 | 8.93% | 83,123 |
| Saluda | 3,225 | 61.64% | 1,984 | 37.92% | 23 | 0.44% | 1,241 | 23.72% | 5,232 |
| Spartanburg | 40,801 | 63.19% | 22,964 | 35.57% | 803 | 1.24% | 17,837 | 27.63% | 64,568 |
| Sumter | 13,161 | 57.72% | 9,502 | 41.67% | 138 | 0.61% | 3,659 | 16.05% | 22,801 |
| Union | 6,019 | 57.52% | 4,420 | 42.24% | 26 | 0.25% | 1,599 | 15.28% | 10,465 |
| Williamsburg | 5,914 | 44.39% | 7,343 | 55.11% | 67 | 0.50% | -1,429 | -10.73% | 13,324 |
| York | 21,657 | 65.02% | 11,458 | 34.40% | 193 | 0.58% | 10,199 | 30.62% | 33,308 |
| Totals | 606,443 | 61.50% | 370,554 | 37.58% | 9,012 | 0.91% | 235,889 | 23.92% | 986,009 |
See also[]
- Presidency of George H. W. Bush
References[]
- ^ "1988 Presidential Election Statistics". Dave Leip's Atlas of U.S. Presidential Elections. Retrieved 2018-03-05.
- ^ "1988 Presidential General Election Results – South Carolina". Dave Leip's Atlas of U.S. Presidential Elections. Retrieved 2018-03-05.
- ^ Sullivan, Robert David; ‘How the Red and Blue Map Evolved Over the Past Century’; America Magazine in The National Catholic Review; June 29, 2016
- ^ "Since 1980s, the Kindest of Tax Cuts for the Rich". The New York Times. 2012-01-18. Retrieved 2013-07-21.
| show State and district results of the 1988 U.S. presidential election |
|---|
- 1988 United States presidential election by state
- United States presidential elections in South Carolina
- 1988 South Carolina elections