From Wikipedia, the free encyclopedia
This article
does not cite any sources .
Please help by adding citations to reliable sources . Unsourced material may be challenged and removed .Find sources: – · · · scholar · JSTOR (June 2019 ) (Learn how and when to remove this template message
1999 South Tipperary County Council election
First party
Second party
Third party
Party
Fianna Fáil
Fine Gael
Labour
Seats won
12
9
1
Seat change
+2
-
-3
Fourth party
Party
Independent
Seats won
4
Seat change
+1
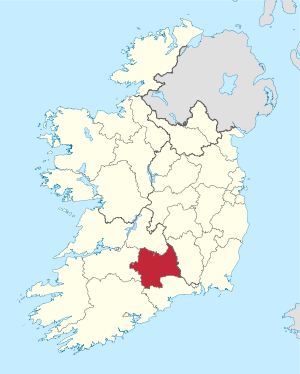
Map showing the area of South Tipperary County Council
Council control after election TBD
An election to South Tipperary County Council that year's Irish local elections . 26 councillors were elected from five electoral divisions by PR-STV voting for a five-year term of office.
Results by party [ ]
Party
Seats
±
First Pref. votes
FPv%
±%
Fianna Fáil
12
+2
14,909
40.15
Fine Gael
9
-
10,419
28.06
Labour
1
-3
4,575
12.32
Independent
4
+1
6,575
17.71
Totals
26
-
37,129
100.0
—
Results by Electoral Area [ ] Cahir [ ]
Cahir - 4 seats
Party
Candidate
FPv% Count
1
2
3
4
5
Fianna Fáil
Michael Anglim *
24.42
1,475
Fianna Fáil
Mattie McGrath 16.03
968
1,058
1,255
Fianna Fáil
Barry O'Brien
15.60
942
995
1,137
1,274
Fine Gael
Liam Ahearn
12.75
770
806
861
1,020
1,045
Fine Gael
Dan Costigan
11.14
673
696
805
1,074
1,114
Labour
Seanie Lonergan
11.14
673
700
736
Fianna Fáil
Andy Moloney
8.92
539
576
Electorate: 9,184 Valid: 6,040 (65.77%) Spoilt: 75 Quota: 1,209 Turnout: 6,115 (66.58%)
Cashel [ ]
Cashel - 4 seats
Party
Candidate
FPv% Count
1
2
3
4
5
Fine Gael
Jack Crowe *
21.62
1,444
Fine Gael
Tom Hayes 18.36
1,226
1,273
1,377
Fine Gael
Tom Wood *
16.14
1,078
1,093
1,140
1,329
1,345
Fianna Fáil
Dr.Seán McCarthy *
12.75
1,022
1,031
1,194
1,311
1,319
Fianna Fáil
Roger Kennedy
10.99
734
746
917
1,126
1,143
Labour
Pat Barry
9.36
625
638
683
Fianna Fáil
Bridie Hammersley*
8.23
550
562
Electorate: 10,808 Valid: 6,679 (61.80%) Spoilt: 93 Quota: 1,336 Turnout: 6,772 (62.66%)
Clonmel [ ]
Clonmel - 7 seats
Party
Candidate
FPv% Count
1
2
3
4
5
6
7
8
9
10
11
12
13
WUA
Seamus Healy 17.17
1,525
Fianna Fáil
Tom Ambrose *
13.32
1,183
Fianna Fáil
Pat Norris *
12.20
1,084
1,111
Fine Gael
Seán Nyhan
7.58
673
705
712
718
736
753
787
808
848
905
975
1,025
1,078
Fine Gael
Derry Foley
7.20
640
648
654
658
668
674
685
689
701
765
809
842
855
Fianna Fáil
Niall Dennehy
5.61
498
519
520
542
552
564
594
610
630
681
865
940
974
WUA
Phil Prendergast 5.21
463
516
526
529
540
587
620
739
914
990
1,046
1,336
Fianna Fáil
Bernard Lennon
5.02
446
470
475
486
499
505
523
532
551
595
Independent
Ted Boyle*
4.73
420
445
451
463
476
493
532
553
592
656
719
787
817
Progressive Democrats
Tina Whitford
4.06
361
374
382
386
396
422
467
488
510
WUA
Billy Shoer
3.52
313
345
348
349
362
387
406
486
575
635
678
WUA
Alison Byrne
3.05
271
322
327
330
337
370
404
485
WUA
Brian O'Donnell
2.94
261
337
338
339
349
385
397
Labour
Anne Taylor
2.74
243
256
271
273
332
345
Independent
Terri O'Neill
2.54
226
248
253
254
266
Labour
Jimmy Keating
2.04
181
195
211
213
Labour
Canice Egan
1.08
96
99
Electorate: 15,142 Valid: 8,884 (58.67%) Spoilt: 139 Quota: 1,111 Turnout: 9,023 (59.59%)
Fethard [ ]
Fethard - 6 seats
Party
Candidate
FPv% Count
1
2
3
4
5
6
7
8
Labour
Denis Landy 14.78
1,247
Fianna Fáil
Susan Meagher *
13.19
1,113
1,114
1,118
1,129
1,203
1,274
Independent
Eddie O'Meara
10.40
877
878
881
891
944
997
1,083
1,124
Independent
Waltie Moloney
9.78
825
825
825
831
860
883
919
941
Fianna Fáil
Denis Bourke *
9.27
782
793
794
893
899
982
1,003
1,217
Fianna Fáil
Pat O'Meara
8.71
735
736
739
745
765
847
1,038
1,057
Fine Gael
John Dowley
5.64
560
566
571
643
688
762
777
Labour
Noel Quinlan
5.64
560
566
578
589
617
628
Fine Gael
John Fahey
5.61
558
559
569
579
736
742
850
1,121
Fine Gael
Noel Fitzgerald
5.07
428
428
436
442
Fianna Fáil
Dick Tobin
4.85
409
412
412
444
452
Progressive Democrats
Tony Kehoe
3.43
289
300
302
Independent
Sean Clancy
0.63
53
53
Electorate: 13,749 Valid: 8,436 (61.36%) Spoilt: 151 Quota: 1,206 Turnout: 8,587 (62.46%)
Tipperary [ ]
Tipperary - 5 seats
Party
Candidate
FPv% Count
1
2
3
4
5
6
7
8
Fine Gael
Michael Fitzgerald *
16.87
1,196
Fianna Fáil
Michael Maguire *
13.54
960
980
1,071
1,074
1,209
Fianna Fáil
Joe Donovan
12.96
919
943
974
976
1,039
1,047
1,290
Independent
Christy Kinahan *
12.81
908
1,018
1,141
1,142
1,173
1,175
1,277
Fine Gael
Brendan Griffin 8.42
597
630
726
731
929
935
1,067
1,126
Labour
Mick Byrnes
7.94
563
674
703
704
796
804
874
906
Fine Gael
John Clancy
8.12
576
587
608
609
Fianna Fáil
Bernie Doherty
7.76
550
582
616
617
657
660
Independent
Denis Leahy
6.12
434
459
Labour
Billy Bourke
5.46
387
Electorate: 11,436 Valid: 7,090 (62.00%) Spoilt: 103 Quota: 1,182 Turnout: 7,193 (62.90%)
External links [ ]
Categories :
1999 Irish local elections South Tipperary County Council elections Hidden categories:
Articles lacking sources from June 2019 All articles lacking sources Use dmy dates from October 2021 Use Hiberno-English from October 2021 All Wikipedia articles written in Hiberno-English
