From Wikipedia, the free encyclopedia
This article
does not cite any sources .
Please help by adding citations to reliable sources . Unsourced material may be challenged and removed .Find sources: – · · · scholar · JSTOR (October 2014 ) (Learn how and when to remove this template message
2004 South Tipperary County Council election
First party
Second party
Third party
Party
Fianna Fáil
Fine Gael
Labour
Seats won
10
8
2
Seat change
-2
-1
+1
Fourth party
Party
Independent
Seats won
6
Seat change
+2
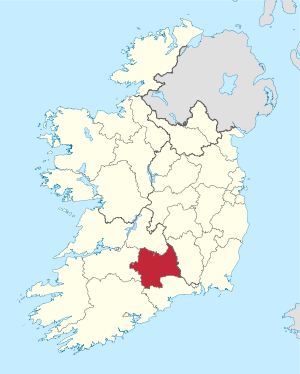
Map showing the area of South Tipperary County Council
Council control after election TBD
An election to South Tipperary County Council that year's Irish local elections . 26 councillors were elected from five electoral divisions by PR-STV voting for a five-year term of office.
Results by party [ ] Results by Electoral Area [ ] Cahir [ ]
Cahir - 4 seats
Party
Candidate
FPv% Count
1
2
3
4
5
6
7
8
9
10
Fianna Fáil
Mattie McGrath 27.58
1,902
Fianna Fáil
Michael Anglim *
16.24
1,120
1,315
1,322
1,363
1,474
Fine Gael
Liam Ahearn
11.21
773
818
824
849
870
878
900
977
1,054
1,297
Labour
Seanie Lonergan
9.15
631
667
693
712
733
740
823
940
978
1,080
Fine Gael
Dan Costigan*
7.87
543
566
582
604
633
641
694
768
803
941
Fine Gael
Marie Murphy
6.93
478
522
524
555
568
570
609
651
774
Fianna Fáil
Martin Neville
5.06
349
411
412
428
449
484
504
528
Independent
Gerry Duffy
4.77
329
351
378
392
401
407
448
Sinn Féin
Michael Nugent
4.07
281
306
315
319
345
351
Fianna Fáil
Patrick Byron
3.22
222
257
257
275
Progressive Democrats
Seán English
2.49
172
195
199
Independent
Liam Roche
1.41
97
109
Electorate: 10,248 Valid: 6,897 (67.30%) Spoilt: 107 Quota: 1,380 Turnout: 7,004 (68.35%)
Cashel [ ]
Cashel - 4 seats
Party
Candidate
FPv% Count
1
2
3
4
5
6
7
Fine Gael
Jack Crowe *
20.62
1,565
Fianna Fáil
Dr.Seán McCarthy *
16.53
1,255
1,262
1,337
1,398
1,481
1,522
Independent
Tom Wood *
16.39
1,244
1,250
1,375
1,474
1,731
Fianna Fáil
Roger Kennedy
10.08
765
771
829
876
984
1,029
1,427
Fine Gael
Catherine McLoughlin*
9.75
740
754
772
862
941
1,003
1,135
Fianna Fáil
Joseph O'Connell
8.27
628
632
652
759
788
805
Independent
Patrick Downey
6.44
489
491
556
599
Labour
Jim Hickey
5.99
455
460
504
Sinn Féin
Liam Browne
5.93
450
452
Electorate: 11,949 Valid: 7,591 (63.53%) Spoilt: 84 Quota: 1,519 Turnout: 7,675 (64.23%)
Clonmel [ ]
Clonmel - 7 seats
Party
Candidate
FPv% Count
1
2
3
4
5
6
7
8
9
10
11
12
WUA
Phil Prendergast 13.56
1,353
Fianna Fáil
Tom Ambrose *
10.63
1,061
1,067
1,073
1,093
1,161
1,191
1,217
1,277
WUA
Billy Shoer
8.68
866
895
927
947
983
1,064
1,169
1,198
1,198
1,299
WUA
Pat English
8.04
802
815
827
836
866
908
978
1,011
1,013
1,070
1,079
1,240
Fianna Fáil
Pat Norris *
7.12
710
713
725
762
777
786
794
815
820
956
964
1,048
Fine Gael
Seán Nyhan *
6.31
630
638
653
667
699
747
776
918
921
1,004
1,012
1,129
Fianna Fáil
Martin O'Brien
6.30
629
637
649
660
682
709
738
770
772
885
891
963
Fine Gael
Derry Foley *
6.21
620
623
627
663
700
717
729
939
946
1,006
1,014
1,142
Fianna Fáil
Niall Dennehy*
5.92
591
596
602
620
665
690
710
745
751
Fine Gael
Josephine Chamney
5.68
567
571
579
598
627
663
674
Green
Bernard Lennon
5.21
520
526
536
569
591
639
708
770
774
850
862
Sinn Féin
Brian Gearon
4.31
430
433
447
451
462
487
Independent
Ted Boyle
3.72
371
375
384
393
Labour
Anne Taylor
3.64
363
372
434
440
454
Progressive Democrats
P.J. Long
2.49
248
249
251
Labour
Cyril O'Flaherty
2.16
216
219
Electorate: 16,321 Valid: 9,977 (61.13%) Spoilt: 177 Quota: 1,248 Turnout: 10,154 (62.21%)
Fethard [ ]
Fethard - 6 seats
Party
Candidate
FPv% Count
1
2
3
4
5
6
7
8
9
Labour
Denis Landy 15.30
1,449
Independent
Eddie O'Meara *
14.35
1,359
Fine Gael
John Fahey *
11.91
1,128
1,130
1,141
1,238
1,272
1,383
Fine Gael
Michael O'Brien
9.52
901
904
917
963
981
1,087
1,114
1,127
1,130
Fianna Fáil
Susan Meagher *
8.99
851
852
895
976
1,014
1,441
Fine Gael
Joe Brennan
8.87
840
856
931
965
1,067
1,108
1,117
1,127
1,129
Fianna Fáil
Pat O'Meara*
8.01
758
758
767
916
937
Fianna Fáil
Denis Bourke *
7.17
679
702
888
903
1,072
1,136
1,188
1,195
1,196
Sinn Féin
David Dunne
5.79
548
565
623
655
Labour
Noel Quinlan
5.37
508
523
534
Fianna Fáil
Sylvia Cooney-Sheehan
4.72
447
466
Electorate: 14,623 Valid: 9,468 (64.75%) Spoilt: 170 Quota: 1,353 Turnout: 9,638 (65.91%)
Tipperary [ ]
Tipperary - 5 seats
Party
Candidate
FPv% Count
1
2
3
4
5
6
7
8
Fine Gael
Michael Fitzgerald *
22.04
1,727
Fianna Fáil
Michael Maguire *
11.94
936
1,004
1,037
1,061
1,157
1,295
1,417
Fianna Fáil
Joe Donovan *
11.18
876
949
982
1,012
1,065
1,109
1,163
1,179
Fianna Fáil
Dr. John Wallace
9.98
782
800
829
864
918
999
1,142
1,172
Independent
Christy Kinahan *
9.20
721
748
762
868
991
1,026
1,268
1,299
Independent
Denis Leahy
7.75
607
631
645
697
778
822
Fine Gael
John Crosse
7.60
596
715
727
772
863
1,105
1,249
1,271
Fine Gael
P.J. Maher
6.80
533
580
590
605
659
Independent
Mick Byrnes
6.55
513
528
539
600
Labour
Billy Bourke
4.82
378
391
403
Progressive Democrats
David Mullins
2.14
168
184
Electorate: 12,473 Valid: 7,837 (62.83%) Spoilt: 130 Quota: 1,307 Turnout: 7,967 (63.87%)
External links [ ]
Categories :
2004 Irish local elections South Tipperary County Council elections Hidden categories:
Articles lacking sources from October 2014 All articles lacking sources Use dmy dates from October 2021 Use Hiberno-English from October 2021 All Wikipedia articles written in Hiberno-English