From Wikipedia, the free encyclopedia
This article
does not cite any sources .
Please help by adding citations to reliable sources . Unsourced material may be challenged and removed .Find sources: – · · · scholar · JSTOR (August 2020 ) (Learn how and when to remove this template message
2004 Carlow County Council election
First party
Second party
Third party
Party
Fianna Fáil
Fine Gael
Labour
Seats won
8
7
4
Seat change
-1
-
+1
Fourth party
Fifth party
Party
Green
PD
Seats won
1
1
Seat change
-
-
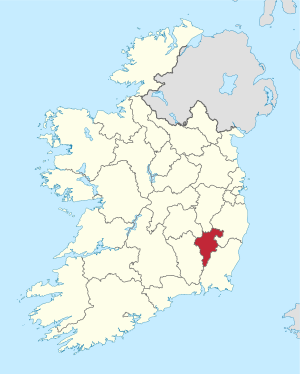
Map showing the area of Carlow County Council
Council control after election TBD
An election to Carlow County Council that year's Irish local elections . 21 councillors were elected from five electoral divisions by PR-STV voting for a five-year term of office.
Results by party [ ]
Party
Seats
±
First Pref. votes
FPv%
±%
Fianna Fáil
8
-1
7,844
36.32
Fine Gael
7
-
7,107
32.91
Labour
4
+1
3,713
17.19
Green
1
-
1,482
6.86
PD
1
-
730
3.38
Totals
21
-
21,596
100%
—
Results by Electoral Area [ ] Borris [ ]
Borris - 3 seats
Party
Candidate
FPv% Count
1
2
3
4
Labour
Michael Meaney *
33.13
1,002
Fine Gael
Tommy Kinsella
23.41
708
798
Green
Mary White 20.17
610
680
693
827
Fianna Fáil
Teddy Holden
11.84
358
412
426
608
Fianna Fáil
Peter O'Rourke
11.44
346
377
391
Electorate: 5,179 Valid: 3,024 (58.39%) Spoilt: 58 Quota: 757 Turnout: 3,082 (59.51%)
Carlow No.1 [ ]
Carlow No.1 - 3 seats
Party
Candidate
FPv% Count
1
2
3
4
Fianna Fáil
Jennifer Murnane-O'Connor *
30.23
843
Fianna Fáil
Joe McDonald *
19.47
543
609
655
741
Fine Gael
Declan Alcock *
15.13
422
449
485
613
Fine Gael
Colette Fennelly
14.95
417
431
457
562
Labour
Jimmy Brennan
12.44
347
374
450
Green
Matt Diskin
7.78
217
228
Electorate: 5,777 Valid: 2,789 (48.28%) Spoilt: 44 Quota: 698 Turnout: 2,857 (49.45%)
Carlow No.2 [ ]
Carlow No.2 - 5 seats
Party
Candidate
FPv% Count
1
2
3
4
5
6
7
8
9
10
Fine Gael
Michael Abbey *
22.94
1,094
Fianna Fáil
Rody Kelly *
17.38
853
PD
Walter Lacey *
14.87
730
788
797
814
852
Labour
Des Hurley
11.14
547
576
579
601
630
679
726
874
Fianna Fáil
Lorraine Hynes *
7.76
381
404
414
421
486
519
553
597
614
631
Green
Geraldine Callinan-O'Dea
6.21
305
320
321
336
349
412
432
Fine Gael
Wayne Fennell*
5.79
284
333
334
338
345
365
512
577
615
619
Fine Gael
Gerry Dunne
4.36
214
278
279
284
294
310
Fianna Fáil
Annie Parker-Byrne
3.95
194
208
214
226
Independent
Thompson Akinwunmi-Streets
3.83
188
204
206
230
244
Independent
Conor Dowling
2.42
119
126
127
Electorate: 10,135 Valid: 4,909 (48.44%) Spoilt: 126 Quota: 819 Turnout: 5,035 (49.68%)
Muinebheag [ ]
Muinebheag - 5 seats
Party
Candidate
FPv% Count
1
2
3
4
5
6
7
8
Labour
Jim Townsend 18.29
965
Fine Gael
Denis Foley
18.10
955
Fianna Fáil
Arthur McDonald *
12.66
668
675
691
710
721
766
820
931
Fianna Fáil
Enda Nolan *
12.05
636
656
691
697
719
776
803
890
Fine Gael
Michael Drea
8.38
442
447
461
480
503
533
611
654
Fianna Fáil
Eddie Cullen
7.77
410
416
431
436
456
521
541
Fine Gael
Michael Doran
7.62
402
408
413
425
463
531
579
760
Fianna Fáil
Martin Nevin
5.31
280
285
291
295
306
Labour
Liam O'Brien
4.02
212
238
238
245
312
323
Green
John James Tully
3.92
207
212
213
216
Fianna Fáil
Pat Abbey
1.88
99
104
Electorate: 9,184 Valid: 5,276 (57.45%) Spoilt: 99 Quota: 880 Turnout: 5,375 (58.53%)
Tullow [ ]
Tullow - 5 seats
Party
Candidate
FPv% Count
1
2
3
4
5
6
7
8
9
10
Fianna Fáil
P.J. Kavanagh *
15.47
866
866
875
909
929
932
977
Fianna Fáil
John Pender *
15.40
862
866
872
893
735
825
Fine Gael
Fred Hunter *
12.20
683
689
705
717
763
766
841
1,023
Fine Gael
Michael Deering *
11.09
621
635
650
667
688
691
740
859
910
920
Fine Gael
Pat O'Toole
9.63
539
540
553
562
585
587
695
718
727
733
Fianna Fáil
Noel Kennedy
9.02
505
525
531
536
565
567
574
Labour
William Paton *
7.54
422
423
445
527
591
593
651
702
731
741
Sinn Féin
Declan Sheeran
5.95
333
341
352
363
Fine Gael
John O'Donovan
5.82
326
326
344
378
392
393
Labour
Billy Nolan
3.89
218
220
242
Green
Patricia Carolan
2.55
143
152
Independent
Bill Leonard
1.43
80
Electorate: 9,693 Valid: 5,598 (57.75%) Spoilt: 72 Quota: 934 Turnout: 5,688 (58.68%)
External links [ ]
Categories :
2004 Irish local elections Carlow County Council elections Hidden categories:
Articles lacking sources from August 2020 All articles lacking sources All articles with dead external links Articles with dead external links from August 2019 Articles with permanently dead external links