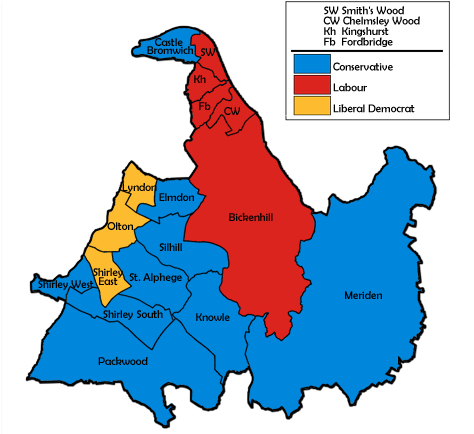
2002 Solihull Metropolitan Borough Council election
The 2002 Solihull Metropolitan Borough Council election took place on 2 May 2002 to elect members of Solihull Metropolitan Borough Council in the West Midlands, England. One third of the council was up for election and the Conservative Party stayed in overall control of the council.[1]
Campaign[]
Before the election the Conservatives held 29 seats, compared to 14 for Labour and 8 for the Liberal Democrats, with 17 seats being contested in the election.[2] The Conservatives had held a majority on the council since gaining 4 seats at the 2000 election.[2]
Issues in the election included a proposed development by Asda in Shirley, the fate of the Accident and Emergency department at Solihull hospital and new housing developments.[3][4] Labour also wanted to address a north-south divide in the council area and opposed any transfer of council housing from council control.[3][4]
Election result[]
The results saw the Conservatives stay in control of the council with 29 of the 51 seats after only 2 seats changed parties.[5] A couple of former councillors returned to the council, the former Labour leader of the council Michael Corser in Chelmsley Wood and Liberal Democrat June Gandy in Shirley East.[5]
| Party | Seats | Gains | Losses | Net gain/loss | Seats % | Votes % | Votes | +/− | |
|---|---|---|---|---|---|---|---|---|---|
| Conservative | 9 | 1 | 1 | 0 | 52.9 | 49.2 | 24,309 | -9.7% | |
| Labour | 5 | 0 | 1 | -1 | 29.4 | 23.7 | 11,741 | +5.5% | |
| Liberal Democrats | 3 | 1 | 0 | +1 | 17.6 | 27.1 | 13,390 | +4.5% | |
This result had the following consequences for the total number of seats on the council after the elections :[8]
| Party | Previous council | New council | |||
|---|---|---|---|---|---|
| Conservatives | 29 | 29 | |||
| Labour | 14 | 13 | |||
| Liberal Democrat | 8 | 9 | |||
| Total | 51 | 51 | |||
| Working majority | 7 | 7 | |||
Ward results[]
| Party | Candidate | Votes | % | ±% | |
|---|---|---|---|---|---|
| Labour | Jim Ryan | 2,013 | 54.2 | +27.0 | |
| Conservative | Joan Allsopp | 1,491 | 40.1 | -25.9 | |
| Liberal Democrats | Douglas Hogg | 210 | 5.7 | -1.1 | |
| Majority | 522 | 14.1 | -24.7 | ||
| Turnout | 3,714 | 35.7 | +4.2 | ||
| Labour hold | Swing | +26.4 | |||
| Party | Candidate | Votes | % | ±% | |
|---|---|---|---|---|---|
| Conservative | Beryl Kellie | 1,940 | 65.4 | -9.3 | |
| Labour | James Moore | 722 | 24.3 | +6.3 | |
| Liberal Democrats | John Knight | 306 | 10.3 | +3.0 | |
| Majority | 1,218 | 41.0 | -15.7 | ||
| Turnout | 2,968 | 31.8 | +1.4 | ||
| Conservative hold | Swing | -7.8 | |||
| Party | Candidate | Votes | % | ±% | |
|---|---|---|---|---|---|
| Labour | Michael Corser | 900 | 62.2 | +8.4 | |
| Conservative | Robert Courts | 350 | 24.2 | -9.2 | |
| Liberal Democrats | Bernard Wright | 197 | 13.6 | +0.9 | |
| Majority | 550 | 38.0 | +17.6 | ||
| Turnout | 1,447 | 19.6 | +4.1 | ||
| Labour hold | Swing | +8.8 | |||
| Party | Candidate | Votes | % | ±% | |
|---|---|---|---|---|---|
| Conservative | Kenneth Hawkins | 1,330 | 44.7 | -13.3 | |
| Labour | Sheila Brookes | 1,221 | 41.1 | +5.8 | |
| Liberal Democrats | Barbara Harber | 423 | 14.2 | +7.4 | |
| Majority | 109 | 3.7 | -19.0 | ||
| Turnout | 2,974 | 37.7 | -0.5 | ||
| Conservative gain from Labour | Swing | -9.5 | |||
| Party | Candidate | Votes | % | ±% | |
|---|---|---|---|---|---|
| Labour | Jacqueline Moore | 722 | 61.3 | +12.6 | |
| Conservative | Michael Robinson | 314 | 26.7 | -8.9 | |
| Liberal Democrats | Christopher Hayes | 142 | 12.1 | -3.5 | |
| Majority | 408 | 34.6 | +21.5 | ||
| Turnout | 1,178 | 19.8 | +5.2 | ||
| Labour hold | Swing | +10.7 | |||
| Party | Candidate | Votes | % | ±% | |
|---|---|---|---|---|---|
| Labour | Jeffrey Potts | 830 | 63.3 | +16.5 | |
| Conservative | Graham Juniper | 351 | 26.8 | -7.3 | |
| Liberal Democrats | Jennifer Wright | 131 | 10.0 | +3.1 | |
| Majority | 479 | 36.5 | +23.8 | ||
| Turnout | 1,312 | 23.8 | +0.9 | ||
| Labour hold | Swing | +11.9 | |||
| Party | Candidate | Votes | % | ±% | |
|---|---|---|---|---|---|
| Conservative | Diana Holl-Allen | 2,106 | 65.3 | -8.1 | |
| Liberal Democrats | Nigel Dyer | 693 | 21.5 | +5.1 | |
| Labour | Patricia Harrop | 427 | 13.2 | +3.0 | |
| Majority | 1,413 | 43.8 | -13.3 | ||
| Turnout | 3,226 | 36.9 | +1.6 | ||
| Conservative hold | Swing | -6.6 | |||
| Party | Candidate | Votes | % | ±% | |
|---|---|---|---|---|---|
| Liberal Democrats | Robert Reeves | 1,583 | 65.4 | +7.2 | |
| Conservative | Gary Allport | 478 | 19.7 | -9.1 | |
| Labour | Catherine Connan | 360 | 14.9 | +1.9 | |
| Majority | 1,105 | 45.6 | +16.3 | ||
| Turnout | 2,421 | 31.8 | +3.2 | ||
| Liberal Democrats hold | Swing | +8.1 | |||
| Party | Candidate | Votes | % | ±% | |
|---|---|---|---|---|---|
| Conservative | Peter Lea | 2,369 | 69.6 | +0.6 | |
| Labour | Jonathan Maltman | 561 | 16.5 | -0.5 | |
| Liberal Democrats | Peter Whitlock | 475 | 14.0 | +0.0 | |
| Majority | 1,808 | 53.1 | +1.1 | ||
| Turnout | 3,405 | 36.0 | +3.7 | ||
| Conservative hold | Swing | +0.5 | |||
| Party | Candidate | Votes | % | ±% | |
|---|---|---|---|---|---|
| Liberal Democrats | John Windmill | 2,192 | 61.8 | +11.0 | |
| Conservative | Patricia Handslip | 1,078 | 30.4 | -12.3 | |
| Labour | Eric Collins | 277 | 7.8 | +1.3 | |
| Majority | 1,114 | 31.4 | +23.2 | ||
| Turnout | 3,547 | 38.6 | +2.7 | ||
| Liberal Democrats hold | Swing | +11.6 | |||
| Party | Candidate | Votes | % | ±% | |
|---|---|---|---|---|---|
| Conservative | Kenneth Meeson | 2,627 | 60.7 | +4.6 | |
| Liberal Democrats | Eric Widger | 1,417 | 32.8 | -6.3 | |
| Labour | Florence Nash | 281 | 6.5 | +1.6 | |
| Majority | 1,210 | 28.0 | +11.0 | ||
| Turnout | 4,325 | 37.9 | -3.2 | ||
| Conservative hold | Swing | +5.4 | |||
| Party | Candidate | Votes | % | ±% | |
|---|---|---|---|---|---|
| Liberal Democrats | June Gandy | 2,028 | 57.1 | +14.2 | |
| Conservative | Brian Burgess | 1,242 | 35.0 | -16.3 | |
| Labour | Kevin Raven | 279 | 7.9 | +2.1 | |
| Majority | 786 | 22.1 | +13.7 | ||
| Turnout | 3,549 | 39.1 | +0.1 | ||
| Liberal Democrats gain from Conservative | Swing | +15.2 | |||
| Party | Candidate | Votes | % | ±% | |
|---|---|---|---|---|---|
| Conservative | David Evans | 2,023 | 54.3 | -13.0 | |
| Liberal Democrats | Roger Gemmell | 1,031 | 27.7 | +13.2 | |
| Labour | Barney McElholm | 673 | 18.1 | +0.0 | |
| Majority | 992 | 26.6 | -22.6 | ||
| Turnout | 3,727 | 28.7 | +2.5 | ||
| Conservative hold | Swing | -13.1 | |||
| Party | Candidate | Votes | % | ±% | |
|---|---|---|---|---|---|
| Conservative | Richard Lewis | 1,487 | 54.1 | -8.9 | |
| Labour | Arthur Harper | 681 | 24.8 | +1.9 | |
| Liberal Democrats | Anthony Verduyn | 581 | 21.1 | +7.0 | |
| Majority | 806 | 29.3 | -10.7 | ||
| Turnout | 2,749 | 30.4 | +0.9 | ||
| Conservative hold | Swing | -5.4 | |||
| Party | Candidate | Votes | % | ±% | |
|---|---|---|---|---|---|
| Conservative | Sheila Pittaway | 2,145 | 61.7 | -6.0 | |
| Liberal Democrats | Brenda Chapple | 819 | 23.5 | +3.3 | |
| Labour | Marcus Bennion | 514 | 14.8 | +2.7 | |
| Majority | 1,326 | 38.1 | -9.5 | ||
| Turnout | 3,478 | 35.3 | +1.6 | ||
| Conservative hold | Swing | -4.6 | |||
| Party | Candidate | Votes | % | ±% | |
|---|---|---|---|---|---|
| Labour | Hugh Hendry | 887 | 65.1 | +10.1 | |
| Conservative | Daniel Kettle | 297 | 21.8 | -11.0 | |
| Liberal Democrats | Keith Brown | 179 | 13.1 | +0.8 | |
| Majority | 590 | 43.3 | +21.3 | ||
| Turnout | 1,363 | 18.4 | +3.9 | ||
| Labour hold | Swing | +10.5 | |||
| Party | Candidate | Votes | % | ±% | |
|---|---|---|---|---|---|
| Conservative | Kathleen Wild | 2,681 | 66.1 | -8.6 | |
| Liberal Democrats | Christine Reeves | 983 | 24.2 | +8.2 | |
| Labour | James Burman | 393 | 9.7 | +0.4 | |
| Majority | 1,698 | 41.9 | -16.9 | ||
| Turnout | 4,057 | 37.1 | +2.6 | ||
| Conservative hold | Swing | -8.4 | |||
By-elections between 2002 and 2003[]
| Party | Candidate | Votes | % | ±% | |
|---|---|---|---|---|---|
| Liberal Democrats | Howard Allen | 1,179 | 54.9 | +33.8 | |
| Conservative | Joan Allsopp | 777 | 36.2 | -17.9 | |
| Labour | Arthur Harper | 192 | 8.9 | -15.9 | |
| Majority | 402 | 18.7 | -10.6 | ||
| Turnout | 2,148 | 23.8 | -6.6 | ||
| Liberal Democrats gain from Conservative | Swing | +25.8 | |||
References[]
- ^ "Solihull". BBC News Online. Retrieved 12 December 2010.
- ^ a b "Shaky Labour dreads upset; How the candidates line up for the May 2 council elections". Birmingham Mail. 12 April 2002. p. 8.
- ^ a b Hudson, Jenny (26 April 2002). "Local elections 2002: A safe bet Solihull will not be changing, but watch Shirley ; In the second in a series of profiles looking at key areas where local council elections will be held on May 2, Jenny Hudson looks at Solihull". Birmingham Post. p. 4.
- ^ a b Watts, Anna (1 May 2002). "Tories poised to stay in control; Mail news focus on tomorrow's local elections". Birmingham Mail. p. 5.
- ^ a b Watts, Anna (3 May 2002). "Local Election Results 2002: True Blue Solihull". Birmingham Mail. p. 20.
- ^ a b c d e f g h i j k l m n o p q r "Borough Council election" (PDF). Solihull Metropolitan Borough Council. Archived from the original (PDF) on 16 May 2011. Retrieved 12 December 2010.
- ^ "Election results; Local Election". The Times. 4 May 2002. p. 16.
- ^ "Full results". Financial Times. 4 May 2002. p. 7.
- ^ Dale, Paul (15 March 2003). "Solihull election shock as Tories swept aside". Birmingham Post. p. 1.
| Birmingham | |
|---|---|
| Coventry | |
| Dudley | |
| Sandwell | |
| Solihull | |
| Walsall | |
| Wolverhampton | |
| West Midlands CC |
|
| Mayor |
|
| |
- 2002 English local elections
- Solihull Council elections
- 2000s in the West Midlands (county)