2003 Stevenage Borough Council election
| |||||||||||||||||||||||||||||||||
13 of the 39 seats to Stevenage Borough Council 20 seats needed for a majority | |||||||||||||||||||||||||||||||||
|---|---|---|---|---|---|---|---|---|---|---|---|---|---|---|---|---|---|---|---|---|---|---|---|---|---|---|---|---|---|---|---|---|---|
| |||||||||||||||||||||||||||||||||
 Map showing the results of contested wards in the 2003 Stevenage Borough Council elections. | |||||||||||||||||||||||||||||||||
| |||||||||||||||||||||||||||||||||
Elections to Stevenage Council in Hertfordshire, England were held on 1 May 2003. One third of the council was up for election; the seats of the candidates who finished first in each ward in the all-out election of 1999. The Labour Party stayed in overall control of the council,[1] as had been predicted before the election.[2] Overall turnout was 52.2%.[3]
After the election, the composition of the council was:
- Labour 33
- Liberal Democrat 3
- Conservative 3
Election result[]
| Party | Seats | Gains | Losses | Net gain/loss | Seats % | Votes % | Votes | +/− | |
|---|---|---|---|---|---|---|---|---|---|
| Labour | 11 | 0 | 84.6 | 47.7 | 14,542 | -5.5% | |||
| Liberal Democrats | 1 | 0 | 7.7 | 25.4 | 7,733 | +6.7% | |||
| Conservative | 1 | 0 | 7.7 | 25.1 | 7,659 | -1.0% | |||
| Green | 0 | 0 | 0 | 1.4 | 431 | -0.3% | |||
| Socialist Alternative | 0 | 0 | 0 | 0.4 | 112 | +0.0% | |||
Ward results[]
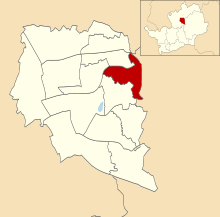
Bandley Hill[]

Location of Bandley Hill ward
| Party | Candidate | Votes | % | ±% | |
|---|---|---|---|---|---|
| Labour | Jacqueline Hollywell | 1,174 | 52.2 | -13.8 | |
| Conservative | Freda Warner | 650 | 28.9 | -5.1 | |
| Liberal Democrats | Sean McManus | 425 | 18.9 | +18.9 | |
| Majority | 524 | 23.3 | -8.7 | ||
| Turnout | 2,249 | 47.0 | |||
Bedwell[]

Location of Bedwell ward
| Party | Candidate | Votes | % | ±% | |
|---|---|---|---|---|---|
| Labour | Elizabeth Harrington | 1,398 | 59.5 | -4.7 | |
| Conservative | Galina Dimelow | 440 | 18.7 | +0.9 | |
| Liberal Democrats | John Meacham | 399 | 17.0 | +3.6 | |
| Socialist Alternative | Stephen Glennon | 112 | 4.8 | +0.2 | |
| Majority | 958 | 40.8 | -5.6 | ||
| Turnout | 2,349 | 50.3 | |||
Chells[]

Location of Chells ward
| Party | Candidate | Votes | % | ±% | |
|---|---|---|---|---|---|
| Labour | Kenneth Vale | 1,307 | 51.9 | -0.7 | |
| Liberal Democrats | Leonard Lambert | 822 | 32.7 | +3.2 | |
| Conservative | Ralph Dimelow | 387 | 15.4 | -2.6 | |
| Majority | 485 | 19.2 | -3.9 | ||
| Turnout | 2,516 | 55.6 | |||
Longmeadow[]

Location of Longmeadow ward
| Party | Candidate | Votes | % | ±% | |
|---|---|---|---|---|---|
| Labour | Patricia Webb | 1,072 | 46.6 | -2.8 | |
| Conservative | Matthew Hurst | 646 | 28.1 | +3.3 | |
| Liberal Democrats | Ralph Baskerville | 582 | 25.3 | +6.6 | |
| Majority | 426 | 18.5 | -6.1 | ||
| Turnout | 2,300 | 51.8 | |||
Manor[]
Location of Manor ward
| Party | Candidate | Votes | % | ±% | |
|---|---|---|---|---|---|
| Liberal Democrats | Robin Parker | 1,859 | 66.3 | +12.3 | |
| Labour | Gordana Bjelic-Rados | 472 | 16.8 | -9.1 | |
| Conservative | Dilys Clark | 472 | 16.8 | -3.3 | |
| Majority | 1,387 | 49.5 | +21.4 | ||
| Turnout | 2,803 | 58.0 | |||
Martins Wood[]

Location of Martins Wood ward
| Party | Candidate | Votes | % | ±% | |
|---|---|---|---|---|---|
| Labour | Michael Patston | 958 | 42.8 | -7.8 | |
| Conservative | Matthew Wyatt | 664 | 29.6 | +1.8 | |
| Liberal Democrats | Barbara Segadelli | 404 | 18.0 | +3.3 | |
| Green | Ian Murrill | 214 | 9.6 | +2.6 | |
| Majority | 294 | 13.2 | -9.6 | ||
| Turnout | 2,240 | 49.0 | |||
Old Town[]

Location of Old Town ward
| Party | Candidate | Votes | % | ±% | |
|---|---|---|---|---|---|
| Labour | Michael Downing | 1,256 | 46.4 | -4.3 | |
| Conservative | Jody Hanafin | 749 | 27.7 | -1.3 | |
| Liberal Democrats | Jennifer Moorcroft | 484 | 17.9 | +4.3 | |
| Green | Bernard Chapman | 217 | 8.0 | +1.3 | |
| Majority | 507 | 18.7 | -3.0 | ||
| Turnout | 2,706 | 57.3 | |||
Pin Green[]

Location of Pin Green ward
| Party | Candidate | Votes | % | ±% | |
|---|---|---|---|---|---|
| Labour | Reginald Smith | 1,237 | 54.0 | -5.3 | |
| Conservative | Mollie Cawthorn | 564 | 24.6 | +1.0 | |
| Liberal Democrats | Mary Griffith | 488 | 21.3 | +4.2 | |
| Majority | 673 | 29.4 | -6.3 | ||
| Turnout | 2,289 | 52.2 | |||
Roebuck[]

Location of Roebuck ward
| Party | Candidate | Votes | % | ±% | |
|---|---|---|---|---|---|
| Labour | John Gardner | 1,094 | 49.7 | -4.2 | |
| Conservative | Anita Speight | 563 | 25.6 | -0.2 | |
| Liberal Democrats | Gordon Knight | 544 | 24.7 | +4.5 | |
| Majority | 431 | 24.1 | -4.0 | ||
| Turnout | 2,201 | 49.0 | |||
St Nicholas[]

Location of St Nicholas ward
| Party | Candidate | Votes | % | ±% | |
|---|---|---|---|---|---|
| Labour | John Raynor | 989 | 48.5 | -5.8 | |
| Liberal Democrats | Heather Snell | 540 | 26.5 | +3.8 | |
| Conservative | Claire Halling | 512 | 25.1 | +2.1 | |
| Majority | 449 | 22.0 | -9.3 | ||
| Turnout | 2,041 | 47.0 | |||
Shephall[]

Location of Shephall ward
| Party | Candidate | Votes | % | ±% | |
|---|---|---|---|---|---|
| Labour | Brian Hall | 1,389 | 61.2 | -2.0 | |
| Liberal Democrats | Nicholas Baskerville | 441 | 19.4 | +1.6 | |
| Conservative | Leslie Clark | 440 | 19.4 | +0.4 | |
| Majority | 948 | 41.8 | -2.4 | ||
| Turnout | 2,270 | 51.7 | |||
Symonds Green[]
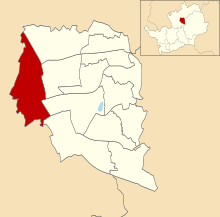
Location of Symonds Green ward
| Party | Candidate | Votes | % | ±% | |
|---|---|---|---|---|---|
| Labour | Patrick Kissane | 1,436 | 60.5 | -4.1 | |
| Conservative | Louisa Notley | 582 | 24.5 | -10.9 | |
| Liberal Democrats | Katherine Lloyd | 354 | 14.9 | +14.9 | |
| Majority | 854 | 36.0 | +6.8 | ||
| Turnout | 2,372 | 53.7 | |||
Woodfield[]

Location of Woodfield ward
| Party | Candidate | Votes | % | ±% | |
|---|---|---|---|---|---|
| Conservative | Graham Clark | 990 | 46.2 | +1.0 | |
| Labour | John Lloyd | 760 | 35.5 | -3.4 | |
| Liberal Democrats | Audrey Griffith | 391 | 18.3 | +2.4 | |
| Majority | 230 | 10.7 | +4.4 | ||
| Turnout | 2,141 | 56.3 | |||
References[]
- ^ "Luton upset for Labour". BBC Online. 2 May 2003. Retrieved 8 July 2008.
- ^ "Stage set for eastern drama". BBC Online. 7 April 2003. Retrieved 8 July 2008.
- ^ "Borough Council Elections - 1st May 2003: Election Results". Stevenage Borough Council. Retrieved 8 July 2008.
| Hertfordshire County Council |
|
|---|---|
| Broxbourne Borough Council | |
| Dacorum Borough Council | |
| East Hertfordshire District Council |
|
| Hertsmere Borough Council | |
| North Hertfordshire District Council | |
| St Albans City and District Council | |
| Stevenage Borough Council | |
| Three Rivers District Council | |
| Watford Borough Council | |
| Welwyn Hatfield Borough Council | |
| |
| Metropolitan boroughs |
|
|---|---|
| Unitary authorities |
|
| District councils (England) |
|
| Scottish councils |
|
| National Assembly elections |
|
Categories:
- Stevenage Borough Council elections
- 2003 English local elections
- 2000s in Hertfordshire