Stevenage Borough Council elections
One third of Stevenage Borough Council in Hertfordshire, England is elected each year, followed by one year when there is an election to Hertfordshire County Council instead.
Political control[]
| Party in control | Years |
|---|---|
| Labour | 1973–present |
Council elections[]
- 1973 Stevenage Borough Council election
- 1976 Stevenage Borough Council election
- 1979 Stevenage Borough Council election (New ward boundaries)[1]
- 1980 Stevenage Borough Council election
- 1982 Stevenage Borough Council election
- 1983 Stevenage Borough Council election
- 1984 Stevenage Borough Council election (Borough boundary changes took place but the number of seats remained the same)[2]
- 1986 Stevenage Borough Council election
- 1987 Stevenage Borough Council election (Borough boundary changes took place but the number of seats remained the same)[3]
- 1988 Stevenage Borough Council election
- 1990 Stevenage Borough Council election
- 1991 Stevenage Borough Council election
- 1992 Stevenage Borough Council election
- 1994 Stevenage Borough Council election
- 1995 Stevenage Borough Council election
- 1996 Stevenage Borough Council election
- 1998 Stevenage Borough Council election
- 1999 Stevenage Borough Council election (New ward boundaries)[4][5]
- 2000 Stevenage Borough Council election
- 2002 Stevenage Borough Council election
- 2003 Stevenage Borough Council election
- 2004 Stevenage Borough Council election
- 2006 Stevenage Borough Council election
- 2007 Stevenage Borough Council election
- 2008 Stevenage Borough Council election
- 2010 Stevenage Borough Council election
- 2011 Stevenage Borough Council election
- 2012 Stevenage Borough Council election
- 2014 Stevenage Borough Council election
- 2015 Stevenage Borough Council election
- 2016 Stevenage Borough Council election
- 2018 Stevenage Borough Council election
- 2019 Stevenage Borough Council election
- 2021 Stevenage Borough Council election
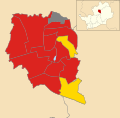
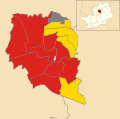
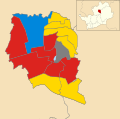
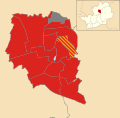
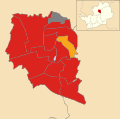
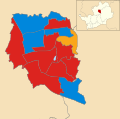
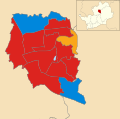
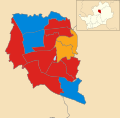
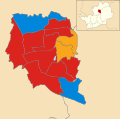
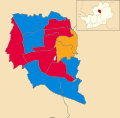
Borough result maps[]

1979 results map

1980 results map

1982 results map

1983 results map
1984 results map
1986 results map
1987 results map
1988 results map
1990 results map

1991 results map

1992 results map
1994 results map

1995 results map
1996 results map
1998 results map

1999 results map
2000 results map
2002 results map
2003 results map

2004 results map
2006 results map
2007 results map

2008 results map
2010 results map
2011 results map
2012 results map
2014 results map
2015 results map
2016 results map
2018 results map
2019 results map
2021 results map


By-election results[]
| Party | Candidate | Votes | % | ±% | |
|---|---|---|---|---|---|
| Labour | 1,519 | 59.2 | -14.8 | ||
| Conservative | 596 | 23.2 | +8.1 | ||
| Liberal Democrats | 367 | 14.3 | +3.5 | ||
| Independent | 86 | 3.3 | +3.3 | ||
| Majority | 923 | 36.0 | |||
| Turnout | 2,568 | ||||
| Labour hold | Swing | ||||
| Party | Candidate | Votes | % | ±% | |
|---|---|---|---|---|---|
| Labour | 2,260 | 53.0 | -18.8 | ||
| Conservative | 1,398 | 32.8 | +4.6 | ||
| Liberal Democrats | 603 | 14.1 | +14.1 | ||
| Majority | 862 | 20.2 | |||
| Turnout | 4,261 | ||||
| Labour hold | Swing | ||||
| Party | Candidate | Votes | % | ±% | |
|---|---|---|---|---|---|
| Labour | 520 | 49.6 | -16.6 | ||
| Liberal Democrats | 309 | 29.5 | +16.3 | ||
| Conservative | 220 | 21.0 | +0.3 | ||
| Majority | 211 | 20.1 | |||
| Turnout | 1,049 | 26.1 | |||
| Labour hold | Swing | ||||
| Party | Candidate | Votes | % | ±% | |
|---|---|---|---|---|---|
| Labour | 495 | 73.9 | +14.2 | ||
| Conservative | 106 | 15.8 | -2.2 | ||
| Liberal Democrats | 69 | 10.3 | -7.4 | ||
| Majority | 389 | 58.1 | |||
| Turnout | 670 | 13.5 | |||
| Labour hold | Swing | ||||
| Party | Candidate | Votes | % | ±% | |
|---|---|---|---|---|---|
| Labour | Sherma Batson | 600 | 52.6 | +8.1 | |
| Conservative | 292 | 25.6 | -4.0 | ||
| Liberal Democrats | Gordon Knight | 249 | 21.8 | -4.0 | |
| Majority | 308 | 27.0 | |||
| Turnout | 1,141 | 25.9 | |||
| Labour hold | Swing | ||||
| Party | Candidate | Votes | % | ±% | |
|---|---|---|---|---|---|
| Labour | Lin Martin-Haugh | 671 | 54.8 | +3.2 | |
| Conservative | Leslie Clark | 302 | 24.7 | +1.7 | |
| Liberal Democrats | Mary Griffith | 149 | 12.2 | -0.3 | |
| UKIP | Rick Seddon | 61 | 5.0 | +5.0 | |
| Green | Tom Moore | 41 | 3.3 | +3.3 | |
| Majority | 368 | 30.1 | |||
| Turnout | 1,225 | 29.0 | |||
| Labour hold | Swing | ||||
| Party | Candidate | Votes | % | ±% | |
|---|---|---|---|---|---|
| Labour | Bruce Jackson | 716 | 54.4 | +6.9 | |
| Conservative | Ralph Dimelow | 321 | 24.4 | -5.1 | |
| Liberal Democrats | Gordon Knight | 112 | 8.5 | -2.8 | |
| UKIP | Terence Tompkins | 85 | 6.5 | +6.5 | |
| Free England Party | Richard Atkins | 81 | 6.2 | -5.4 | |
| Majority | 395 | 30.0 | |||
| Turnout | 1,315 | ||||
| Labour hold | Swing | ||||
| Party | Candidate | Votes | % | ±% | |
|---|---|---|---|---|---|
| Labour | Monika Cherney-Craw | 714 | |||
| Conservative | Alexander Farquharson | 725 | |||
| TUSC | Helen Kerr | 25 | |||
| Green | Martin Malocco | 87 | |||
| Liberal Democrats | Thomas Wren | 94 | |||
| Majority | |||||
| Turnout | 1,645 | 33.19 | |||
| Conservative gain from Labour | Swing | ||||
References[]
- ^ The Borough of Stevenage (Electoral Arrangements) Order 1976
- ^ The East Hertfordshire and Stevenage (Areas) Order 1984
- ^ The Hertfordshire (District Boundaries) Order 1986
- ^ "Stevenage". BBC Online. Retrieved 2008-05-11.
- ^ legislation.gov.uk - The Borough of Stevenage (Electoral Changes) Order 1998. Retrieved on 4 October 2015.
- ^ "Pin Green Election Results - 25 September 2008". Stevenage.gov.uk. Archived from the original on 1 October 2008. Retrieved 2008-10-22.
- ^ Elvery, Martin (5 May 2017). "Herts County Council Elections 2017: Disastrous night for Labour in Stevenage as they lose three of their five seats amid big Tory gains". The Comet. Archant. Retrieved 5 May 2017.
External links[]
Categories:
- Stevenage Borough Council elections
- District council elections in England
- Politics of Stevenage
- Council elections in Hertfordshire