From Wikipedia, the free encyclopedia
2005 Piedmentese regional election|
|
|
| Turnout | 71.38% ( 0.58%) 0.58%) |
|---|
|
|
 |
|
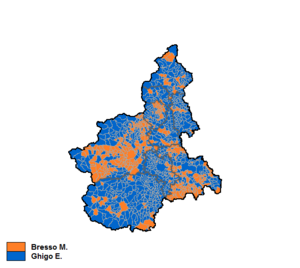
The Piedmontese regional election of 2005 took place on 3–4 April 2005.
Mercedes Bresso (Democrats of the Left) defeated incumbent Enzo Ghigo (Forza Italia).
Results[]
3–4 April 2005 Piedmontese regional election results
|
|
| Candidates
|
Votes
|
%
|
Seats
|
Parties
|
Votes
|
%
|
Seats
|
|
|
Mercedes Bresso
|
1,226,355
|
50.91
|
12
|
|
|
Democrats of the Left
|
411,237
|
20.10
|
11
|
|
|
Democracy is Freedom – The Daisy
|
211,457
|
10.34
|
6
|
|
|
Communist Refoundation Party
|
130,776
|
6.39
|
4
|
|
|
Together for Bresso
|
60,314
|
2.95
|
1
|
|
|
Federation of the Greens
|
57,516
|
2.81
|
1
|
|
|
Party of Italian Communists
|
53,359
|
2.61
|
1
|
|
|
Italian Democratic Socialists
|
49,821
|
2.44
|
1
|
|
|
Italy of Values
|
31,016
|
1.52
|
1
|
|
|
Union of Democrats for Europe
|
10,734
|
0.52
|
–
|
|
|
Pensioners for Europe
|
5,156
|
0.25
|
–
|
| Total
|
1,021,386
|
49.93
|
26
|
|
|
Enzo Ghigo
|
1,133,358
|
47.05
|
1
|
|
|
Forza Italia
|
457,397
|
22.36
|
11
|
|
|
National Alliance
|
195,318
|
9.55
|
5
|
|
|
Northern League Piedmont
|
173,020
|
8.46
|
4
|
|
|
Union of Christian and Centre Democrats
|
93,872
|
4.59
|
2
|
|
|
Greens Greens
|
23,761
|
1.16
|
1
|
|
|
Consumers' List
|
23.378
|
1.14
|
1
|
|
|
Socialists and Liberals
|
16.944
|
0.83
|
–
|
|
|
Pensioners' Party
|
11,883
|
0.58
|
–
|
| Total
|
995,573
|
48.67
|
24
|
|
|
Gianfranco Rotondi
|
24,813
|
1.03
|
–
|
|
Democratic Ecologists – Christian Democracy
|
14,255
|
0.70
|
–
|
|
|
Lodovico Ellena
|
24,454
|
1.02
|
–
|
|
Social Alternative
|
14,515
|
0.71
|
–
|
|
|
| Total candidates
|
2,408,980
|
100.00
|
13
|
Total parties
|
2,045,729
|
100.00
|
50
|
| Source: Ministry of the Interior – Historical Archive of Elections
|
|
|---|
| Regional elections | |
|---|
| General elections | |
|---|
| European Parliament elections | |
|---|

Categories:
- Elections in Piedmont
- 2005 elections in Italy


