2016 Derby City Council election
| |||||||||||||||||||||||||||||||||||||||||||||||||||||
17 of the 51 seats to Derby City Council 26 seats needed for a majority | |||||||||||||||||||||||||||||||||||||||||||||||||||||
|---|---|---|---|---|---|---|---|---|---|---|---|---|---|---|---|---|---|---|---|---|---|---|---|---|---|---|---|---|---|---|---|---|---|---|---|---|---|---|---|---|---|---|---|---|---|---|---|---|---|---|---|---|---|
| |||||||||||||||||||||||||||||||||||||||||||||||||||||
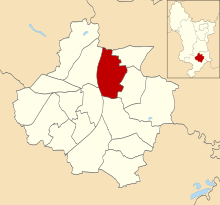
 Map showing the results of contested wards in the 2016 Derby City Council elections. | |||||||||||||||||||||||||||||||||||||||||||||||||||||
| |||||||||||||||||||||||||||||||||||||||||||||||||||||
The 2016 Derby City Council election took place on 5 May 2016 to elect members of Derby City Council in England.[3] This was on the same day as other local elections. The Labour Party retained control of the council, albeit with their majority reduced to just one seat.
Overall results[]
| Party | Seats | Gains | Losses | Net gain/loss | Seats % | Votes % | Votes | +/− | |
|---|---|---|---|---|---|---|---|---|---|
| Conservative | 7 | 3 | 0 | 41.2 | 34.2 | 19,881 | |||
| Labour | 7 | 0 | 3 | 41.2 | 31.6 | 18,410 | |||
| Liberal Democrats | 2 | 0 | 1 | 11.8 | 15.0 | 8,738 | |||
| UKIP | 1 | 1 | 0 | 5.9 | 15.6 | 9,107 | |||
| Green | 0 | 0 | 0 | 0.0 | 1.9 | 1,086 | |||
| Independent | 0 | 0 | 0 | 0.0 | 0.8 | 443 | |||
| TUSC | 0 | 0 | 0 | 0.0 | 0.8 | 441 | |||
| 0 | 0 | 0 | 0.0 | 0.1 | 83 | ||||
| Link Party | 0 | 0 | 0 | 0.0 | 0.1 | 45 | |||
All comparisons in vote share are to the corresponding 2012 election.
At the previous election the composition of the council was:
| 29 | 14 | 6 | 2 |
| Labour | Conservative | LD | UKIP |
After the election the composition of the council was:
| 26 | 17 | 5 | 3 |
| Labour | Conservative | LD | UKIP |
Ward results[]
Abbey[]

Location of Abbey ward
| Party | Candidate | Votes | % | |
|---|---|---|---|---|
| Labour | Sarah Elizabeth Russell | 1,152 | 41.3% | |
| Liberal Democrats | Ajit Singh Atwal | 764 | 27.4% | |
| Conservative | Jordan Kemp | 409 | 14.6% | |
| UKIP | Barry Appleby | 296 | 10.6% | |
| Green | George Hind | 138 | 4.9% | |
| TUSC | Jonathan Sykes | 33 | 1.2% | |
| Majority | 388 | 13.9% | ||
| Turnout | 2,792 | 29.3% | ||
| Labour hold | ||||
Allestree[]

Location of Allestree ward
| Party | Candidate | Votes | % | |
|---|---|---|---|---|
| Conservative | Richard Jason Smalley | 2,820 | 60.7% | |
| Labour | Oleg Sotnicenko | 785 | 16.9% | |
| Liberal Democrats | Deena Smith | 534 | 11.5% | |
| UKIP | Frank Leeming | 508 | 10.9% | |
| Majority | 2,035 | 41.8% | ||
| Turnout | 4,647 | 42.1% | ||
| Conservative hold | ||||
Alvaston[]

Location of Alvaston ward
| Party | Candidate | Votes | % | |
|---|---|---|---|---|
| UKIP | John Evans | 1,562 | 46.3% | |
| Labour | Mark Stuart Tittley | 1,120 | 33.2% | |
| Conservative | Christopher Philip King | 429 | 12.7% | |
| Liberal Democrats | Robert John Mason | 179 | 5.3% | |
| British Independents | David Andrew Gale | 45 | 1.3% | |
| TUSC | Jo Warren | 42 | 1.2% | |
| Majority | 442 | 13.1% | ||
| Turnout | 3,377 | 29.7% | ||
| UKIP gain from Labour | ||||
Arboretum[]

Location of Arboretum ward
| Party | Candidate | Votes | % | |
|---|---|---|---|---|
| Labour | Gulfraz Nawaz | 1,707 | 48.0% | |
| Conservative | Matlub Hussain | 1,280 | 36.0% | |
| UKIP | Jhanzab Arif | 190 | 5.3% | |
| Liberal Democrats | David Robert Batey | 171 | 4.8% | |
| Green | Ian Christopher Sleeman | 132 | 3.7% | |
| TUSC | Lesley Butler | 77 | 2.2% | |
| Majority | 427 | 12.0% | ||
| Turnout | 3,557 | 33.7% | ||
| Labour hold | ||||
Blagreaves[]

Location of Blagreaves ward
| Party | Candidate | Votes | % | |
|---|---|---|---|---|
| Liberal Democrats | Joe Naitta | 1,818 | 47.2% | |
| Labour | Cecile Yvonne Wright | 1,198 | 31.1% | |
| UKIP | Vincent Davis | 417 | 10.8% | |
| Conservative | David Rodney Jennings | 416 | 10.8% | |
| Majority | 620 | 16.1% | ||
| Turnout | 3,849 | 39.4% | ||
| Liberal Democrats hold | ||||
Boulton[]

Location of Boulton ward
| Party | Candidate | Votes | % | |
|---|---|---|---|---|
| Labour | Dom Anderson | 981 | 33.1% | |
| UKIP | Gaurav Pandey | 971 | 32.8% | |
| Conservative | Steve Willoughby | 681 | 23.0% | |
| Green | Leon Adam Nixon | 148 | 5.0% | |
| Liberal Democrats | Greg Webb | 137 | 4.6% | |
| TUSC | Shaun Christopher Stuart | 43 | 1.5% | |
| Majority | 10 | 0.3% | ||
| Turnout | 2,961 | 29.8% | ||
| Labour hold | ||||
Chaddesden[]

Location of Chaddesten ward
| Party | Candidate | Votes | % | |
|---|---|---|---|---|
| Conservative | Jonathan Charles Smale | 1,160 | 36.2% | |
| Labour | Sue Cowlishaw | 1,070 | 33.4% | |
| UKIP | Anthony Joseph Crawley | 735 | 22.9% | |
| Independent | Paul Hilliard | 127 | 4.0% | |
| Liberal Democrats | Tim Hallam | 114 | 3.6% | |
| Majority | 90 | 2.8% | ||
| Turnout | 3,206 | 32.3% | ||
| Conservative gain from Labour | ||||
Chellaston[]

Location of Chellaston ward
| Party | Candidate | Votes | % | |
|---|---|---|---|---|
| Conservative | Sean William Marshall | 1,603 | 44.5% | |
| Labour | James Matthew West | 1,016 | 28.2% | |
| UKIP | Ian Edward Crompton | 552 | 15.3% | |
| Liberal Democrats | Jane Elizabeth Katharine Webb | 429 | 11.9% | |
| Majority | 587 | 16.3% | ||
| Turnout | 3,600 | 31.7% | ||
| Conservative hold | ||||
Darley[]

Location of Darley ward
| Party | Candidate | Votes | % | |
|---|---|---|---|---|
| Labour | Jack Stanton | 1,459 | 40.8% | |
| Conservative | Ged Potter | 1,135 | 31.8% | |
| Green | Marten Kats | 377 | 17.8% | |
| UKIP | Andrew Leslie Bennett | 337 | 9.4% | |
| Liberal Democrats | Stephen Francis Connolly | 219 | 6.1% | |
| TUSC | Chris Fernandez | 45 | 1.3% | |
| Majority | 324 | 9.0% | ||
| Turnout | 3,572 | 35.1% | ||
| Labour hold | ||||
Derwent[]
Location of Derwent ward
| Party | Candidate | Votes | % | |
|---|---|---|---|---|
| Conservative | Richard Hudson | 814 | 33.4% | |
| Labour | Margaret Eileen Redfern | 811 | 33.2% | |
| UKIP | Martin Fitzpatrick | 660 | 27.0% | |
| Liberal Democrats | Simon Ferrigno | 155 | 6.4% | |
| Majority | 3 | 0.2% | ||
| Turnout | 2,440 | 25.3% | ||
| Conservative hold | ||||
Littleover[]

Location of Littleover ward
| Party | Candidate | Votes | % | |
|---|---|---|---|---|
| Liberal Democrats | Eric Ashburner | 2,094 | 51.4% | |
| Labour | Cheryl Jacqueline Pidgeon | 994 | 24.4% | |
| Conservative | Peter Stanley Berry | 662 | 16.2% | |
| UKIP | Arron Mathew Marsden | 244 | 6.0% | |
| Link Party | Tony Welch | 83 | 2.0% | |
| Majority | 1,100 | 27.0% | ||
| Turnout | 4,077 | 38.4% | ||
| Liberal Democrats hold | ||||
Mackworth[]

Location of Mackworth ward
| Party | Candidate | Votes | % | |
|---|---|---|---|---|
| Labour | Paul James Pegg | 975 | 36.0% | |
| UKIP | Rob Cooper | 816 | 30.1% | |
| Conservative | Adrian Michael Pegg | 623 | 23.0% | |
| Liberal Democrats | Ian Colin Deuchar Care | 130 | 4.8% | |
| Green | Kyle Mark Bolderson | 123 | 4.5% | |
| TUSC | Stevie Rosso | 44 | 1.6% | |
| Majority | 159 | 5.9% | ||
| Turnout | 2,711 | 28.8% | ||
| Labour hold | ||||
Mickleover[]

Location of Mickleover ward
| Party | Candidate | Votes | % | |
|---|---|---|---|---|
| Conservative | Matthew Edward Holmes | 2,549 | 51.1% | |
| Liberal Democrats | Maggie Hird | 1,525 | 30.6% | |
| Labour | Craig Lee Thomson | 560 | 11.2% | |
| UKIP | Kirk Lewis Kus | 353 | 7.1% | |
| Majority | 1,024 | 20.5% | ||
| Turnout | 4,987 | 43.3% | ||
| Conservative gain from Liberal Democrats | ||||
Normanton[]

Location of Normanton ward
| Party | Candidate | Votes | % | |
|---|---|---|---|---|
| Labour | Hardyal Singh Dhindsa | 1,869 | 53.2% | |
| Conservative | Habib Iqbal | 1,052 | 29.9% | |
| UKIP | Shaikh Mushtaq Ahmed | 276 | 7.9% | |
| Liberal Democrats | Preetinder Kaur Butter | 115 | 3.3% | |
| Green | Fred Gough | 107 | 3.0% | |
| TUSC | Terence Mortimer Anderson | 96 | 2.7% | |
| Majority | 817 | 23.3% | ||
| Turnout | 3,515 | 35.4% | ||
| Labour hold | ||||
Oakwood[]

Location of Oakwood ward
| Party | Candidate | Votes | % | |
|---|---|---|---|---|
| Conservative | Frank Harwood | 1,820 | 58.3% | |
| Labour | Neil Wilson | 549 | 17.6% | |
| UKIP | Joanna Rachel Beck | 342 | 11.0% | |
| Independent | Alex Dann | 316 | 10.1% | |
| Liberal Democrats | Roger Anthony Jackson | 93 | 3.0% | |
| Majority | 1,271 | 40.7% | ||
| Turnout | 3,120 | 31.1% | ||
| Conservative hold | ||||
Sinfin[]

Location of Sinfin ward
| Party | Candidate | Votes | % | |
|---|---|---|---|---|
| Labour | Baggy Shanker | 1,377 | 56.7% | |
| Conservative | Adam Mark Hurt | 401 | 16.5% | |
| UKIP | Jayprakash Joshi | 384 | 15.8% | |
| Liberal Democrats | Paul John Lind | 144 | 5.9% | |
| Green | Kayleigh Beth Skipper | 61 | 2.5% | |
| TUSC | Zbigniew Wojcik | 61 | 2.5% | |
| Majority | 976 | 40.2% | ||
| Turnout | 2,428 | 24.5% | ||
| Labour hold | ||||
Spondon[]

Location of Spondon ward
| Party | Candidate | Votes | % | |
|---|---|---|---|---|
| Conservative | Evonne Williams | 2,027 | 59.7% | |
| Labour | Michael Steven Winfield | 787 | 23.2% | |
| UKIP | Vaughan Saxby | 464 | 13.7% | |
| Liberal Democrats | John-Paul Keane | 117 | 3.4% | |
| Majority | 1,240 | 36.5% | ||
| Turnout | 3,395 | 34.0% | ||
| Conservative hold | ||||
References[]
- ^ "Derby election: Labour hold control of city council". BBC News. 6 May 2016.
- ^ "Local Election 2016". Derby City Council.
- ^ "Guide to May 2016 elections in Scotland, Wales, England and Northern Ireland". BBC News. Retrieved 21 April 2016.
| Derbyshire County Council | |
|---|---|
| Amber Valley Borough Council | |
| Bolsover District Council | |
| Chesterfield Borough Council | |
| Derby City Council | |
| Derbyshire Dales District Council | |
| Erewash Borough Council | |
| High Peak Borough Council | |
| North East Derbyshire District Council | |
| South Derbyshire District Council | |
| |
This Elections in England related article is a stub. You can help Wikipedia by . |
Categories:
- 2016 English local elections
- Derby City Council elections
- 2010s in Derby
- England election stubs