Agriculture in the United States

| This article is part of a series on the |
| Economy of the United States |
|---|
 |
|
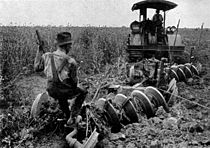
shows a tractor plowing a crop field
Agriculture is a major industry in the United States, which is a net exporter of food.[1] As of the 2007 census of agriculture, there were 2.2 million farms, covering an area of 922 million acres (1,441,000 sq mi), an average of 418 acres (169 hectares) per farm.[2]
Although agricultural activity occurs in every state in the union, it is particularly concentrated in the Great Plains, a vast expanse of flat, arable land in the center of the nation in the region west of the Great Lakes and east of the Rocky Mountains. The eastern, wetter half is a major corn and soybean producing region known as the Corn Belt, while the western, drier half is known as the Wheat Belt for its high rate of wheat production.[3] The Central Valley of California produces fruits, vegetables, and nuts. The American South has historically been a large producer of cotton, tobacco, and rice, but it has declined in agricultural production over the past century.
The U.S. has led developments in seed improvement, such as hybridization, and in expanding uses for crops from the work of George Washington Carver to bioplastics and biofuels. The mechanization of farming and intensive farming have been major themes in U.S. history, including John Deere's steel plow, Cyrus McCormick's mechanical reaper, Eli Whitney's cotton gin, and the widespread success of the Fordson tractor and the combine harvester. Modern agriculture in the U.S. ranges from hobby farms and small-scale producers to large commercial farms covering thousands of acres of cropland or rangeland.
History[]
Corn, turkeys, tomatoes, potatoes, peanuts, and sunflower seeds constitute some of the major holdovers from the agricultural endowment of the Americas.
Colonists had more access to land in the colonial United States than they did in Europe. The organization of labor was complex including free persons, slaves and indentured servants depending on the regions where either slaves or poor landless laborers were available to work on family farms.[4]
European agricultural practices greatly affected the New England landscape. Colonists brought livestock over from Europe which caused many changes to the land. Grazing animals required a lot of land and food and the act of grazing itself destroyed native grasses, which were being replaced by European species. New species of weeds were introduced and began to thrive as they were capable of withstanding the grazing of animals, whereas native species could not.[5]
The practices associated with keeping livestock also contributed to the deterioration of the forests and fields. Colonists would cut down the trees and then allow their cattle and livestock to graze freely in the forest and never plant more trees. The animals trampled and tore up the ground so much as to cause long-term destruction and damage.[5]
Soil exhaustion was a huge problem in New England agriculture. Farming with oxen did allow the colonist to farm more land but it increased erosion and decreased soil fertility. This was due to deeper plow cuts in the soil that allowed the soil more contact with oxygen causing nutrient depletion. In grazing fields in New England, the soil was being compacted by the large number of cattle and this did not give the soil enough oxygen to sustain life.[5]
In the United States, farms spread from the colonies westward along with the settlers. In cooler regions, wheat was often the crop of choice when lands were newly settled, leading to a "wheat frontier" that moved westward over the course of years. Also very common in the antebellum Midwest was farming corn while raising hogs, complementing each other especially since it was difficult to get grain to market before the canals and railroads. After the "wheat frontier" had passed through an area, more diversified farms including dairy cattle generally took its place. Warmer regions saw plantings of cotton and herds of beef cattle. In the early colonial south, raising tobacco and cotton was common, especially through the use of slave labor until the Civil War. In the northeast, slaves were used in agriculture until the early 19th century.[citation needed] In the Midwest, slavery was prohibited by the Freedom Ordinance of 1787.
The introduction and broad adoption of scientific agriculture since the mid-19th century contributed to economic growth in the United States. This development was facilitated by the Morrill Act and the Hatch Act of 1887 which established in each state a land-grant university (with a mission to teach and study agriculture) and a federally funded system of agricultural experiment stations and cooperative extension networks which place extension agents in each state.
Soybeans were not widely cultivated in the United States until the early 1930s, and by 1942 it became the world's largest soybean producer, due in part to World War II and the "need for domestic sources of fats, oils, and meal". Between 1930 and 1942, the United States' share of world soybean production grew from 3% to 47%, and by 1969 it had risen to 76%. By 1973 soybeans were the United States' "number one cash crop, and leading export commodity, ahead of both wheat and corn".[6]
Significant areas of farmland were abandoned during the Great Depression and incorporated into nascent national forests. Later, "Sodbuster" and "Swampbuster" restrictions written into federal farm programs starting in the 1970s reversed a decades-long trend of habitat destruction that began in 1942 when farmers were encouraged to plant all possible land in support of the war effort. In the United States, federal programs administered through local Soil and Water Conservation Districts provide technical assistance and partial funding to farmers who wish to implement management practices to conserve soil and limit erosion and floods.
Scholarship has shown that farmers in the early United States were open to planting new crops, raising new animals and adopting new innovations as increased agricultural productivity in turn increased the demand for shipping services, containers, credit, storage, and the like.[7]
Although four million farms disappeared in the United States between 1948 and 2015, total output from the farms that remained more than doubled. The number of farms with more than 2,000 acres (810 ha) almost doubled between 1987 and 2012, while the number of farms with 200 acres (81 ha) to 999 acres (404 ha) fell over the same period by 44%.[8]
Farm productivity increased in the United States from the mid-20th century until the late-20th century when productivity began to stall.[9]
United States agriculture production in 2018[]
In 2018:
- It was by far the largest world producer of maize (392 million tons). The country has been the world leader in maize production for decades and only recently China, with 257.3 million tonnes produced this year, has been approaching North American production;
- It was the largest world producer of soy (123.6 million tons), a position that they held for many years, but recently, they have been competing with Brazil for world leadership. Brazil surpassed US soybean production in 2020.;[10]
- It was the 4th largest world producer of wheat (51.2 million tons), behind China, India and Russia;
- It was the 3rd largest world producer of sugar beet (30 million tons), behind Russia and France (the beet is used to manufacture sugar and ethanol) ;
- It was the 10th largest world producer of sugar cane (31.3 million tons) - Cane is also used to manufacture sugar and ethanol;
- It was the 5th largest world producer of potato (20.6 million tons), behind China, India, Russia and Ukraine;
- It was the 3rd largest world producer of tomatoes (12.6 million tons), behind China and India;
- It was the 3rd largest world producer of cotton (11.4 million tons), behind China and India;
- It was the 12th largest world producer of rice (10.1 million tons);
- It was the largest world producer of sorghum (9.2 million tons);
- It was the 3rd largest world producer of grape (6.8 million tons), behind China and Italy;
- It was the 4th largest world producer of orange (4.8 million tons), behind Brazil, China and India;
- It was the 2nd largest world producer of apple (4.6 million tons), second only to China;
- It was the 3rd largest world producer of onion (3.2 million tons), behind China and India;
- It was the 3rd largest world producer of peanut (2.4 million tons), behind China and India;
- It was the largest world producer of almonds (1.8 million tons);
- It was the 2nd largest world producer of strawberry (1.3 million tons), second only to China;
- It was the 10th largest world producer of oats (814 thousand tons);
- It was the 8th largest world producer of lemon (812 thousand tons);
- It was the 3rd largest world producer of pear (730 thousand tons), behind China and Italy;
- It was the 3rd largest world producer of green pea (722 thousand tons), behind China and India;
- It was the 6th largest world producer of peaches (700 thousand tons);
- It was the 2nd largest world producer of walnut (613 thousand tons), second only to China;
- It was the 2nd largest world producer of pistachio (447 thousand tons), second only to Iran;
- It was the 3rd largest world producer of lentils (381 thousand tons), behind Canada and India;
- It was the 2nd largest world producer of spinach (384 thousand tons), second only to China;
- It was the 4th largest world producer of plum (368 thousand tons), behind China, Romania and Serbia;
- It was the 4th largest world producer of tobacco (241 thousand tons), behind China, Brazil and India;
- It produced 3.6 million tons of lettuce and chicory;
- It produced 3.3 million tons of barley;
- It produced 1.7 million tons of beans;
- It produced 1.7 million tons of watermelon;
- It produced 1.6 million tons of rapeseed;
- It produced 1.5 million tons of carrot;
- It produced 1.2 million tons of cauliflower and broccoli;
- It produced 960 thousand tons of sunflower seed;
- It produced 804 thousand tons of tangerine;
In addition to smaller productions of other agricultural products, such as melon (872 thousand tons), pumpkin (683 thousand tons), grapefruit (558 thousand tons), cranberry (404 thousand tons), cherry (312 thousand tons), blueberry (255 thousand tons), rye (214 thousand tons), olive (138 thousand tons), etc.[11]
Major agricultural products[]

Tonnes of United States agriculture production, as reported by the Food and Agriculture Organization (FAO) of the U.N. in 2003 and 2013 (ranked roughly in order of value):[12]
| Millions of Tonnes in | 2003 | 2013 |
|---|---|---|
| Corn | 256.0 | 354.0 |
| Cattle meat | 12.0 | 11.7 |
| Cow's milk, whole, fresh | 77.0 | 91.0 |
| Chicken meat | 14.7 | 17.4 |
| Soybeans | 67.0 | 89.0 |
| Pig meat | 9.1 | 10.5 |
| Wheat | 64.0 | 58.0 |
| Cotton lint | 4.0 | 2.8 |
| Hen eggs | 5.2 | 5.6 |
| Turkey meat | 2.5 | 2.6 |
| Tomatoes | 11.4 | 12.6 |
| Potatoes | 20.8 | 19.8 |
| Grapes | 5.9 | 7.7 |
| Oranges | 10.4 | 7.6 |
| Rice, paddy | 9.1 | 8.6 |
| Apples | 3.9 | 4.1 |
| Sorghum | 10.4 | 9.9 |
| Lettuce | 4.7 | 3.6 |
| Cottonseed | 6.0 | 5.6 |
| Sugar beets | 30.7 | 29.8 |
Other crops appearing in the top 20 at some point in the last 40 years were: tobacco, barley, and oats, and, rarely: peanuts, almonds, and sunflower seeds. Alfalfa and hay would both be in the top ten in 2003 if they were tracked by FAO.
Crops[]
Value of production[]

| Major Crops in the U.S. | 1997 (in US$ billions) |
2014 (in US$ billions) |
|---|---|---|
| Corn | $24.4 | $52.3 |
| Soybeans | $17.7 | $40.3 |
| Wheat | $8.6 | $11.9 |
| Alfalfa | $8.3 | $10.8 |
| Cotton | $6.1 | $5.1 |
| Hay, (non-Alfalfa) | $5.1 | $8.4 |
| Tobacco | $3.0 | $1.8 |
| Rice | $1.7 | $3.1 |
| Sorghum | $1.4 | $1.7 |
| Barley | $0.9 | $0.9 |
| Source | 1997 USDA – NASS reports,[13] | 2015 USDA-NASS reports,[14] |
Note alfalfa and hay are not tracked by the FAO and the production of tobacco in the United States has fallen 60% between 1997 and 2003.
Yield[]
Heavily mechanized, U.S. agriculture has a high yield relative to other countries. As of 2004:[15]
- Corn for grain, average of 160.4 bushels harvested per acre (10.07 t/ha)
- Soybean for beans, average of 42.5 bushels harvested per acre (2.86 t/ha)
- Wheat, average of 43.2 bushels harvested per acre (2.91 t/ha, was 44.2 bu/ac or 2.97 t/ha in 2003)
Livestock[]

The major livestock industries in the United States:
- Dairy cattle
- Beef cattle
- Pig
- Poultry
- Seafood
- Sheep
| Type | 1997 | 2002 | 2007 | 2012 |
|---|---|---|---|---|
| Cattle and calves | 99,907,017 | 95,497,994 | 96,347,858 | 89,994,614 |
| Hogs and pigs | 61,188,149 | 60,405,103 | 67,786,318 | 66,026,785 |
| Sheep and lambs | 8,083,457 | 6,341,799 | 5,819,162 | 5,364,844 |
| Broilers & other meat chickens |
1,214,446,356 | 1,389,279,047 | 1,602,574,592 | 1,506,276,846 |
| Laying hens | 314,144,304 | 334,435,155 | 349,772,558 | 350,715,978 |
Goats, horses, turkeys and bees are also raised, though in lesser quantities. Inventory data is not as readily available as for the major industries. For the three major goat-producing states—Arizona, New Mexico, and Texas—there were 1.2 million goats at the end of 2002. There were 5.3 million horses in the United States at the end of 1998. There were 2.5 million colonies of bees at the end of 2005.
Farm type or majority enterprise type[]
Farm type is based on which commodities are the majority crops grown on a farm. Nine common types include:[19][20][21]
- Cash grains includes corn, soybeans and other grains (wheat, oats, barley, sorghum), dry edible beans, peas, and rice.
- Tobacco
- Cotton
- Other field crops includes peanuts, potatoes, sunflowers, sweet potatoes, sugarcane, broomcorn, popcorn, sugar beets, mint, hops, seed crops, hay, silage, forage, etc. Tobacco and cotton can be included here if not in their own separate category.
- High-value crops includes fruits, vegetables, melons, tree nuts, greenhouse, nursery crops, and horticultural specialties.
- Cattle
- Hogs
- Dairy
- Poultry and eggs
One characteristic of the agricultural industry that sets it apart from others is the number of individuals who are self-employed. Frequently, farmers and ranchers are both the principal operator, the individual responsible for successful management and day-to-day decisions, and the primary laborer for his or her operation. For agricultural workers that sustain an injury, the resultant loss of work has implications on physical health and financial stability.[22]
Governance[]

Agriculture in the United States is primarily governed by periodically renewed U.S. farm bills. Governance is both a federal and a local responsibility with the United States Department of Agriculture being the federal department responsible. Government aid includes research into crop types and regional suitability as well as many kinds of subsidies, some price supports and loan programs. U.S. farmers are not subject to production quotas and some laws are different for farms compared to other workplaces.
Labor laws prohibiting children in other workplaces provide some exemptions for children working on farms with complete exemptions for children working on their family's farm. Children can also gain permits from vocational training schools or the 4-H club which allow them to do jobs they would otherwise not be permitted to do.
A large part of the U.S. farm workforce is made up of migrant and seasonal workers, many of them recent immigrants from Latin America. Additional laws apply to these workers and their housing which is often provided by the farmer.
Employment[]
In 1870, almost 50 percent of the U.S. population was employed in agriculture.[23] As of 2008, less than 2 percent of the population is directly employed in agriculture.[24][25]
In 2012, there were 3.2 million farmers,[26] ranchers and other agricultural managers and an estimated 757,900 agricultural workers were legally employed in the US. Animal breeders accounted for 11,500 of those workers with the rest categorized as miscellaneous agricultural workers. The median pay was $9.12 per hour or $18,970 per year.[27] In 2009, about 519,000 people under age 20 worked on farms owned by their family. In addition to the youth who lived on family farms, an additional 230,000 youth were employed in agriculture.[28] In 2004, women made up approximately 24% of farmers; that year, there were 580,000 women employed in agriculture, forestry, and fishing.[29]
From 1999–2009, roughly 50% of hired crop farmworkers in the U.S. were noncitizens working without legal authorization.[30] Some large farms rely on new immigrants who will work for extremely low wages. The legal status of the worker has been shown to impact the wage received for a job. An agricultural worker with no documentation earns an average of 15% less than one with amnesty or green card.[31] Moreover, it has been found that undocumented workers have decreased mobility in the agricultural industry because they are less able to have high-skill and high-earning jobs (jobs that are similar to their documented counterparts).[32] These first generation immigrants may remain as farm laborers seasonally for ten years. As they age, they grow poorer due to less skills, resources, and education.[33] The United States passed a special provision in 1986 called the Immigration Reform and Control Act under which the Special Agricultural Worker (SAW) program granted amnesty to some agricultural laborers because of the importance of these workers to the industry. Though this slightly improved the lives of some workers, many more live in poverty and without benefits today. For example, though these workers face many occupational hazards, they are not insured nor protected by government provisions such as the Affordable Care Act. Instead, SAWs rely on Community and Migrant Health Centers that are built to serve this population (though these also suffer from lack of funding and healthcare workers).[34]
Occupational safety and health[]
Agriculture ranks among the most hazardous industries due to the use of chemicals and risk of injury.[35][36] Farmers are at high risk for fatal and nonfatal injuries (general traumatic injury and musculoskeletal injury), work-related lung diseases, noise-induced hearing loss, skin diseases, chemical-related illnesses, and certain cancers associated with chemical use and prolonged sun exposure.[36][37][38] In an average year, 516 workers die doing farm work in the U.S. (1992–2005). Every day, about 243 agricultural workers suffer lost-work-time injuries, and about 5% of these result in permanent impairment.[39] Tractor overturns are the leading cause of agriculture-related fatal injuries, and account for over 90 deaths every year. The National Institute for Occupational Safety and Health recommends the use of roll over protection structures on tractors to reduce the risk of overturn-related fatal injuries.[39]
Farming is one of the few industries in which families (who often share the work and live on the premises) are also at risk for injuries, illness, and death. Agriculture is the most dangerous industry for young workers, accounting for 42% of all work-related fatalities of young workers in the U.S. between 1992 and 2000. In 2011, 108 youth, less than 20 years of age, died from farm-related injuries.[28] Unlike other industries, half the young victims in agriculture were under age 15.[40] For young agricultural workers aged 15–17, the risk of fatal injury is four times the risk for young workers in other workplaces[41] Agricultural work exposes young workers to safety hazards such as machinery, confined spaces, work at elevations, and work around livestock. The most common causes of fatal farm-related youth injuries involve machinery, motor vehicles, or drowning. Together these three causes comprise more than half of all fatal injuries to youth on U.S. farms.[42] Women in agriculture (including the related industries of forestry and fishing) numbered 556,000 in 2011.[36]
Agriculture in the U.S. makes up approximately 75% of the country's pesticide use. Agricultural workers are at high risk for being exposed to dangerous levels of pesticides, whether or not they are directly working with the chemicals.[38] Migrant workers, especially women, are at higher risk for health issues associated with pesticide exposure due to lack of training or appropriate safety precautions.[43][44] United States agricultural workers experience 10,000 cases or more of physician-diagnosed pesticide poisoning annually.[45]
Research centers[]
Some U.S. research centers are focused on the topic of health and safety in agricultural practices. These centers not only conduct research on the subject of occupational disease and injury prevention, but also promote agricultural health and safety through educational outreach programs. Most of these groups are funded by the National Institute for Occupational Safety and Health, the US Department of Agriculture, or other state agencies.[46] Centers include:
- Central States Center for Agricultural Safety and Health, University of Nebraska Medical Center, Omaha, NE [47]
- Great Plains Center for Agricultural Health, University of Iowa, Iowa City, IA[48]
- High Plains Intermountain Center for Agricultural Health and Safety, Colorado State University, Fort Collins, CO[49]
- National Children's Center for Rural and Agricultural Health and Safety, Marshfield, WI[50]
- Northeast Center for Agricultural and Occupational Health, , Cooperstown, NY[51]
- Pacific Northwest Agricultural Safety and Health Center, University of Washington, Seattle, WA[52]
- Southeast Center for Agricultural Health and Injury Prevention, University of Kentucky, Lexington, KY[53]
- Southwest Center for Agricultural Health, Injury Prevention and Education, University of Texas, Tyler, TX[54]
- Upper Midwest Agricultural Safety and Health Center, a collaboration between the University of Minnesota School of Public Health, Minneapolis, MN, University of Minnesota College of Veterinary Medicine, St. Paul, MN, Minnesota Department of Health, St. Paul, MN and the National Farm Medicine Center, Marshfield, WI with Migrant Clinicians Network, Salisbury, MD[55]
- Western Center for Agricultural Health and Safety, University of California, Davis, CA[56]
Demographics[]
The number of women working in agriculture has risen and the 2002 census of agriculture recorded a 40% increase in the number of female farm workers.[57] Inequality and respect are common issues for these workers, as many have reported that they are not being respected, listened to, or taken seriously due to traditional views of women as housewives and caretakers.[58]
Women may also face resistance when attempting to advance to higher positions. Other issues reported by female farm workers include receiving less pay than their male counterparts and a refusal or reluctance by their employers to offer their female workers the same additional benefits given to male workers such as housing.[59]
As of 2012, there were 44,629 African-American farmers in the United States. The vast majority of African-American farmers were in southern states.[60]
Industry[]
Historically, farmland has been owned by small property owners, but as of 2017 institutional investors, including foreign corporations, had been purchasing farmland.[61] In 2013 the largest producer of pork, Smithfield Foods, was bought by a company from China.[61]
As of 2017, only about 4% of farms have sales over $1m, but these farms yield two-thirds of total output.[62] Some of these are large farms have grown organically from private family-owned businesses.[62]
Land ownership laws[]
As of 2019, six states—Hawaii, Iowa, Minnesota, Mississippi, North Dakota, and Oklahoma—have laws banning foreign ownership of farmland. Missouri, Ohio, and Oklahoma are looking to introduce bills banning foreign ownership as of 2019.[63][64]
The state with the most foreign ownership as of 2019 is Maine, which has 3.1 million acres that are foreign-controlled, followed closely by Texas at 3 million acres. Alabama, at 1.6 million acres, Washington, at 1.5 million acres, and Michigan, at 1.3 million acres, round out the top five, according to the Midwest Center’s analysis.[63]
See also[]
- Agribusiness
- Beekeeping in the United States
- Child nutrition programs
- Electrical energy efficiency on United States farms
- Fishing industry in the United States
- Genetic engineering in the United States
- History of agriculture in the United States
- Pesticides in the United States
- Poultry farming in the United States
- Soil in the United States
- Farmers' suicides in the United States
- List of largest producing countries of agricultural commodities
References[]
Citations[]
- ^ "Latest U.S. Agricultural Trade Data." USDA Economic Research Service. Ed. Stephen MacDonald. USDA, 6 Sept. 2018.
- ^ "US Census of Agriculture, 2007". Agcensus.usda.gov. 2009-02-04. Retrieved 2014-04-01.
- ^ Hatfield, J., 2012: Agriculture in the Midwest. In: U.S. National Climate Assessment Midwest Technical Input Report Archived 2013-06-21 at the Wayback Machine. J. Winkler, J. Andresen, J. Hatfield, D. Bidwell, and D. Brown, coordinators. Available from the Great Lakes Integrated Sciences and Assessments (GLISA) Center
- ^ Cathy D. Matson, The Economy of Early America, p. 28
- ^ Jump up to: a b c Cronon, William. Changes in the Land : Indians, Colonists, and the Ecology of New England. New York: Hill & Wang, 2003.
- ^ Shurtleff, William; Aoyagi, Akiko (2004). History of World Soybean Production and Trade – Part 1. Soyfoods Center, Lafayette, California: Unpublished Manuscript, History of Soybeans and Soyfoods, 1100 B.C. to the 1980s.
- ^ Cathy D. Matson, The Economy of Early America, p. 27
- ^ "'They're Trying to Wipe Us Off the Map.' Small American Farmers Are Nearing Extinction" – TIME, November 27, 2019
- ^ Pardey, Philip G.; Alston, Julian M. (2021). "Unpacking the Agricultural Black Box: The Rise and Fall of American Farm Productivity Growth". The Journal of Economic History. 81 (1): 114–155. doi:10.1017/S0022050720000649. ISSN 0022-0507.
- ^ Brazil surpasses the USA and resumes the position of largest producer of soy on the planet
- ^ United States production in 2018, by FAO
- ^ "FAOSTAT". faostat3.fao.org. Retrieved 2015-11-26.
- ^ "United States Crop Rankings – 1997 Production Year". Retrieved 2014-04-01.
- ^ "Crop Values - 2014 Summary" (PDF). Retrieved 2015-11-26.
- ^ "Chapter IX: Farm Resources, Income, and Expenses" (PDF). Archived from the original (PDF) on 2008-04-09. Retrieved 2014-04-01.
- ^ USDA. 2004. 2002 Census of agriculture. United States summary and state data. Vol. 1. Geographic area series. Part 51. AC-02-A-51. 663 pp.
- ^ USDA. 2009. 2007 Census of agriculture. United States summary and state data. Vol. 1. Geographic area series. Part 51. AC-07-A-51. 739 pp.
- ^ USDA. 2014. 2012 Census of agriculture. United States summary and state data. Vol. 1. Geographic area series. Part 51. AC-12-A-51. 695 pp.
- ^ "Appendix A: Glossary" (PDF). Archived from the original (PDF) on March 18, 2009. Retrieved 2014-04-01.
- ^ "ERS/USDA Briefing Room – Farm Structure: Questions and Answers". Archived from the original on February 9, 2008. Retrieved 2014-04-01.
- ^ "Chapter 3: American Farms" (PDF). Archived from the original (PDF) on 2014-08-24. Retrieved 2014-04-01.
- ^ Volkmer, Katrin; Molitor, Whitney Lucas (2019-01-02). "Interventions Addressing Injury among Agricultural Workers: A Systematic Review". Journal of Agromedicine. 24 (1): 26–34. doi:10.1080/1059924X.2018.1536573. ISSN 1059-924X. PMID 30317926. S2CID 52980325.
- ^ [1], Retrieved May 6, 2016
- ^ "Employment by major industry sector". Bls.gov. 2013-12-19. Retrieved 2014-04-01.
- ^ "Extension". Csrees.usda.gov. 2014-03-28. Retrieved 2014-04-01.
- ^ "Farm Demographics – U.S. Farmers by Gender, Age, Race, Ethnicity, and More".
- ^ "Agricultural Workers: Occupational Outlook Handbook: U.S. Bureau of Labor Statistics". Bls.gov. 2014-01-08. Retrieved 2014-04-01.
- ^ Jump up to: a b Youth in Agriculture, OHSA, accessed January 21, 2014
- ^ "Women's Safety and Health Issues at Work Job Area: Agriculture". NIOSH. September 27, 2013.
- ^ "Farm Labor – Background". USDA Economic Research Service. United States Department of Agriculture. Archived from the original on 26 November 2016. Retrieved 26 November 2016.
- ^ Isé, Sabrina; Perloff, Jeffrey M. (1995-05-01). "Legal Status and Earnings of Agricultural Workers". American Journal of Agricultural Economics. 77 (2): 375–386. doi:10.2307/1243547. ISSN 0002-9092. JSTOR 1243547.
- ^ Taylor, J. Edward (1992-11-01). "Earnings and Mobility of Legal and Illegal Immigrant Workers in Agriculture". American Journal of Agricultural Economics. 74 (4): 889–896. doi:10.2307/1243186. ISSN 0002-9092. JSTOR 1243186.
- ^ Martin, Phillip (2002). "Mexican Workers and U.S. Agriculture: The Revolving Door". The International Migration Review. 36 (4): 1124–1142. doi:10.1111/j.1747-7379.2002.tb00120.x. S2CID 145384222.
- ^ "Health care access and health care workforce for immigrant workers in the agriculture, forestry, and fisheries sector in the southeastern US". American Journal of Industrial Medicine. 26 March 2013.
- ^ "NIOSH- Agriculture". United States National Institute for Occupational Safety and Health. Archived from the original on 9 October 2007. Retrieved 2007-10-10.
- ^ Jump up to: a b c Swanson, Naomi; Tisdale-Pardi, Julie; MacDonald, Leslie; Tiesman, Hope M. (13 May 2013). "Women's Health at Work". National Institute for Occupational Safety and Health. Retrieved 21 January 2015.
- ^ "NIOSH Pesticide Poisoning MOnitoring Program Protects Farmworkers". Cdc.gov. 2009-07-31. doi:10.26616/NIOSHPUB2012108. Retrieved 2014-04-01. Cite journal requires
|journal=(help) - ^ Jump up to: a b Calvert, Geoffrey M.; Karnik, Jennifer; Mehler, Louise; Beckman, John; Morrissey, Barbara; Sievert, Jennifer; Barrett, Rosanna; Lackovic, Michelle; Mabee, Laura (Dec 2008). "Acute pesticide poisoning among agricultural workers in the United States, 1998–2005". American Journal of Industrial Medicine. 51 (12): 883–898. doi:10.1002/ajim.20623. ISSN 1097-0274. PMID 18666136. S2CID 9020012.
- ^ Jump up to: a b "NIOSH- Agriculture Injury". United States National Institute for Occupational Safety and Health. Archived from the original on 28 October 2007. Retrieved 2007-10-10.
- ^ NIOSH [2003]. Unpublished analyses of the 1992–2000 Census of Fatal Occupational Injuries Special Research Files provided to NIOSH by the Bureau of Labor Statistics (includes more detailed data than the research file, but excludes data from New York City). Morgantown, WV: U.S. Department of Health and Human Services, Public Health Service, Centers for Disease Control and Prevention, National Institute for Occupational Safety and Health, Division of Safety Research, Surveillance and Field Investigations Branch, Special Studies Section. Unpublished database.
- ^ BLS [2000]. Report on the youth labor force. Washington, DC: U.S. Department of Labor, Bureau of Labor Statistics, pp. 58–67.
- ^ "Guidelines for Children's Agricultural Tasks Demonstrate Effectiveness". Cdc.gov. 2009-07-31. doi:10.26616/NIOSHPUB2011129. Retrieved 2014-04-01. Cite journal requires
|journal=(help) - ^ Habib, R.R.; Fathallah, F.A. (2012). "Migrant women farm workers in the occupational health literature". Work. 41 (1): 4356–4362. doi:10.3233/WOR-2012-0101-4356. PMID 22317389.
- ^ Garcia, Ana M. (2003). "Pesticide Exposure and Women's Health". American Journal of Industrial Medicine. 44 (6): 584–594. doi:10.1002/ajim.10256. PMID 14635235.
- ^ "NIOSH Pesticide Poisoning Monitoring Program Protects Farmworkers". NIOSH. December 2011. Retrieved 20 March 2021.
- ^ "NIOSH Grants and Funding – Extramural Research and Training Programs – Training and Research – Agricultural Centers". Centers for Disease Control and Prevention. 2016-03-03. Retrieved 2016-03-03.
- ^ "Home | CS-CASH | University of Nebraska Medical Center". www.unmc.edu. Retrieved 2016-03-04.
- ^ "Great Plains Center for Agricultural Health | Protecting and improve the health and safety of agricultural workers". www.public-health.uiowa.edu. Retrieved 2016-03-04.
- ^ "High Plains Intermountain Center for Agricultural Health & Safety". csu-cvmbs.colostate.edu. Retrieved 2016-03-04.
- ^ "National Children's Center for Rural Agricultural Health & Safety". Marshfield Clinic Research Foundation. 2016-03-03. Retrieved 2016-03-03.
- ^ "Northeast Center for Occupational Safety and Health in Agriculture, Forestry, and Fishing". Archived from the original on 2012-03-21. Retrieved 2012-02-05.
- ^ "Pacific Northwest Agricultural Safety and Health Center". deohs.washington.edu. Retrieved 2016-03-04.
- ^ "Southeast Center for Agricultural Health and Injury Prevention | University of Kentucky College of Public Health". www.uky.edu. Retrieved 2016-03-04.
- ^ Day, Steven. "Southwest Center for Agricultural Health, Injury Prevention, and Education: Main". www.swagcenter.org. Retrieved 2016-03-04.
- ^ "Upper Midwest Agricultural Safety and Health Center – UMASH". Upper Midwest Agricultural Safety and Health. University of Minnesota. 2016-03-03. Retrieved 2016-03-03.
- ^ Sciences, Department of Public Health. "Western Center for Agricultural Health and Safety". agcenter.ucdavis.edu. Retrieved 2016-03-04.
- ^ Albright, Carmen (2006). "Who's Running The Farm?: Changes and characteristics of Arkansas women in Agriculture". American Agricultural Economics Association: 1315–1322 – via JSTOR.
- ^ Jones, L. (2015). "North Carolina's Farm Women: Plowing around Obstacles". University of Georgia Press. – via JSTOR.
- ^ Golichenko, M.; Sarang, A. (2013). "Farm labor, reproductive justice: Migrant women farmworkers in the US". Health and Human Rights – via JSTOR.
- ^ "USDA National Agricultural Statistics Service - Highlights" (PDF). USDA National Agricultural Statistics. United States Department of Agriculture. Retrieved 10 December 2016.
- ^ Jump up to: a b "Who really owns American farmland? - The New Food Economy". New Food Economy. 2017-07-31. Retrieved 2019-06-18.
- ^ Jump up to: a b Good, Keith (2017-11-08). "Crop Choices, Farm Size: Changes in a Time of Low Corn and Soybean Prices • Farm Policy News". Farm Policy News. Retrieved 2019-06-18.
- ^ Jump up to: a b https://www.agriculture.com/farm-management/farm-land/as-foreign-investment-in-us-farmland-grows-efforts-to-ban-and-limit-the
- ^ https://investigatemidwest.org/2017/06/22/regulation-on-foreign-ownership-of-agricultural-land-a-state-by-state-breakdown/
Cited sources[]
- Mbow, Cheikh; Rosenzweig; Barioni, Luis .G.; Benton, Tim .G. (2019). "Food security". In Shukla, P.R.; Skea, J.; Buendia, E. Calvo; Masson-Delmotte, V. (eds.). Climate Change and Land: an IPCC special report on climate change, desertification, land degradation, sustainable land management, food security, and greenhouse gas fluxes in terrestrial ecosystems. IPCC.
Further reading[]
- Winterbottom, Jo; Huffstutter, P. J. (Feb. 2015). Rent walkouts point to strains in U.S. farm economy, Reuters
External links[]
| Wikimedia Commons has media related to Agriculture in the United States. |
- United States Department of Agriculture
- National Ag Safety Database
- North American Guidelines for Children's Agricultural Tasks Archived 2013-01-17 at the Wayback Machine

- Agriculture in the United States