Bambang, Nueva Vizcaya
Bambang | |
|---|---|
| Municipality of Bambang | |
 Aerial view of Bambang | |
 Flag  Seal | |
 Map of Nueva Vizcaya with Bambang highlighted | |
OpenStreetMap  | |
 Bambang Location within the Philippines | |
| Coordinates: 16°22′57″N 121°06′36″E / 16.3825°N 121.11°ECoordinates: 16°22′57″N 121°06′36″E / 16.3825°N 121.11°E | |
| Country | Philippines |
| Region | Cagayan Valley |
| Province | Nueva Vizcaya |
| District | Lone district |
| Barangays | 25 (see Barangays) |
| Government | |
| • Type | Sangguniang Bayan |
| • Mayor | Dr. Pepito D. Balgos |
| • Vice Mayor | Gregorio B. Allas Jr. |
| • Electorate | 32,599 voters (2019) |
| Area | |
| • Total | 345.00 km2 (133.21 sq mi) |
| Elevation | 392 m (1,286 ft) |
| Highest elevation | 771 m (2,530 ft) |
| Lowest elevation | 305 m (1,001 ft) |
| Population (2020 census) [3] | |
| • Total | 55,789 |
| • Density | 160/km2 (420/sq mi) |
| • Households | 13,272 |
| Economy | |
| • Income class | 1st municipal income class |
| • Poverty incidence | 8.41% (2015)[4] |
| • Revenue | ₱269,774,327.07 (2020) |
| • Assets | ₱530,979,144.32 (2020) |
| • Expenditure | ₱265,258,781.34 (2020) |
| • Liabilities | ₱142,686,647.51 (2020) |
| Service provider | |
| • Electricity | Nueva Vizcaya Electric Cooperative (NUVELCO) |
| Time zone | UTC+8 (PST) |
| ZIP code | 3702 |
| PSGC | |
| IDD : area code | +63 (0)78 |
| Native languages | Gaddang Ilocano Isinai Tagalog |

Bambang, officially the Municipality of Bambang (Gaddang: Ili na Bambang; Ilocano: Ili ti Bambang; Tagalog: Bayan ng Bambang), is a 1st class municipality in the province of Nueva Vizcaya, Philippines. According to the 2020 census, it has a population of 55,789 people. [3]
The municipality is known for its salt springs at the Salinas Natural Monument.
Etymology[]
The name "Bambang" is an Isinay word meaning "to dig".
History[]
Bambang has its beginning in the early period of Spanish colonization.
The first mission that dared to penetrate the dangerous wilderness and insect-infested jungles of what is southern Nueva Vizcaya today was by the Dominican Order in 1607. However, it was only two years later (1609) when a Dominican missionary come from Pangasinan. Father Tomas Gutierez arrived to establish the first missionary settlement. This settlement was subsequently called Ytuy which today actually comprises the towns of Aritao, Dupax, Bambang and a part of the Igorot tribal lands to the west (now Kayapa). Originally these places were inhabited by the Igorot and Panuypuyes (Aritao), the Ilongots (Dupax and Bambang) and the lgorot in the area west from the present native population of Dupax, Aritao, and Bambang came about by the inter-marriages of the tribes mentioned above.
Recent development and progress[]
In 2012, Bambang became open to big dealers and businessmen as part of its progress. Now the town has its own newly opened fast food chains and other marketing establishments.[5]
Barangays[]


Bambang is politically subdivided into 25 barangays.
- Abian
- Abinganan
- Aliaga
- Almaguer North
- Almaguer South
- Banggot (Urban)
- Barat
- Buag (Urban)
- Calaocan (Urban)
- Dullao
- Homestead (Urban)
- Indiana
- Mabuslo
- Macate
- Magsaysay Hill (Urban)
- Manamtam
- Mauan
- Pallas
- Salinas
- San Antonio North
- San Antonio South
- San Fernando
- San Leonardo
- Santo Domingo Proper (Tabangan)
- Santo Domingo West
Climate[]
| Climate data for Bambang, Nueva Vizcaya | |||||||||||||
|---|---|---|---|---|---|---|---|---|---|---|---|---|---|
| Month | Jan | Feb | Mar | Apr | May | Jun | Jul | Aug | Sep | Oct | Nov | Dec | Year |
| Average high °C (°F) | 25 (77) |
28 (82) |
30 (86) |
31 (88) |
30 (86) |
29 (84) |
28 (82) |
28 (82) |
28 (82) |
29 (84) |
28 (82) |
27 (81) |
28 (83) |
| Average low °C (°F) | 18 (64) |
19 (66) |
20 (68) |
22 (72) |
23 (73) |
23 (73) |
23 (73) |
23 (73) |
23 (73) |
21 (70) |
20 (68) |
19 (66) |
21 (70) |
| Average precipitation mm (inches) | 21 (0.8) |
28 (1.1) |
34 (1.3) |
58 (2.3) |
160 (6.3) |
179 (7.0) |
226 (8.9) |
225 (8.9) |
215 (8.5) |
168 (6.6) |
59 (2.3) |
32 (1.3) |
1,405 (55.3) |
| Average rainy days | 7.5 | 8.5 | 10.9 | 14.9 | 23.9 | 25.7 | 26.7 | 25.3 | 24.9 | 18.6 | 11.8 | 8.9 | 207.6 |
| Source: Meteoblue [6] | |||||||||||||
Demographics[]
|
| |||||||||||||||||||||||||||||||||||||||||||||||||||
| Source: Philippine Statistics Authority [7] [8] [9][10] | ||||||||||||||||||||||||||||||||||||||||||||||||||||
Economy[]
| Poverty Incidence of Bambang | |
| Source: Philippine Statistics Authority[11][12][13][14][15][16] | |
Transportation[]
Among the most popular form of travel in and around Bambang is by jeepney. Jeepnies are used to bring produce in from neighboring municipalities, and for public transportation for residents and travelers. For shorter distances, tricycles are another great form of public transportation.
Bambang is less than a day away from the beautiful Banaue Rice Terraces and hour away from shopping in the urban Solano.
Local government[]
As per Philippine Statistics Authority, Nueva Vizcaya province is part of Region-II (Cagayan Valley), Province Code for Nueva Vizcaya is 50, Municipality Code for Bambang Municipality within Nueva Vizcaya province is 4.
List of local chief executives[]
- Luisa Lloren Cuaresma: 1989–1998
- Dr. Pepito D. Balgos M.d.: 1998–2007
- Benjamin L.Cuaresma III: 2007–2010
- Atty. Flaviano D. Balgos, Jr.: 2010–2019
Celebrations[]
Panggayjaya is the festival name of the town which celebrated in late May to April yearly. Part of it is the annual Miss Panggayjaya (Bambang) and the counterpart Mister Bambang started in 2016. Along with celebration of its patron, Saint Catherine of Siena.
Education[]

- Tertiary
- King's College of the Philippines (formerly: Eastern Luzon Colleges)
- Nueva Vizcaya State University
- Advocates College
- High School
- King's College of the Philippines (formerly: Eastern Luzon Colleges)
- Saint Catherine's School
- Bambang National High School
- Salinas High School
- Sto. Domingo Integrated School
- Elementary
- Abinganan Elementary School
- Abian Elementary School
- Aliaga Elementary School
- Aliaga Annex Primary School
- Almaguer North Elementary School
- Almaguer South Elementary School
- Bambang West Elementary School
- Bambang Central School
- Bambang North Central School
- Bambang East Elementary School
- Barat Elementary School
- Dullao Elementary School
- Indiana Elementary School
- Labni Elementary School
- Mabuslo Elementary School
- Macate Elementary School
- Mauan Elementary School
- Nangcalapan Primary School
- Pallas Elementary School
- Salinas Elementary School
- Salicpan Elementary School
- San Antonio South Elementary School
- San Antonio North Elementary School
- San Fernando Elementary School
- San Leonardo Elementary School
- Sto. Nino Primary School
- Kiddie Kingdom International School
- Saint Catherine's School
- California Academy
- Aurora Christian School Foundation
- Camella SNV Montessori School
Gallery[]

Bambang Municipal Hall
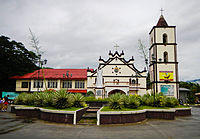
Saint Catherine of Siena Parish Church

Bambang Gymnasium

Bambang (agriculture) Monument

Welcome Lion Monument


References[]
- ^ Municipality of Bambang | (DILG)
- ^ "2015 Census of Population, Report No. 3 – Population, Land Area, and Population Density" (PDF). Philippine Statistics Authority. Quezon City, Philippines. August 2016. ISSN 0117-1453. Archived (PDF) from the original on 25 May 2021. Retrieved 16 July 2021.
- ^ a b Census of Population (2020). "Region II (Cagayan Valley)". Total Population by Province, City, Municipality and Barangay. PSA. Retrieved 8 July 2021.
- ^ https://psa.gov.ph/sites/default/files/City%20and%20Municipal-level%20Small%20Area%20Poverty%20Estimates_%202009%2C%202012%20and%202015_0.xlsx; publication date: 10 July 2019; publisher: Philippine Statistics Authority.
- ^ "Archived copy". Manila Bulletin. Archived from the original on 13 May 2012. Retrieved 16 June 2012.CS1 maint: archived copy as title (link) |title: Bambang, Nueva Vizcaya Development
- ^ "Bambang Average Temperatures and Rainfall". Meteoblue. Retrieved 4 July 2021.
- ^ Census of Population (2015). "Region II (Cagayan Valley)". Total Population by Province, City, Municipality and Barangay. PSA. Retrieved 20 June 2016.
- ^ Census of Population and Housing (2010). "Region II (Cagayan Valley)". Total Population by Province, City, Municipality and Barangay. NSO. Retrieved 29 June 2016.
- ^ Censuses of Population (1903–2007). "Region II (Cagayan Valley)". Table 1. Population Enumerated in Various Censuses by Province/Highly Urbanized City: 1903 to 2007. NSO.
- ^ "Province of Nueva Vizcaya". Municipality Population Data. Local Water Utilities Administration Research Division. Retrieved 17 December 2016.
- ^ "Poverty incidence (PI):". Philippine Statistics Authority. Retrieved 28 December 2020.
- ^ https://psa.gov.ph/sites/default/files/NSCB_LocalPovertyPhilippines_0.pdf; publication date: 29 November 2005; publisher: Philippine Statistics Authority.
- ^ https://psa.gov.ph/sites/default/files/2003%20SAE%20of%20poverty%20%28Full%20Report%29_1.pdf; publication date: 23 March 2009; publisher: Philippine Statistics Authority.
- ^ https://psa.gov.ph/sites/default/files/2006%20and%202009%20City%20and%20Municipal%20Level%20Poverty%20Estimates_0_1.pdf; publication date: 3 August 2012; publisher: Philippine Statistics Authority.
- ^ https://psa.gov.ph/sites/default/files/2012%20Municipal%20and%20City%20Level%20Poverty%20Estima7tes%20Publication%20%281%29.pdf; publication date: 31 May 2016; publisher: Philippine Statistics Authority.
- ^ https://psa.gov.ph/sites/default/files/City%20and%20Municipal-level%20Small%20Area%20Poverty%20Estimates_%202009%2C%202012%20and%202015_0.xlsx; publication date: 10 July 2019; publisher: Philippine Statistics Authority.
External links[]
| Wikimedia Commons has media related to Bambang, Nueva Vizcaya. |
- Bambang Profile at PhilAtlas.com
- Philippine Standard Geographic Code
- Philippine Census Information
- [1]
- Local Governance Performance Management System
Places adjacent to Bambang, Nueva Vizcaya | ||||||||||||||||
|---|---|---|---|---|---|---|---|---|---|---|---|---|---|---|---|---|
| ||||||||||||||||
- Municipalities of Nueva Vizcaya