Economy of the Philippines
This article needs additional citations for verification. (August 2021) |
 Metro Manila, the center of economy and the largest metropolitan area in the Philippines | |
| Currency | Philippine peso (Filipino: piso; sign: ₱; code: PHP) |
|---|---|
Fiscal year | Calendar year |
Trade organizations | APEC, ASEAN, WTO, EAS, AFTA, ADB, and others |
Country group |
|
| Statistics | |
| Population | |
| GDP | |
| GDP rank | |
GDP growth | 11.2% (2021) |
GDP per capita | |
GDP per capita rank | |
GDP by sector |
|
Inflation (CPI) | 4.5% (April 2021 est.)[4] |
Population below poverty line | |
Gini coefficient | |
Labor force | |
Labor force by occupation |
|
| Unemployment |
|
Main industries | electronics assembly, aerospace, business process outsourcing, food manufacturing, shipbuilding, chemicals, textiles, garments, metals, petroleum refining, fishing, steel, rice[16] |
| External | |
| Exports | $86.6 billion (2019)[18] |
Export goods | semiconductors and electronic products, machinery and transport equipment, wood manufactures, chemicals, processed food and beverages, garments, coconut oil, copper concentrates, seafood, bananas/fruits[19] |
Main export partners |
|
| Imports | $180 billion (2019)[18] |
Import goods | electronic products, mineral fuels, machinery and transport equipment, iron and steel, textile fabrics, grains, chemicals, plastic[19] |
Main import partners |
|
FDI stock | |
Current account | |
Gross external debt | |
| Public finances | |
| 37.6% of GDP (Q2 2019)[22] | |
| −2.2% (of GDP) (2017 est.)[13] | |
| Revenues | 49.07 billion (2017 est.)[13] |
| Expenses | $56.02 billion (2017 est.)[13] |
| Economic aid | $1.67 billion[23] |
Foreign reserves | |
The economy of the Philippines is the world's 27th largest economy by nominal GDP according to the International Monetary Fund 2021 and the 10th largest economy in Asia. The Philippines is one of the emerging markets, and the 3rd highest economy in Southeast Asia by nominal GDP nominal, following Thailand and Indonesia.
The Philippines is primarily considered a newly industrialized country, which has an economy in transition from one based on agriculture to one based more on services and manufacturing. As of 2021, GDP by purchasing power parity was estimated to be at $1.47 trillion, the 18th in the world.[31]
The country's primary exports include semiconductors and electronic products, transport equipment, garments, copper products, petroleum products, coconut oil, and fruits. Its major trading partners include Japan, China, the United States, Singapore, South Korea, the Netherlands, Hong Kong, Germany, Taiwan, and Thailand. The Philippines has been named as one of the Tiger Cub Economies, alongside Indonesia, Malaysia, Vietnam, and Thailand. It is currently one of Asia's fastest growing economies. However, major problems remain, mainly having to do with alleviating the wide income and growth disparities between the country's different regions and socioeconomic classes, reducing corruption, and investing in the infrastructure necessary to ensure future growth.
The Philippine economy is projected to be the 4th largest in Asia and 13th or 16th biggest in the world by 2050.[32][33]
History[]
Pre-colonial era (900s–1565)[]


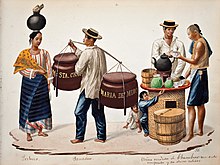
The economic history of the Philippine Islands had been traced back to the pre-colonial times. The country which was then composed of different kingdoms and thalassocracies oversaw the large number of merchants coming to the islands for trade. Indian, Arab, Chinese and Japanese merchants were welcomed by these kingdoms, which were mostly located by riverbanks, coastal ports and central plains. The merchants traded for goods such as gold, rice, pots and other products. Foreign merchants, asides from bartering, also had to deal with loans-on-credit, hostage-exchange or outright raiding from Filipino kingdoms.[34] However, the barter system was implemented most, at that time, and the pre-colonial people enjoyed a life filled with imported goods which reflected their fashion and lifestyle.
From the 12th century, a huge industry centred around the manufacture and trade of burnay clay pots, used for the storage of tea and other perishables, was set up in the northern Philippines with Japanese and Okinawan traders. These pots were known as 'Ruson-tsukuri' (Luzon-made) in Japanese, and were considered among the best storage vessels used for the purpose of keeping tea leaves and rice wine fresh. Hence, Ruson-Tsukuri pots became sought after in Northeast Asia. Each Philippine kiln had its own branding symbol, marked on the bottom of the Ruson-tsukuri by a single baybayin letter.
The people also were great agriculturists and the islands especifically Luzon has great abundance of rice, fowls, wine as well as great numbers of carabaos, deer, wild boar and goats. In addition, there were also great quantities of cotton and colored clothes, wax, honey and date palms produced by the natives. The precolonial state of Caboloan in Pangasinan often exported deer-skins to Japan and Okinawa. The Nation of Ma-i produced beeswax, cotton, true pearls, tortoise shell, medicinal betel nuts and yuta cloth in their trade with East Asia. By the early sixteenth century, the two largest polities of the Pasig River delta, Maynila and Tondo, established a shared monopoly on the trade of Chinese goods throughout the rest of the Philippine archipelago.[35]
The Visayas islands which is home to the Kedatuan of Madja-as, the Kedatuan of Dapitan and the Rajahnate of Cebu on the other hand were abundant in rice, fish, cotton, swine, fowls, wax and honey. Leyte was said to produce two rice crops a year, and Pedro Chirino commented on the great rice and cotton harvests that were sufficient to feed and clothe the people.
In Mindanao, the Rajahnate of Butuan specialized in the mining of gold and the manufacture of jewelry. The Sultanate of Maguindanao was known for the raising and harvesting of cinnamon. The Sultanate of Lanao had a fishing industry by lake Lanao and the Sultanate of Sulu had lively pearl-diving operations.
The kingdoms of ancient Philippines were active in international trade, and they used the ocean as natural highways.[36] Ancient peoples were engaged in long-range trading with their Asian neighbors as far as west as Maldives and as far as north as Japan.
Some historians even proposed that they also had regular contacts with other Austronesian people in Western Micronesia because it was the only area in the Oceania that had rice crops, tuba (fermented coconut sap), and tradition of betel nut chewing when the first Europeans arrived there. The uncanny resemblance of complex body tattoos among the Visayans and those of Borneo also proved some interesting connection between Borneo and ancient Philippines.[37] Magellan's chronicler, Antonio Pigafetta, mentioned that merchants and ambassadors from all surrounding areas came to pay tribute to the rajah of Sugbu (Cebu) for the purpose of trade. While Magellan's crew were with the rajah, a representative from Siam was paying tribute to the rajah.[37] Miguel López de Legazpi also wrote how merchants from Luzon and Mindoro had come to Cebu for trade, and he also mentioned how the Chinese merchants regularly came to Luzon for the same purpose.[37] The Visayan Islands had earlier encounters with Greek traders in 21 AD.[38] Its people enjoyed extensive trade contacts with other cultures. Indians, Japanese, Arabs, Vietnamese, Cambodians, Thais, Malays and Indonesians as traders or immigrants.[39][40]
Aside from trade relations, the natives were also involved in aquaculture and fishing. The natives made use of the salambao, a type of raft that utilizes a large fishing net which is lowered into the water via a type of lever made of two criss-crossed poles. Night fishing was accomplished with the help of candles made from a particular type of resin similar to the copal of Mexico. Use of safe pens for incubation and protection of the small fry from predators was also observed, and this method astonished the Spaniards at that time.[37] During fishing, large mesh nets were also used by the natives to protect the young and ensure future good catches.
From the early 1500s to as late as the 1560s, people from Luzon, Philippines; were referred to in Portuguese Malacca as Luções, and they set up many overseas communities across Southeast Asia where they participated in trading ventures and military campaigns in Burma, Malacca and Eastern Timor[41][42][43] as traders and mercenaries.[44][45][46] One prominent Luções was Regimo de Raja, who was a spice magnate and a Temenggung (Jawi: تمڠݢوڠ)[47] (Governor and Chief General) in Portuguese Malacca. He was also the head of an armada which traded and protected commerce between the Indian Ocean, the Strait of Malacca, the South China Sea,[48] and the medieval maritime principalities of the Philippines.[49][50]
Spanish colonial period[]
New Spain (1565–1815)[]


The natives were slavered among them by other tribes like Lapu-Lapu which forced other islands to pay taxes. The arrival of the Spanish removed this slavering system. Miguel Lopez de Legazpi with Tlaxcaltecs from Mexico conquered and unified the islands. This conquest was possible as a result of the discovery of the trip back to Mexico coast by Agustino Urdaneta. The administration of Islas Filipinas was carried out through the Capitania General and depended on Mexico Capital which formed the New Spain Viceroyalty. The economy of Islas Filipinas grew further when the Spanish government inaugurated the Manila Galleon trade system. Trading ships, settlers[51] and military reinforcements[52] made voyages once or twice per year across the Pacific Ocean from the port of Acapulco in Mexico to Manila in the Philippines. Both cities were part of the then Province of New Spain.
This trade made the city of Manila one of the major global cities in the world, improving the growth of the Philippine economy in the succeeding years. Trade also introduced foodstuffs such as maize, tomatoes, potatoes, chili peppers, chocolate and pineapples from Mexico and Peru. Tobacco, first domesticated in Latin-America, and then introduced to the Philippines, became an important cash crop for Filipinos. The Philippines also became the distribution center of silver mined in the Americas, which was in high demand in Asia, during the period.[53] In exchange for this silver, Manila gathered Indonesian spices, Chinese silks and Indian gems to be exported to Mexico.[54]
The Manila Galleon system operated until 1815, when Mexico got its independence. Nevertheless, it didn't affect the economy of the islands.
On March 10, 1785, King Charles III of Spain confirmed the establishment of the Royal Philippine Company with a 25-year charter. The Basque-based company was granted a monopoly on the importation of Chinese and Indian goods into the Philippines, as well as the shipping of the goods directly to Spain via the Cape of Good Hope.[55]
Spanish East Indies (1815–1898)[]
This section does not cite any sources. (December 2015) |


After Spain lost Mexico as a territory, New Spain was dissolved making the Philippines and other Pacific islands to form the Spanish East Indies. This resulted in the Philippines being governed directly by the King of Spain and the Captaincy General of the Philippines while the Pacific islands of Northern Mariana Islands, Guam, Micronesia and Palau was governed by the Real Audiencia of Manila and was part of the Philippine territorial governance.
It made the economy of the Philippines grow further as people saw the rise of opportunities. Agriculture remained the largest contributor to economy, being the largest producer of coffee in Asia as well as a large produce of tobacco.
In Europe, the Industrial Revolution spread from Great Britain during the period known as the Victorian Age. The industrialization of Europe created great demands for raw materials from the colonies, bringing with it investment and wealth, although this was very unevenly distributed. Governor-General Basco had opened the Philippines to this trade. Previously, the Philippines was seen as a trading post for international trade but in the nineteenth century it was developed both as a source of raw materials and as a market for manufactured goods. The economy of the Philippines rose rapidly and its local industries developed to satisfy the rising demands of an industrializing Europe. A small flow of European immigrants came with the opening of the Suez Canal, which cut the travel time between Europe and the Philippines by half. New ideas about government and society, which the friars and colonial authorities found dangerous, quickly found their way into the Philippines, notably through the Freemasons, who along with others, spread the ideals of the American, French and other revolutions, including Spanish liberalism.
In 1834, the Royal Company of the Philippines was abolished, and free trade was formally recognized. With its excellent harbor, Manila became an open port for Asian, European, and North American traders. European merchants alongside the Chinese immigrants opened stores selling goods from all parts of the world. The El Banco Español Filipino de Isabel II (now Bank of the Philippine Islands) was the first bank opened in the Philippines in 1851.
In 1873, additional ports were opened to foreign commerce, and by the late nineteenth century three crops—tobacco, abaca, and sugar—dominated Philippine exports.
First Philippine Republic (1899–1901)[]
The economy of the Philippines during the insurgency of the First Philippine Republic remained the same throughout its early years but was halted due to the break out of the Philippine–American War. Nevertheless, during the era of the First Republic, the estimated GDP per capita for the Philippines in 1900 was of $1,033.00. That made it the second richest place in all of Asia, just a little behind Japan ($1,135.00), and far ahead of China ($652.00) or India ($625.00).[56]
American colonial period (1901–1940)[]

The results of the economy under the Americans were mixed. An initial high growth phase occurred during the 1910s due to the recovery from the wars with Spain and the US, and investment in agriculture. The Philippines would at first briefly outpace its neighbors. This would not last as growth fell behind in the later years. Stagnation in the late 1920s and beyond took place as access to US markets became restricted by protectionist quotas and fiscal restraints forestalled any further development in agriculture.[57]
The growth period can be attributed to the results of a crash program in agricultural modernization undertaken in 1910–1920. This in turn was done in order to address the growing shortfall in the supply of rice. The Philippines once a net exporter became an importer of rice as a result of the wars with the Spanish and later the Americans and by the reallocation of labour to export crops.[58]
The 1930s would mark the end to this period of relative prosperity. The Sugar Act of 1934 capped Philippines sugar exports to the US at 921,000 tons per year. Expenditure on public infrastructure for agriculture was reduced as the Payne–Aldridge Act stripped the government of customs revenue. Manila hemp was now competing against the newly invented Nylon. Although the area of land cultivated for agriculture was still increasing, the rate was reduced to 1% per annum.[59]
The policy with the most far reaching consequences of this period was the peg between the peso and dollar. This was enforced by law until 1975. It provided monetary stability for foreign investment inflows, which lead to 40% of all capital invested in manufacturing and commercial enterprises to be owned by foreign entities by 1938. On the other hand, this overvaluation of the peso would have a negative impact with foreign trade with the rest of Asia. Economic policy leading to independence would have necessitated loosening trade links with the US. In order to achieve an internationally competitive exchange rate, the peso dollar link would have to be broken. The much belated move to a true floating exchange rate led to uncompetitive exports as such an import substitution strategy remained until significant currency devaluation opened up the opportunity for reorienting towards exports.[60]
| 1900 | 1913 | 1929 | 1938 | 1950 | 1970 | 1990 | |
|---|---|---|---|---|---|---|---|
| Burma | 647 | 635 | NA | 685 | 393 | 602 | 687 |
| India | 625 | 663 | 665 | 619 | 597 | 878 | 1316 |
| Indonesia | 745 | 917 | 1207 | 1136 | 916 | 1239 | 2525 |
| Japan | 1135 | 1334 | 1949 | 2356 | 1873 | 9448 | 18548 |
| Philippines | 1033 | 1418 | 1564 | 1497 | 1293 | 1766 | 2300 |
| South Korea | 850 | 948 | 1164 | 1649 | 876 | 2208 | 8977 |
| Taiwan | 759 | 794 | 1107 | 1320 | 922 | 2692 | 10324 |
| Thailand | 812 | 846 | 799 | 832 | 882 | 1596 | 4173 |
| 1900–13 | 1913–29 | 1929–38 | 1938–50 | 1950–70 | 1970–90 | |
|---|---|---|---|---|---|---|
| Burma | 1.19 | 2.42 | −0.45 | −3.65 | 4.12 | 2.82 |
| India | 0.96 | 0.59 | 0.49 | 0.93 | 3.98 | 4.27 |
| Indonesia | 2.79 | 2.85 | 0.77 | −0.40 | 3.34 | 5.73 |
| Japan | 2.46 | 3.63 | 3.53 | −0.66 | 9.20 | 4.22 |
| Philippines | 2.44 | 0.61 | −0.47 | −1.23 | 2.40 | 1.32 |
| South Korea | 2.05 | 3.10 | 5.04 | −2.80 | 6.82 | 8.48 |
| Taiwan | 1.83 | 3.69 | 4.56 | −0.26 | 8.43 | 8.36 |
| Thailand | 1.64 | 1.69 | 2.86 | 2.33 | 6.21 | 7.03 |
World War II (1941–1945)[]

Due to the Japanese invasion establishing the unofficial Second Philippine Republic, the economic growth receded and food shortages occurred. Prioritizing the shortages of food, Jose Laurel, the appointed President, organized an agency to distribute rice, even though most of the rice was confiscated by Japanese soldiers. Manila was one of the many places in the country that suffered from severe shortages, due mainly to a typhoon that struck the country in November 1943. The people were forced to cultivate private plots which produced root crops like kangkong. The Japanese, in order to raise rice production in the country, brought a quick-maturing horai rice, which was first used in Taiwan. Horai rice was expected to make the Philippines self-sufficient in rice by 1943, but rains during 1942 prevented this.
Also during World War II in the Philippines, the occupying Japanese government issued fiat currency in several denominations; this is known as the Japanese government-issued Philippine fiat peso.
The first issue in 1942 consisted of denominations of 1, 5, 10 and 50 centavos and 1, 5, and 10 Pesos. The next year brought "replacement notes" of the 1, 5 and 10 Pesos while 1944 ushered in a 100 Peso note and soon after an inflationary 500 Pesos note. In 1945, the Japanese issued a 1,000 Pesos note. This set of new money, which was printed even before the war, became known in the Philippines as Mickey Mouse money due to its very low value caused by severe inflation. Anti-Japanese newspapers portrayed stories of going to the market laden with suitcases or "bayong" (native bags made of woven coconut or buri leaf strips) overflowing with the Japanese-issued bills.[62] In 1944, a box of matches cost more than 100 Mickey Mouse pesos.[63] In 1945, a kilogram of camote cost around 1000 Mickey Mouse pesos.[64] Inflation plagued the country with the devaluation of the Japanese money, evidenced by a 60% inflation experienced in January 1944.[65]
Third Philippine Republic (1946–1965)[]
After the re-establishment of the Commonwealth in 1945, the country was left with a devastated city, food crisis and financial crisis. A year later in 1946, the Philippines got its independence in America, creating the Third Philippine Republic.
In an effort to solve the massive socio-economic problems of the period, newly elected President Manuel Roxas reorganized the government, and proposed a wide-sweeping legislative program. Among the undertakings of the Third Republic's initial year were: The establishment of the Rehabilitation Finance Corporation (which would be reorganized in 1958 as the Development Bank of the Philippines);[66] the creation of the Department of Foreign Affairs and the organization of the foreign service through Executive Order No. 18; the GI Bill of Rights for Filipino veterans; and the revision of taxation laws to increase government revenues.[67]
President Roxas moved to strengthen sovereignty by proposing a Central Bank for the Philippines to administer the Philippine banking system[68] which was established by Republic Act No. 265.
In leading a "cash-starved[69] government" that needed to attend a battered nation, President Roxas campaigned for the parity amendment to the 1935 Constitution. This amendment, demanded by the Philippine Trade Relations Act or the Bell Trade Act,[70] would give American citizens and industries the right to utilize the country's natural resources in return for rehabilitation support from the United States. The President, with the approval of Congress, proposed this move to the nation through a plebiscite.
The Roxas administration also pioneered the foreign policy of the Republic. Vice President Elpidio Quirino was appointed Secretary of Foreign Affairs. General Carlos P. Romulo, as permanent representative[71] of the Philippines to the United Nations, helped shape the country's international identity in the newly established stage for international diplomacy and relations. During the Roxas administration, the Philippines established diplomatic ties with foreign countries and gained membership to international entities, such as the United Nations General Assembly, the United Nations Educational, Scientific and Cultural Organization (UNESCO), the World Health Organization (WHO), the International Labor Organization (ILO), etc.
When President Carlos P. Garcia won the elections, his administration promoted the "Filipino First" policy, whose focal point was to regain economic independence; a national effort by Filipinos to "obtain major and dominant participation in their economy."[72] The administration campaigned for the citizens' support in patronizing Filipino products and services, and implemented import and currency controls favorable for Filipino industries.[73] In connection with the government's goal of self-sufficiency was the "Austerity Program," which President Garcia described in his first State of the NatIon Address as "more work, more thrift, more productive investment, and more efficiency" that aimed to mobilize national savings.[74] The Anti Graft and Corrupt Practices Act, through Republic Act No. 301, aimed to prevent corruption, and promote honesty and public trust. Another achievement of the Garcia administration was the Bohlen–Serrano Agreement of 1959, which shortened the term of lease of the US military bases in the country from the previous 99 to 25 years.[75]
President Diosdado Macapagal, during his inaugural address on December 30, 1961, emphasized the responsibilities and goals to be attained in the "new era" that was the Macapagal administration. He reiterated his resolve to eradicate corruption, and assured the public that honesty would prevail in his presidency. President Macapagal, too, aimed at self-sufficiency and the promotion of every citizen's welfare, through the partnership of the government and private sector, and to alleviate poverty by providing solutions for unemployment.
Among the laws passed during the Macapagal administration were: Republic Act No. 3844 or the Agricultural Land Reform Code (an act that established the Land Bank of the Philippines);[76] Republic Act No. 3466, which established the Emergency Employment Administration; Republic Act No. 3518, which established the Philippine Veterans Bank; Republic Act No. 3470, which established the National Cottage Industries Development Authority (NACIDA) to organize, revive, and promote the establishment of local cottage industries; and Republic Act No. 4156, which established the Philippine National Railways (PNR) to operate the national railroad and tramways. The administration lifted foreign exchange controls as part of the decontrol program in an attempt to promote national economic stability and growth.
Fourth and Fifth Philippine Republics (1965–present)[]
Marcos era (1965–1986)[]
In the late 1960s, economic policy began to reflect the preferences of the International Monetary Fund and the World Bank. The Asian Development Bank and International Rice Research Institute became headquartered in the Philippines in the 1970s.[77]
President Ferdinand E. Marcos declared martial law in the midst of rising student movements and an increasing number communist and socialist groups lobbying for reforms in their respective sectors. Leftists held rallies to express their frustrations to the government, this restiveness culminating in the First Quarter Storm (January 26 to March 17, 1970),[78] where activists stormed Malacañang Palace only to be turned back by the Philippine Constabulary.[when?] This event in particular left four people dead and many injured after heavy exchanges of gunfire. There was further unrest, and in the middle of the disorder on September 21, 1972, Marcos issued Proclamation No. 1081, effectively installing martial law in the Philippines, a declaration that suspended civil rights and imposed military rule in the country.
The GDP of the Philippines rose during the martial law. This growth was spurred by massive lending from commercial banks, accounting for about 62% percent of external debt.[79] As a developing country, the Philippines during the martial law was one of the heaviest borrowers.[citation needed] These aggressive moves were seen by critics as a means of legitimizing martial law by purportedly enhancing the chances of the country in the global market. Much of the money was spent on pump-priming to improve infrastructure and promote tourism. However, despite the aggressive borrowing and spending policies, the Philippines lagged behind its Southeast Asia counterparts in GDP growth rate per capita. The country, in 1970–1980, only registered an average 5.73 percent growth, while its counterparts like Thailand, Malaysia, Singapore, and Indonesia garnered a mean growth of 7.97 percent. This lag, which became very apparent at the end of the Marcos Regime, can be attributed to the failures of economic management that was brought upon by State-run monopolies, mismanaged exchange rates, imprudent monetary policy and debt management, all underpinned by rampant corruption and cronyism. As said by Emmanuel de Dios “[…]main characteristics distinguishing the Marcos years from other periods of our history has been the trend towards the concentration of power in the hands of the government, and the use of governmental functions to dispense economic privileges to some small factions in the private sector.”[79]
There are few more palpable and glaring examples of the economic mismanagement of the time than the Bataan Nuclear Power Plant (BNPP) located in Morong, Bataan. Started in the 1970s, the BNPP was supposed to boost the country's competitiveness by providing affordable electricity to fuel industrialization and job creation in the country. Far from this, the US$2.3 billion nuclear plant suffered from cost over-runs and engineering and structural issues which eventually led to its mothballing—without generating a single watt of electricity.
Income inequality grew during the era of martial law, as the poorest 60 percent of the nation were able to contribute only 22.5 percent of the income in 1980, down from 25.0 percent in 1970. The richest 10 percent, meanwhile, took a larger share of the income at 41.7 percent in 1980, up from 37.1 percent in 1970.[79] These trends coincided with accusations of cronyism in the Marcos administration, as the administration faced questions of favoring certain companies that were close to the ruling family.
According to the FIES (Family Income and Expenditure Survey) conducted from 1965 to 1985, poverty incidence in the Philippines rose from 41 percent in 1965 to 58.9 percent in 1985. This can be attributed to lower real agricultural wages and lesser real wages for unskilled and skilled laborers. Real agricultural wages fell about 25 percent from their 1962 level, while real wages for unskilled and skilled laborers decreased by about one-third of their 1962 level. It was observed that higher labor force participation and higher incomes of the rich helped cushion the blow of the mentioned problems.[how?]
C. Aquino administration (1986–1992)[]
This section does not cite any sources. (December 2015) |
The Corazon Aquino administration took over an economy that had gone through socio-political disasters during the People Power revolution, where there was financial and commodity collapse caused by an overall consumer cynicism, a result of the propaganda against cronies, social economic unrest resulting from numerous global shortages, massive protests, lack of government transparency, the opposition's speculations, and various assassination attempts and failed coups. At that point in time, the country's incurred debt from the Marcos Era's debt-driven development began crippling the country, which slowly made the Philippines the "Latin-American in East Asia" as it started to experience the worst recession since the post-war era.
Most of the immediate efforts of the Aquino administration was directed in reforming the image of the country and paying off all debts, including those that some governments were ready to write-off, as possible. This resulted in budget cuts and further aggravated the plight of the lower class because the jobs offered to them by the government were now gone. Infrastructure projects, including repairs, were halted in secluded provinces turning concrete roads into asphalt. Privatization of many government corporations, most catering utilities, was the priority of the Aquino administration which led to massive lay-offs and inflation. The Aquino administration was persistent in its belief that the problems that arose from the removal of the previous administration can be solved by the decentralization of power.
Growth gradually began in the next few years of the administration. Somehow, there was still a short-lived, patchy, and erratic recovery from 1987 to 1991 as the political situation stabilized a bit. With this, the peso became more competitive, confidence of investors was gradually regained, positive movements in terms of trade were realized, and regional growth gradually strengthened.
Ramos administration (1992–1998)[]
The Ramos administration basically served its role as the carrier of the momentum of reform and as an important vehicle in "hastening the pace of liberalization and openness in the country".[80] The administration was a proponent of capital account liberalization, which made the country more open to foreign trade, investments, and relations. It was during the term of the administration when the Bangko Sentral ng Pilipinas was established, and the Philippines joined the World Trade Organization and other free trade associations such as the APEC. Also, debt reduction was considered and as such, the issuance of certain government bonds called Brady Bonds also came to fruition in 1992. Key negotiations with conflicting forces in Mindanao actually became more successful during the administration, with Jose Almonte as one of the key adviser of the administration.
By the time Ramos succeeded Corazon Aquino in 1992, the Philippine economy was already burdened with a heavy budget deficit. This was largely the result of austerity measures imposed by a standard credit arrangement with the International Monetary Fund and the destruction caused by natural disasters such as the eruption of Mt. Pinatubo. Hence, according to Canlas, pump priming through government spending was immediately ruled out due to the deficit. Ramos therefore resorted to institutional changes through structural policy reforms, of which included privatization and deregulation. He sanctioned the formation of the Legislative-Executive Development Advisory Council (LEDAC), which served as a forum for consensus building, on the part of the Executive and the Legislative branches, on important bills on economic policy reform measures (4).
The daily brownouts that plagued the economy were also addressed through the enactment of policies that placed guaranteed rates. The economy during the first year of Ramos administration suffered from severe power shortage, with frequent brownouts, each lasting from 8 to 12 hours. To resolve this problem, the Electric Power Crisis Act was made into law together with the Build-Operate-Transfer Law. Twenty power plants were built because of these, and in effect, the administration was able to eliminate the power shortage problems in December 1993 and sustained economic growth for some time.[81]
The economy seemed to be all set for long-run growth, as shown by sustainable and promising growth rates from 1994 to 1997. However, the Asian Crisis contagion which started from Thailand and Korea started affecting the Philippines. This prompted the Philippine economy to plunge into continuous devaluation and very risky ventures, resulting in property busts and a negative growth rate. The remarkable feat of the administration, however, was that it was able to withstand the contagion effect of the Asian Crisis better than anybody else in the neighboring countries. Most important in the administration was that it made clear the important tenets of reform, which included economic liberalization, stronger institutional foundations for development, redistribution, and political reform.[82]
Perhaps some of the most important policies and breakthroughs of the administration are the Capital Account Liberalization and the subsequent commitments to free trade associations such as APEC, AFTA, GATT, and WTO. The liberalization and opening of the capital opening culminated in full-peso convertibility in 1992.[83] And then another breakthrough is again, the establishment of the Bangko Sentral ng Pilipinas, which also involved the reduction of debts in that the debts of the old central bank were taken off its books.
Estrada administration (1998–2001)[]
Although Estrada's administration had to endure the continued shocks of the Asian Crisis contagion, the administration was also characterized by the administration's economic mismanagement and "midnight cabinets." As if the pro-poor rhetoric, promises and drama were not really appalling enough, the administration also had "midnight cabinets composed of 'drinking buddies' influencing the decisions of the "daytime cabinet'".[84] Cronyism and other big issues caused the country's image of economic stability to change towards the worse. And instead of adjustments happening, further deterioration of the economy occurred. Targeted revenues were not reached, implementation of policies became very slow, and fiscal adjustments were not efficiently conceptualized and implemented. All those disasters caused by numerous mistakes were made worse by the sudden entrance of the Jueteng controversy, which gave rise to the succeeding EDSA Revolutions.
Despite all these controversies, the administration still had some meaningful and profound policies to applaud. The administration presents a reprise of the population policy, which involved the assisting of married couples to achieve their fertility goals, reduce unwanted fertility and match their unmet need for contraception. The administration also pushed for budget appropriations for family planning and contraceptives, an effort that was eventually stopped due to the fact that the church condemned it.[85] The administration was also able to implement a piece of its overall Poverty Alleviation Plan, which involved the delivery of social services, basic needs, and assistance to the poor families. The Estrada administration also had limited contributions to Agrarian Reform, perhaps spurred by the acknowledgement that indeed, Agrarian Reform can also address poverty and inequitable control over resources. In that regard, the administration establishes the program "Sustainable Agrarian Reform Communities-Technical Support to Agrarian and Rural Development".[86] As for regional development, however, the administration had no notable contributions or breakthroughs.
Macapagal-Arroyo administration (2001–2010)[]
The Arroyo administration, in an economical standpoint, was a period of good growth rates simultaneous with the US, due perhaps to the emergence of the Overseas Filipino workers (OFW) and the Business Process Outsourcing (BPO). The emergence of the OFW and the BPO improved the contributions of OFW remittances and investments to growth. In 2004, however, fiscal deficits grew and grew as tax collections fell, perhaps due to rampant and wide scale tax avoidance and tax evasion incidences. Fearing that a doomsday prophecy featuring the [Argentina default] in 2002 might come to fruition, perhaps due to the same sort of fiscal crisis, the administration pushed for the enactment of the 12% VAT and the E-VAT to increase tax revenue and address the large fiscal deficits. This boosted fiscal policy confidence and brought the economy back on track once again.
Soon afterwards, political instability afflicted the country and the economy anew with Abu Sayyaf terrors intensifying. The administration's Legitimacy Crisis also became a hot issue and threat to the authority of the Arroyo administration. Moreover, the Arroyo administration went through many raps and charges because of some controversial deals such as the NBN-ZTE Broadband Deal. Due however to the support of local leaders and the majority of the House of Representatives, political stability was restored and threats to the administration were quelled and subdued. Towards the end of the administration, high inflation rates for rice and oil in 2008 started to plague the country anew, and this led to another fiscal crisis, which actually came along with the major recession that the United States and the rest of the world were actually experiencing.
The important policies of the Arroyo administration highlighted the importance of regional development, tourism, and foreign investments into the country. Therefore, apart from the enactment and establishment of the E-VAT policy to address the worsening fiscal deficits, the administration also pushed for regional development studies in order to address certain regional issues such as disparities in regional per capita income and the effects of commercial communities on rural growth.[87] The administration also advocated for investments to improve tourism, especially in other unexplored regions that actually need development touches as well. To further improve tourism, the administration launched the policy touching on Holiday Economics, which involves the changing of days in which we would celebrate certain holidays. Indeed, through the Holiday Economics approach, investments and tourism really improved. As for investment, the Arroyo administration would frequently visit other countries to encourage foreign investment for the betterment of the Philippine economy and its development.
Benigno Aquino III administration (2010–2016)[]

The Philippines consistently coined as one of the newly industrialized countries has had a fair gain during the latter years under the Arroyo presidency to the current administration. The government managed foreign debts falling from 58% in 2008 to 47% of total government borrowings. According to the 2012 World Wealth Report, the Philippines was the fastest growing economy in the world in 2010 with a GDP growth of 7.3% driven by the growing business process outsourcing and overseas remittances.[88]
The country markedly slipped to 3.6% in 2011 after the government placed less emphasis on exports, as well as spending less on infrastructure. In addition, the disruption of the flow of imports for raw materials as a result from floods in Thailand and the tsunami in Japan affected the manufacturing sector in the same year. "The Philippines contributed more than $125 million as of end-2011 to the pool of money disbursed by the International Monetary Fund to help address the financial crisis confronting economies in Europe. This was according to the Bangko Sentral ng Pilipinas, which reported Tuesday that the Philippines, which enjoys growing foreign exchange reserves, has made available about $251.5 million to the IMF to finance the assistance program—the Financial Transactions Plan (FTP)—for crisis-stricken countries."[89]
The economy saw continuous real GDP growth of at least 5% since 2012. The Philippine Stock Exchange index ended 2012 with 5,812.73 points a 32.95% growth from the 4,371.96-finish in 2011.[90]
Macroeconomic trends[]

The Philippine economy has been growing steadily over decades and the International Monetary Fund in 2014 reported it as the 39th largest economy in the world. However, its growth has been behind that of many of its Asian neighbors, the so-called Asian Tigers, and it is not a part of the Group of 20 nations. Instead, it is grouped in a second tier for emerging markets or newly industrialized countries. Depending on the analyst, this second tier can go by the name the Next Eleven or the Tiger Cub Economies.
In 2012 and 2013, the Philippines posted high GDP growth rates, reaching 6.8% in 2012 and 7.2% in 2013,[91][92][93] the highest GDP growth rates in Asia for the first two quarters of 2013, followed by China and Indonesia.[94]
A chart of selected statistics showing trends in the gross domestic product of the Philippines using data taken from the International Monetary Fund.[95][96]
Indicates economic growth Indicates contraction / recession
| Year | GDP growth[a] | GDP in PHP Billion (current prices) |
GDP in USD Billion (current prices) |
GDP per capita in USD (current prices) |
GDP in USD Billion (PPP) |
GDP per capita in USD (PPP) |
Peso vs. Dollar Exchange Rate |
|---|---|---|---|---|---|---|---|
| 2021 | 6.50% |
||||||
| 2020* | −9.50% |
||||||
| 2019 | 6.00% |
||||||
| 2018 | 6.30% |
16,545 |
330.9 |
||||
| 2017 | 6.70% |
15,648.6 |
313.6 |
||||
| 2016 | 6.90% |
14,299.8 |
304.9 |
||||
| 2015[97] | 5.80% |
13,307.3 |
292.4 |
2,863 |
741.0 |
6,547 |
|
| 2014[97] | 6.10% |
12,645.3 |
284.8 |
2,844 |
642.8 |
6,924 |
|
| 2013[98] | 7.20% |
11,546.1 |
272.2 |
2,792 |
454.3 |
4,660 |
|
| 2012[99] | 6.80% |
10,564.9 |
250.2 |
2,611 |
419.6 |
4,380 |
|
| 2011 | 3.60% |
9,706.3 |
224.1 |
2,379 |
386.1 |
4,098 |
|
| 2010 | 7.63% |
9,003.5 |
199.6 |
2,155 |
365.3 |
3,945 |
|
| 2009 | 1.15% |
8,026.1 |
168.5 |
1,851 |
335.4 |
3,685 |
|
| 2008 | 4.15% |
7,720.9 |
173.6 |
1,919 |
329.0 |
3,636 |
|
| 2007 | 7.12% |
6,892.7 |
149.4 |
1,684 |
309.9 |
3,493 |
|
| 2006 | 5.24% |
6,271.2 |
122.2 |
1,405 |
283.5 |
3,255 |
|
| 2005 | 4.78% |
5,677.8 |
103.1 |
1,209 |
261.0 |
3,061 |
|
| 2004 | 6.70% |
5,120.4 |
91.4 |
1,093 |
242.7 |
2,905 |
|
| 2003 | 4.97% |
4,548.1 |
83.9 |
1,025 |
222.7 |
2,720 |
|
| 2002 | 3.65% |
4,198.3 |
81.4 |
1,014 |
207.8 |
2,591 |
|
| 2001 | 2.89% |
3,888.8 |
76.3 |
971 |
197.3 |
2,511 |
|
| 2000 | 4.41% |
3,580.7 |
81.0 |
1,053 |
187.5 |
2,437 |
|
| 1999 | 3.08% |
3,244.2 |
83.0 |
1,110 |
175.8 |
2,352 |
|
| 1998 | −0.58% |
2,952.8 |
73.8 |
1,009 |
168.1 |
2,297 |
|
| 1997 | 5.19% |
2,688.7 |
92.8 |
1,297 |
167.1 |
2,336 |
|
| 1996 | 5.85% |
2,406.4 |
93.5 |
1,336 |
156.1 |
2,232 |
|
| 1995 | 4.68% |
2,111.7 |
83.7 |
1,224 |
144.8 |
2,118 |
|
| 1994 | 4.39% |
1,875.7 |
71.0 |
1,052 |
135.5 |
2,007 |
|
| 1993 | 2.12% |
1,633.6 |
60.2 |
914 |
127.1 |
1,929 |
|
| 1992 | 0.34% |
1,497.5 |
58.7 |
912 |
121.8 |
1,891 |
|
| 1991 | −0.49% |
1,379.9 |
50.2 |
797 |
118.6 |
1,882 |
|
| 1990 | 3.04% |
1,190.5 |
48.9 |
796 |
115.2 |
1,873 |
|
| 1989 | 6.21% |
1,025.3 |
47.3 |
786 |
107.6 |
1,791 |
|
| 1988 | 6.75% |
885.5 |
42.0 |
715 |
97.6 |
1,663 |
|
| 1987 | 4.31% |
756.5 |
36.8 |
641 |
88.4 |
1,540 |
|
| 1986 | 3.42% |
674.6 |
33.1 |
591 |
82.4 |
1,471 |
|
| 1985 | −7.30% |
633.6 |
34.1 |
623 |
77.9 |
1,426 |
|
| 1984 | −7.31% |
581.1 |
34.8 |
652 |
81.6 |
1,530 |
|
| 1983 | 1.88% |
408.9 |
36.8 |
707 |
84.9 |
1,630 |
|
| 1982 | 3.62% |
351.4 |
41.1 |
810 |
80.1 |
1,578 |
|
| 1981 | 3.42% |
312.0 |
39.5 |
797 |
72.9 |
1,471 |
|
| 1980 | 5.15% |
270.1 |
35.9 |
744 |
64.4 |
1,334 |
|
| 1979 | 5.60% |
||||||
| 1978 | 5.20% |
||||||
| 1977 | 5.60% |
||||||
| 1976 | 8.00% |
||||||
| 1975 | 6.40% |
||||||
| 1974 | 5.00% |
||||||
| 1973 | 9.20% |
||||||
| 1972 | 4.80% |
||||||
| 1971 | 4.90% |
||||||
| 1970 | 4.60% |
||||||
- -as a result of shutdown of businesses imposed by the lockdowns to contain the COVID-19 pandemic.
Composition by sector[]
As a newly industrialized country, the Philippines is still an economy with a large agricultural sector; however, services have come to dominate the economy.[citation needed] Much of the industrial sector is based on processing and assembly operations in the manufacturing of electronics and other high-tech components, usually from foreign multinational corporations.
Filipinos who go abroad to work–-known as Overseas Filipino Workers or OFWs—are a significant contributor to the economy but are not reflected in the below sectoral discussion of the domestic economy. OFW remittances is also credited for the Philippines' recent economic growth resulting in investment status upgrades from credit ratings agencies such as the Fitch Group and Standard & Poor's.[102] In 1994, more than $2 billion USD worth of remittance from Overseas Filipinos were sent to the Philippines.[103] In 2012, Filipino Americans sent 43% of all remittances sent to the Philippines, totaling to US$10.6 billion.[104]
Agriculture[]


Agriculture employs 23% of the Filipino workforce as of 2021.[105] Agriculture accounts for 11% of Philippines GDP as of 2014.[106] The type of activity ranges from small subsistence farming and fishing to large commercial ventures with significant export focus.
The Philippines is the world's largest producer of coconuts producing 19,500,000 tons in 2009. Coconut production in the Philippines is generally concentrated in medium-sized farms.[107] The Philippines is also the world's second largest producer of pineapples, producing 2,730,000 metric tons in 2018.[108]
Rice production in the Philippines is important to the food supply in the country and economy. The Philippines is the 8th largest rice producer in the world, accounting for 2.8% of global rice production.[109] The Philippines was also the world's largest rice importer in 2010.[110] Rice is the most important food crop, a staple food in most of the country. It is produced extensively in Luzon (especially Central Luzon), Western Visayas, Southern Mindanao and Central Mindanao.
The Philippines is one of the largest producers of sugar in the world.[111] At least 17 provinces located in eight regions of the nation have grown sugarcane crops, of which the Negros Island Region accounts for half of the country's total production. As of Crop Year 2012–2013, 29 mills are operational divided as follows: 13 mills in Negros, 6 mills in Luzon, 4 mills in Panay, 3 mills in Eastern Visayas and 3 mills in Mindanao.[112] A range from 360,000 to 390,000 hectares are devoted to sugarcane production. The largest sugarcane areas are found in the Negros Island Region, which accounts for 51% of sugarcane areas planted. This is followed by Mindanao which accounts for 20%; Luzon by 17%; Panay by 07% and Eastern Visayas by 04%.[113]
Shipbuilding and repair[]
The Philippines is a major player in the global shipbuilding industry with shipyards in Subic, Cebu, General Santos City and Batangas.[114][115] It became the fourth largest shipbuilding nation in 2010.[116][117] Subic-made cargo vessels are now exported to countries where shipping operators are based. South Korea's Hanjin started production in Subic in 2007 of the 20 ships ordered by German and Greek shipping operators.[118] The country's shipyards are now building ships like bulk carriers, container ships and big passenger ferries. General Santos' shipyard is mainly for ship repair and maintenance.[119]
Being surrounded by waters, the country has abundant natural deep-sea ports ideal for development as production, construction and repair sites. On top of the current operating shipyards, two additional shipyards in Misamis Oriental and Cagayan province are being expanded to support future locators. It has a vast manpower pool of 60,000 certified welders that comprise the bulk of workers in shipbuilding.
In the ship repair sector, the Navotas complex in Metro Manila is expected to accommodate 96 vessels for repair.[120]
Automotive[]
The ABS used in Mercedes-Benz, BMW, and Volvo cars are made in the Philippines. Toyota,[121] Mitsubishi, Nissan and Honda are the most prominent automakers manufacturing cars in the country.[citation needed] Kia and Suzuki produce small cars in the country. Isuzu also produces SUVs in the country. Honda and Suzuki produce motorcycles in the country. A 2003 Canadian market research report predicted that further investments in this sector were expected to grow in the following years. Toyota sells the most vehicles in the country.[122] By 2011, China's Chery Automobile company is going to build their assembly plant in Laguna, that will serve and export cars to other countries in the region if monthly sales would reach 1,000 units.[123] Automotive sales in the Philippines moved up from 165,056 units in 2011 to over 180,000 in 2012. Japan's automotive manufacturing giant Mitsubishi Motors has announced that it will be expanding its operations in the Philippines.[124]
Aerospace[]
Aerospace products in the Philippines are mainly for the export market and include manufacturing parts for aircraft built by both Boeing and Airbus. Moog is the biggest aerospace manufacturer with base in Baguio in the Cordillera region. The company produces aircraft actuators in their manufacturing facility.
In 2011, the total export output of aerospace products in the Philippines reached US$3 billion.[125]
Electronics[]
A Texas Instruments plant in Baguio has been operating for 20 years and is the largest producer of DSP chips in the world.[126] Texas Instruments' Baguio plant produces all the chips used in Nokia cell phones and 80% of chips used in Ericsson cell phones in the world.[127] Until 2005, Toshiba laptops were produced in Santa Rosa, Laguna. Presently the Philippine plant's focus is in the production of hard disk drives. Printer manufacturer Lexmark has a factory in Mactan in the Cebu region. Electronics and other light industries are concentrated in Laguna, Cavite, Batangas and other CALABARZON provinces with sizable numbers found in Southern Philippines that account for most of the country's export.
Mining and extraction[]

The country is rich in mineral and geothermal energy resources. In 2003, it produced 1931 MW of electricity from geothermal sources (27% of total electricity production), second only to the United States,[128] and a recent discovery of natural gas reserves in the Malampaya oil fields off the island of Palawan is already being used to generate electricity in three gas-powered plants. Philippine gold, nickel, copper, palladium and chromite deposits are among the largest in the world. Other important minerals include silver, coal, gypsum, and sulphur. Significant deposits of clay, limestone, marble, silica, and phosphate exist.
About 60% of total mining production are accounted for by non-metallic minerals, which contributed substantially to the industry's steady output growth between 1993 and 1998, with the value of production growing 58%. In 1999, however, mineral production declined 16% to $793 million.[citation needed] Mineral exports have generally slowed since 1996. Led by copper cathodes, Philippine mineral exports amounted to $650 million in 2000, barely up from 1999 levels. Low metal prices, high production costs, lack of investment in infrastructure, and a challenge to the new mining law have contributed to the mining industry's overall decline.[citation needed]
The industry rebounded starting in late 2004 when the Supreme Court upheld the constitutionality of an important law permitting foreign ownership of Philippines mining companies.[129] However, the DENR has yet to approve the revised Department Administrative Order (DAO) that will provide the Implementing Rules and Regulations of the Financial and Technical Assistance Agreement (FTAA), the specific part of the 1994 Mining Act that allows 100% foreign ownership of Philippines mines.[citation needed]
In 2019, the country was the 2nd largest world producer of nickel[130] and the 4th largest world producer of cobalt.[131]
Renewable energy resources[]

The Philippines have a significant potential in solar energy, however, as of 2021 most of the domestically produced electricity is still based on fossil fuel resources, coal in particular.[132] The future development of solar power and the phase-out of fossil fuels will depend on strong and effective renewable energy governance, improving regulatory and fiscal policies, facilitating market entry for renewable energy investors and active cooperation with international organizations.[133]
Offshoring and outsourcing[]

In 2008, the Philippines has surpassed India as the world leader in business process outsourcing.[134][135] The majority of the top ten BPO firms of the United States operate in the Philippines.[136] The industry generated 100,000 jobs, and total revenues were placed at $960 million for 2005. In 2012, BPO sector employment ballooned to over 700,000 people and is contributing to a growing middle class. BPO facilities are concentrated in IT parks and centers in Economic Zones across the Philippines.[137] BPO facilities are located mainly in Metro Manila and Cebu City although other regional areas such as Baguio, Bacolod, Cagayan de Oro, Clark Freeport Zone, Dagupan, Davao City, Dumaguete, Lipa, Iloilo City, and Naga City, Camarines Sur are now being promoted and developed for BPO operations.
Call centers began in the Philippines as plain providers of email response and managing services and is now a major source of employment. Call center services include customer relations, ranging from travel services, technical support, education, customer care, financial services, online business to customer support, and online business-to-business support. Business process outsourcing (BPO) is regarded as one of the fastest growing industries in the world. The Philippines is also considered as a location of choice due to its many outsourcing benefits such as less expensive operational and labor costs, the high proficiency in spoken English of a significant number of its people, and a highly educated labor pool. In 2011, the business process outsourcing industry in the Philippines generated 700 thousand jobs[138] and some US$11 billion in revenue,[139] 24 percent higher than 2010. By 2016, the industry is projected to reach US$27.4 billion in revenue with employment generation to almost double at 1.3 million workers.[140]
BPOs and the call center industry in general are also credited for the Philippines' recent economic growth resulting in investment status upgrades from credit ratings agencies such as Fitch and S&P.[102]
With the Philippines being the 34th largest economy in the world, the country continues to be a promising prospect for the BPO Industry. Just in August 2014, the Philippines hit an all-time high for employment in the BPO industry. From 101,000 workers in 2004, the labor force in the industry has grown to over 930,000 in just the first quarter of 2014.[141]
Growth in the BPO industry continues to show significant improvements with an average annual expansion rate of 20%. Figures have shown that from $1.3 Billion in 2004, export revenues from the BPO sector has increased to over $13.1 Billion in 2013. The IT and Business Process Association of the Philippines (IBPAP) also projects that the sector will have an expected total revenue of $25 Billion in 2016.[141] IBPAP projects that the industry will employ 1.8 million workers and generate US$38.9 billion of revenue by 2022.[142]
This growth in the industry is further promoted by the Philippine government. The industry is highlighted by the Philippines Development Plan as among the 10 high potential and priority development areas. To further entice investors, government programs include different incentives such as tax holidays, tax exemptions, and simplified export and import procedures. Additionally, training is also available for BPO applicants.[141]
Tourism[]

Tourism is an important sector for Philippine economy. In 2019, the travel and tourism industry contributed 12.7% to the country's GDP.[143] Philippines is an archipelagic country composed of 7,641 islands with 81 provinces divided in 17 regions. The country is known for having its rich biodiversity as its main tourist attraction.[144] Its beaches, heritage towns and monuments, mountains, rainforests, islands and diving spots are among the country's most popular tourist destinations. The country's rich historical and cultural heritage, including its festivals and indigenous traditions, are also one of the attractions of Philippines. Popular destinations among tourists are Cebu, Boracay, Palawan, Siargao, and many more. However, despite these large potential, the tourist industry of the Philippines has lagged behind its Southeast Asian fellows like Thailand, Vietnam, Malaysia, Singapore and Indonesia, due to political and social problems.[145]
As of 2015, 4.99 million Filipinos have been employed in the tourism sector and the government collected P227.62 billion pesos from foreign tourists, almost 25% of which came from Boracay. The country attracted a total of 5,360,682 foreign visitors in 2015 through its successful tourism campaign of "It's More Fun in the Philippines". In 2018, foreign arrivals peaked at 8,168,467.[146]
Philippines has garnered numerous titles related to tourism, namely, the traditional capital of the world's festivities, the capital of the western Pacific, the centre of Hispanic Asia, the Pearl of the Orient Seas, center of the Coral Triangle, and the capital of fun. The country is also a biodiversity hotspot, having the world's highest endemism rate for bird species, and one of the highest for mammals and flora. It is also the largest bastion for Roman Catholicism in all of Asia. The country is also home to one of the New7Wonders of Nature, the Puerto Princesa Subterranean River National Park, and one of the New7Wonders Cities, the Heritage City of Vigan. It is also home to six UNESCO world heritage sites scattered in nine different locations, three UNESCO biosphere reserves, three UNESCO intangible cultural heritage, four UNESCO memory of the world documentary heritage, one UNESCO creative city, two UNESCO world heritage cities, seven Ramsar wetland sites, and eight ASEAN Heritage Parks. More than 60% of Filipinos can understand and speak English, as many are multilingual.[146]Regional accounts[]
According to the Philippine Statistics Authority (PSA), gross regional domestic product (GRDP) is GDP measured at regional levels. Figures below are for the year 2019.
| Region | GRDP | Agriculture | Industry | Services | per capita GRDP | ||||
|---|---|---|---|---|---|---|---|---|---|
| # | % | # | % | # | % | # | % | ||
| Metro Manila | 6,309,290,637 | 32.33 | 442,597 | 0.03 | 1,230,125,141 | 20.89 | 5,078,722,899 | 42.65 | 462,779 |
| Cordillera | 322,093,866 | 1.65 | 27,045,337 | 1.57 | 77,990,725 | 1.32 | 217,057,804 | 1.82 | 179,752 |
| Ilocos Region | 629,772,047 | 3.23 | 104,471,256 | 6.07 | 192,218,332 | 3.26 | 333,082,459 | 2.80 | 120,512 |
| Cagayan Valley | 397,625,523 | 2.04 | 103,563,850 | 6.01 | 115,614,177 | 1.96 | 178,447,496 | 1.50 | 109,851 |
| Central Luzon | 2,177,046,900 | 11.15 | 231,995,441 | 13.47 | 950,969,430 | 16.15 | 994,082,029 | 8.35 | 179,840 |
| Calabarzon | 2,861,724,791 | 14.66 | 154,312,287 | 8.96 | 1,445,358,775 | 24.55 | 1,262,053,729 | 10.60 | 181,781 |
| Mimaropa | 377,014,287 | 1.93 | 64,116,478 | 3.72 | 125,427,469 | 2.13 | 187,470,340 | 1.57 | 120,240 |
| Bicol Region | 560,314,934 | 2.87 | 85,820,150 | 4.98 | 202,529,524 | 3.44 | 271,965,260 | 2.28 | 92,288 |
| Western Visayas | 916,379,059 | 4.70 | 144,256,702 | 8.38 | 194,479,931 | 3.30 | 577,642,425 | 4.85 | 116,946 |
| Central Visayas | 1,266,701,029 | 6.49 | 79,478,668 | 4.61 | 342,195,668 | 5.81 | 845,026,693 | 7.10 | 161,289 |
| Eastern Visayas | 465,694,628 | 2.39 | 61,219,158 | 3.55 | 181,914,842 | 3.09 | 222,560,628 | 1.87 | 99,492 |
| Zamboanga Peninsula | 397,206,561 | 2.04 | 74,695,151 | 4.34 | 110,467,600 | 1.88 | 212,043,810 | 1.78 | 105,798 |
| Northern Mindanao | 882,204,432 | 4.52 | 182,955,342 | 10.62 | 208,580,211 | 3.54 | 490,668,878 | 4.12 | 177,998 |
| Davao Region | 922,094,956 | 4.72 | 149,438,384 | 8.68 | 233,452,398 | 3.97 | 539,204,175 | 4.53 | 176,983 |
| Soccsksargen | 470,422,524 | 2.41 | 130,802,115 | 7.60 | 103,321,113 | 1.75 | 236,299,297 | 1.98 | 108,561 |
| Caraga | 306,308,490 | 1.57 | 39,908,783 | 2.32 | 109,464,024 | 1.86 | 156,935,683 | 1.32 | 112,489 |
| Bangsamoro | 254,523,606 | 1.30 | 87,689,432 | 5.09 | 63,191,105 | 1.07 | 103,643,069 | 0.87 | 55,151 |
| Total | 19,516,418,271 | 100.00 | 1,722,211,131 | 100.00 | 5,887,300,465 | 100.00 | 11,906,906,674 | 100.00 | 181,907 |
| Note: Data as of October 21, 2020 Source: Philippine Statistics Authority OpenSTAT website | |||||||||
International comparisons[]
| Organization | Report | As of | Change from previous | Ranking |
|---|---|---|---|---|
| Fraser Institute | Economic Freedom of the World | 2014 | 51 out of 144[147] | |
| International Monetary Fund | Gross Domestic Product (PPP) | 2016 | 29th[148] | |
| International Monetary Fund | Gross domestic product (nominal) | 2016 | 33rd[149] | |
| International Monetary Fund | GDP per capita (PPP) | 2015 | 118th[150] | |
| International Monetary Fund | GDP per capita (nominal) | 2015 | 123rd[151] | |
| International Monetary Fund | Foreign exchange reserves | 2016 | 26th[152] | |
| The Heritage Foundation/The Wall Street Journal | Index of Economic Freedom | 2016 | 76 out of 178[153] | |
| The World Factbook | External debt | 2014 | 57th[154] | |
| United Nations | Human Development Index | 2014 | 117 out of 187[155] | |
| World Economic Forum | Global Competitiveness | 2018–2019 | 56 out of 148[156] | |
| World Economic Forum | Global Enabling Trade Report | 2014 | 64 out of 138[157] | |
| World Economic Forum | Financial Development Index | 2012 | 49 out of 60[158] | |
| World Bank | Ease of doing business index | 2014 | 95 out of 183[159] |
Statistics[]
| Economic growth[160][161][162] | ||
|---|---|---|
| Year | % GDP | % GNI |
| 1999 | 3.1 | 2.7 |
| 2000 | 4.4 | 7.7 |
| 2001 | 2.9 | 3.6 |
| 2002 | 3.6 | 4.1 |
| 2003 | 5.0 | 8.5 |
| 2004 | 6.7 | 7.1 |
| 2005 | 4.8 | 7.0 |
| 2006 | 5.2 | 5.0 |
| 2007 | 7.1 | 6.2 |
| 2008 | 4.2 | 5.0 |
| 2009 | 1.1 | 6.1 |
| 2010 | 7.6 | 8.2 |
| 2011 | 3.7 | 2.6 |
| 2012[97] | 6.8 | 6.5 |
| 2013[97] | 7.2 | 7.5 |
| 2014[97] | 6.1 | 5.8 |
| 2015[97] | 5.8 | 5.4 |
| 2016 | ||
| 2017[163] | 6.7 | 6.5 |
| * Computed at Constant 2000 Prices | ||
| ** Source: NEDA and NSCB | ||


Most of the following statistics are sourced from the International Monetary Fund – Philippines (as of 2012; figures are in US dollars unless otherwise indicated).
- GDP – purchasing power parity: $1.12 trillion (2021 est.)
- GDP – real growth rate: 4.5% (2021 est.)
- GDP per capita purchasing power parity: $9,271 (2021 est.)
- GDP nominal: $402 billion (2021 est.)
- GDP per capita: $3,601 (2021 est.)
- GDP – composition by sector:
- Economy by Sector (2018)
- Agriculture: 7.4%
- Industry: 34%
- Services: 58.6%
- Economy by Sector (2018)
- Population below poverty line: less than $1.25 / 10.41% (2009)
less than $2 / 25.2% (2012),[164] 26.3% (2009),[164] 32.9% (2006 est.)[19] - Household income or consumption by percentage share:
- lowest 10%: 2.9%
- highest 10%: 30.5% (2012 est.)[19]
- Inflation rate (consumer prices): 4.5% (April 2021),1.4% (2015 est.), 4.1% (2014 est.), 5.3% (2011 est.),[19] 3.5% (September 2010)[165]
- Labor force: 41.37 million (2015 est.)[19]
- Labor force by occupation:
- Labor Force by Occupation Sector (2019 est.)
- services: 58.0%
- agriculture: 22.9%
- industry: 19.1%
- Labor Force by Occupation Sector (2019 est.)
- Unemployment rate: 7.1% (March 2021 est.), 6.3% (2015 est.), 6.8% (2014 est.)[19] 7.5% (April 2013),[166] 6.9% (April 2012),[166] 7.2% (April 2011)[167]
- Budget:
- Foreign reserves: US$85.761 billion (January 2013)[169]
- Industries: electronics assembly, shipbuilding, garments, footwear, pharmaceuticals, chemicals, wood products, food processing, petroleum refining, fishing
- Industrial production growth rate: 6% (2015 est.)[19]
- Electricity – production: 75.27 billion kWh (2013 est.)[19]
- Electricity – consumption: 75.27 billion kWh (2013 est.)[19]
- Electricity – exports: 0 kWh (2013)[19]
- Electricity – imports: 0 kWh (2013)[19]
- Agriculture – products: sugarcane, coconuts, rice, corn, bananas, cassavas, pineapples, mangoes; pork, eggs, beef; fish[19]

- Exports: $58.65 billion (Jan–Sept 2015 est.) $62.1 billion (2014) $53.98 billion (2013)[170] $54.17 billion (2011 est.); $69.46 billion (2010 est.)[19][171]
- Exports – commodities: semiconductors and electronic products, transport equipment, garments, copper products, petroleum products, coconut oil, fruits[19]
- Exports – partners: Japan 21%, United States 15%, China 11%, Hong Kong 10.6%, Singapore 6.2%, Germany 4.5%, South Korea 4.3% (2015)[19]
- Imports: $66.69 billion (2015), $65.4 billion (2014), $61.831 billion (2013),[170] $68.84 billion (2011 est.)[19]
- Imports – commodities: electronic products, mineral fuels, machinery and transport equipment, iron and steel, textile fabrics, grains, chemicals, plastic[19]
- Imports – partners: China 16.2%, United States 10.8%, Japan 9.6%, Singapore 7%, South Korea 6.5%, Thailand 6.4%, Malaysia 4.7, Indonesia 4.4% (2015)[19]
- Debt – external: $75.61 billion (September 30, 2015 est.)[19]
- Currency: 1 Philippine peso (₱) = 100 centavos
- Exchange rates: Philippine pesos (PHP) per US dollar – 50.4 (2017 est), 47.493 (2016 est), 47.493 (2015 est), 45.503 (2014 est), 44.395 (2013 est),[19] 42.43 (2012 avg), 43.31 (2011 avg), 45.11 (2010 avg), 47.637 (2009 avg), 44.475 (2008 avg), 46.148 (2007 avg), 51.314 (2006 avg), 55.085 (2005 avg)[172]
Government budget[]
The national government budget for 2021 has set the following budget allocations:[173]
| Budget allocation | Billions of Pesos (Php) |
Billions of US dollars (USD) |
% of GDP |
|---|---|---|---|
| Department of Education | 15.6 | 16.7 | |
| Department of Public Works and Highways | 14.8 | 15.4 | |
| Department of the Interior and Local Government | 5.18 | 5.5 | |
| Department of Health | 4.37 | ||
| Department of National Defense | 4.28 | ||
| Department of Social Welfare and Development | 3.68 | ||
| Department of Transportation | 1.82 | ||
| Department of Agriculture | 1.47 | ||
| Judiciary | 0.942 | ||
| Department of Labor and Employment | 0.772 |
See also[]
- Bamboo network
- Emerging markets
- List of companies of the Philippines
- Newly industrialized country
- Tiger Cub Economies
References[]
- ^ "World Economic Outlook Database, April 2019". IMF.org. International Monetary Fund. Retrieved September 29, 2019.
- ^ "World Bank Country and Lending Groups". datahelpdesk.worldbank.org. World Bank. Retrieved September 29, 2019.
- ^ "Archived copy". Archived from the original on February 3, 2021. Retrieved February 3, 2021.CS1 maint: archived copy as title (link)
- ^ Jump up to: a b c d e "World Economic Outlook Database, October 2020". IMF.org. International Monetary Fund. Retrieved October 19, 2020.
- ^ "Archived copy". Archived from the original on April 21, 2020. Retrieved April 21, 2020.CS1 maint: archived copy as title (link)
- ^ "Global Economic Prospects, June 2020". openknowledge.worldbank.org. World Bank. p. 74. Retrieved June 10, 2020.
- ^ "Key Indicators". DTI. Retrieved August 26, 2018.
- ^ "Poverty headcount ratio at national poverty lines (% of population)". data.worldbank.org. World Bank. Retrieved November 3, 2019.
- ^ "Poverty headcount ratio at $3.20 a day (2011 PPP) (% of population)". data.worldbank.org. World Bank. Retrieved November 3, 2019.
- ^ "Annual Family Income is Estimated at PhP 313 Thousand, on Average, In 2018". psa.gov.ph. Philippine Statistics Authority. Retrieved December 13, 2019.
- ^ "Human Development Index (HDI)". hdr.undp.org. HDRO (Human Development Report Office) United Nations Development Programme. Retrieved December 11, 2019.
- ^ "Inequality-adjusted HDI (IHDI)". hdr.undp.org. UNDP. Retrieved May 22, 2020.
- ^ Jump up to: a b c d e f g "EAST ASIA/SOUTHEAST ASIA :: PHILIPPINES". CIA.gov. Central Intelligence Agency. Retrieved April 27, 2019.
- ^ "Employment to population ratio, 15+, total (%) (national estimate) – Philippines". data.worldbank.org. World Bank. Retrieved September 29, 2019.
- ^ "Philippine Statistics Authority". Retrieved December 20, 2019.
- ^ "Manufacturing" (PDF). Archived from the original (PDF) on April 14, 2016. Retrieved April 8, 2016.
- ^ "Philippines climbs to 95th spot in World Bank's 'Doing Business' rankings". Philstar. Retrieved November 3, 2019.
- ^ Jump up to: a b https://oec.world/en/profile/country/phl
- ^ Jump up to: a b c d e f g h i j k l m n o p q r s t u v w CIA World Factbook, Philippines, Retrieved May 15, 2009.
- ^ Daniel Workman (March 27, 2021). "Philippines Top Trading Partners".
- ^ "PH foreign debt falls to $72.36B in Q3 – BSP – The Manila Times Online". December 18, 2017. Archived from the original on December 28, 2017. Retrieved December 27, 2017.
- ^ "Debt-to-GDP ratio slides to 41.7% in Q3 — DOF". Archived from the original on November 22, 2017. Retrieved November 20, 2017.
- ^ "NEDA: Foreign aid releases slightly increased in 2011 | Inquirer Business". Business.inquirer.net. March 5, 2012. Retrieved October 12, 2012.
- ^ "Sovereigns rating list". Standard & Poor's. Archived from the original on September 3, 2014. Retrieved May 8, 2014.
- ^ "S&P raises Philippine credit outlook". Philippine Star Business. April 28, 2018.
- ^ "Rating Action: Moody's upgrades Philippines to Baa2, outlook stable". Moody's Investors Service. December 11, 2014. Retrieved December 12, 2014.
- ^ "Fitch Revises Philippines' Outlook to Positive; Affirms at 'BBB'". Fitch Ratings, Inc. Fitch Ratings – Hong Kong. Retrieved February 11, 2020.
- ^ "Fitch Revises the Philippines' Outlook to Positive; Affirms at 'BBB'". Bloomberg. Bloomberg. December 11, 2017. Retrieved December 11, 2017.
- ^ "GROSS INTERNATIONAL RESERVES". bsp.gov.ph/statistics/sdds/table12.htm.
- ^ "MSN NEWS".
- ^ "Report for Selected Countries and Subjects". imf.org.
- ^ Martin, Will. "RANKED: These will be the 32 most powerful economies in the world by 2050". Business Insider. Retrieved February 8, 2020.
- ^ "PHL economy projected as 12th biggest by 2050 – HSBC". BusinessWorld.
- ^ CHINESE TRADE IN PRE-SPANISH PHILIPPINES: CREDIT, HOSTAGE AND RAID REGIMES By Tina S. ClementeAsian Center, University of the Philippines-Diliman (Jati, Volume 17, December 2012, 191-206)
- ^ Dery, Luis Camara (2001). A History of the Inarticulate. Quezon City: New Day Publishers. ISBN 978-971-10-1069-0.
- ^ From the mountains to the seas Archived May 21, 2009, at the Wayback Machine. Mallari, Perry Gil S. The Manila Times. January 18, 2009.
- ^ Jump up to: a b c d Ancient Philippine Civilization. Accessed January 7, 2013.(archived from the original on December 1, 2007)[unreliable source?]
- ^ Felix Regalado and Quentin B. Franco, History of Panay (Iloilo City, Central Philippines University: 1973) ed., Eliza B. Grimo, p. 78.
- ^ The Cultural Influences of India, China, Arabia, and Japan – Philippine Almanac Archived July 1, 2012, at the Wayback Machine
- ^ Cebu, a Port City in Prehistoric and in Present Times. Accessed September 5, 2008.
- ^ Lucoes warriors aided the Burmese king in his invasion of Siam in 1547 AD. At the same time, Lusung warriors fought alongside the Siamese king and faced the same elephant army of the Burmese king in the defence of the Siamese capital at Ayuthaya. SOURCE: Ibidem, page 195.
- ^ The former sultan of Malacca decided to retake his city from the Portuguese with a fleet of ships from Lusung in 1525 AD. SOURCE: Barros, Joao de, Decada terciera de Asia de Ioano de Barros dos feitos que os Portugueses fezarao no descubrimiento dos mares e terras de Oriente [1628], Lisbon, 1777, courtesy of William Henry Scott, Barangay: Sixteenth-Century Philippine Culture and Society, Quezon City: Ateneo de Manila University Press, 1994, page 194.
- ^ Pigafetta, Antonio (1969) [1524]. "First voyage round the world". Translated by J.A. Robertson. Manila: Filipiniana Book Guild. Cite journal requires
|journal=(help) - ^ Pires, Tomé (1944). A suma oriental de Tomé Pires e o livro de Francisco Rodriguez: Leitura e notas de Armando Cortesão [1512 – 1515] (in Portuguese). Translated by Armando Cortesao. Cambridge: Hakluyt Society.
- ^ Lach, Donald Frederick (1994). "Chapter 8: The Philippine Islands". Asia in the Making of Europe. Chicago: University of Chicago Press. ISBN 978-0-226-46732-0.
- ^ Reid, Anthony (1995). "Continuity and Change in the Austronesian Transition to Islam and Christianity". In Peter Bellwood; James J. Fox; Darrell Tryon (eds.). The Austronesians: Historical and comparative perspectives. Canberra: Department of Anthropology, The Australian National University. Archived from the original on September 2, 2007. Retrieved November 23, 2018.
- ^ Turnbull, C.M. (1977). A History of Singapore: 1819–1975. Kuala Lumpur: Oxford University Press. ISBN 978-0-19-580354-9.
- ^ Antony, Robert J. Elusive Pirates, Pervasive Smugglers: Violence and Clandestine Trade in the Greater China Seas. Hong Kong: Hong Kong University Press, 2010. Print, 76.
- ^ Junker, Laura L. Raiding, Trading, and Feasting: The Political Economy of Philippine Chiefdoms. Honolulu: University of Hawaiì Press, 1999.
- ^ Wilkinson, R J. An Abridged Malay-English Dictionary (romanised). London: Macmillan and Co, 1948. Print, 291.
- ^ "Forced Migration in the Spanish Pacific World" By Eva Maria Mehl, page 235.
- ^ Letter from Fajardo to Felipe III From Manila, August 15 1620.(From the Spanish Archives of the Indies) ("The infantry does not amount to two hundred men, in three companies. If these men were that number, and Spaniards, it would not be so bad; but, although I have not seen them, because they have not yet arrived here, I am told that they are, as at other times, for the most part boys, mestizos, and mulattoes, with some Indians (Native Americans). There is no little cause for regret in the great sums that reënforcements of such men waste for, and cost, your Majesty. I cannot see what betterment there will be until your Majesty shall provide it, since I do not think, that more can be done in Nueva Spaña, although the viceroy must be endeavoring to do so, as he is ordered.")
- ^ 1996. “Silk for Silver: Manila-Macao Trade in the 17th Century.” Philippine Studies 44, 1:52–68.
- ^ Chuan, Hang-sheng. 2001. “The Chinese Silk Trade with Spanish-America from the Late Ming Period to the Mid-Ch’ing Period.” In Studia Asiatica Essays in Asian Studies in Felicitation to the Seventy-fifth Anniversary of Professor Ch’en Shouyi, ed. Laurence G. Thompson, 99–117. San Francisco: Chinese Materials Center.
- ^ Eang, Cheong Weng (1970). "Changing the Rules of the Game (The India-Manila Trade: 1785–1809)1". Journal of Southeast Asian Studies. 1 (2): 1–19. doi:10.1017/S002246340002021X. ISSN 1474-0680.
- ^ NationMaster (2010). "GDP per capita in 1900 by country. Definition, graph and map". Retrieved December 12, 2010.
- ^ Hooley, Richard, 2005. "American economic policy in the Philippines, 1902–1940: Exploring a dark age in colonial statistics," Journal of Asian Economics, Elsevier, vol. 16(3), page 465, June.
- ^ Hooley, Richard, 2005. "American economic policy in the Philippines, 1902–1940: Exploring a dark age in colonial statistics," Journal of Asian Economics, Elsevier, vol. 16(3), page 467, June.
- ^ Hooley, Richard, 2005. "American economic policy in the Philippines, 1902–1940: Exploring a dark age in colonial statistics," Journal of Asian Economics, Elsevier, vol. 16(3), page 475, June.
- ^ Hooley, Richard, 2005. "American economic policy in the Philippines, 1902–1940: Exploring a dark age in colonial statistics," Journal of Asian Economics, Elsevier, vol. 16(3), page 479, June.
- ^ Jump up to: a b Hooley, Richard, 2005. "American economic policy in the Philippines, 1902–1940: Exploring a dark age in colonial statistics," Journal of Asian Economics, Elsevier, vol. 16(3), page 477, June.
- ^ Kasaysayan: History of the Filipino People, Volume 7. Reader's Digest. 1990.
- ^ Agoncillo, Teodoro A. & Guerrero, Milagros C., History of the Filipino People, 1986, R.P. Garcia Publishing Company, Quezon City, Philippines
- ^ Ocampo, Ambeth (2010). Looking Back 3: Death by Garrote. Anvil Publishing, Inc. pp. 22–25.
- ^ Hartendorp, A. (1958) History of Industry and Trade of the Philippines, Manila: American Chamber of Commerce on the Philippines, Inc.
- ^ History of the Development Bank of the Philippines, About DBP accessed on July 2, 2015
- ^ Blue Book of the First Year of the Republic, Manila: Bureau of Printing, 1947, p. 27
- ^ "Creating a Central Bank for the Philippines", Bangko Sentral ng Pilipinas website, accessed on July 2, 2015
- ^ Gleeck, Lewis, The Third Republic, New Day Publishers, Quezon City,1993, p.47
- ^ Leclerc, Grégoire and Hall, Charles A. S., Making World Development Work: Scientific Alternatives to Neoclassical Economic Theory, (New Mexico: University of New Mexico Press, 2007)
- ^ Castro, Pacifico A., Diplomatic Agenda of the Philippine Presidents, Foreign Service Institute, Manila, 1985, p. 1.
- ^ Carlos P. Garcia, "Third State of the Nation Address," January 25, 1960, Official Gazette, January 25, 1960, accessed on July 2, 2015
- ^ Abinales, Patricio N., Amoroso, Donna J., State and Society in the Philippines. Maryland: Rowman & Little Publishers, Inc., 2005. p. 182
- ^ McFerson, Hazel M. Mixed Blessing: The Impact of the American Colonial Experience on Politics and Society in the Philippines. Connecticut: Greenwood Press, 2002., p. 227
- ^ Cooley, Alexander, Base Politics: Dramatic Change and the U.S. Military Overseas, NY: Cornell University Press, 2008, p. 68
- ^ "History: Milestones in Corporate Existence", Landbank web site, accessed on July 2, 2015,
- ^ Hedman, Eva-Lotta (November 30, 2005). In the Name of Civil Society: From Free Election Movements to People Power in the Philippines. University of Hawaii Press. p. 23. ISBN 9780824829216.
- ^ Dacanay, Barbara Mae Naredo (February 26, 2020). "50 years later, First Quarter Storm survivors recall those first three months of the 70s". ABS-CBN News. Retrieved August 11, 2021.
- ^ Jump up to: a b c De Dios, Emmanuel (1984). An Analysis of the Philippine Economic Crisis. Diliman, Q.C.: University of the Philippines Press.
- ^ Balisacan and Hill, The Philippine Economy, p. 106
- ^ Canlas, pp. 4–5
- ^ Balisacan and Hill, The Philippine Economy, pp. 57–59
- ^ Balisacan and Hill, The Philippine Economy, p. 21
- ^ Balisacan and Hill, The Philippine Economy, p. 19
- ^ Balisacan and Hill, The Philippine Economy, p. 299
- ^ Villegas, pp. 646–647
- ^ Balisacan and Hill, The Dynamics, p. 378
- ^ "Philippines, 6th fastest growing in the world: wealth report". Rappler. August 21, 2012. Retrieved August 21, 2012.
- ^ "Philippines contributed $125M to IMF as of end-'11". Philippine Daily Inquirer. February 22, 2012. Retrieved February 22, 2012.
- ^ "Philippines: Economic growth". TheGlobalEconomy.com. 2017. Retrieved November 29, 2017.
- ^ "Philippine Economy Grew by 7.2 percent in 2013". National Statistical Coordination Board. Archived from the original on March 12, 2014. Retrieved March 12, 2014.
- ^ "Philippine economy grows a stunning 7.8%". Asia News Network. Archived from the original on December 4, 2013. Retrieved June 6, 2013.
- ^ "2012 PH GDP growth revised to 6.8 pct". ABS-CBN News. Retrieved June 10, 2013.
- ^ "Philippines is fastest growing Asian country for first quarter of 2013". Inquirer News. Retrieved June 10, 2013.
- ^ Jump up to: a b International Monetary Fund. (April 2012). World Economic Outlook Data, By Country – Philippines: [selected annual data for 1980–2017]. Retrieved 2012-06-23 from the World Economic Outlook Database.
- ^ International Monetary Fund. (April 2010). "World Economic Outlook (WEO) Database April 2010 – Report for Selected Countries and Subjects – Philippines and United States".
- ^ Jump up to: a b c d e f "National Statistical Coordination Board". Philippine Statistics Authority. Archived from the original on November 13, 2012.
- ^ "Report for Selected Countries and Subjects". Retrieved March 3, 2015.
- ^ "Report for Selected Countries and Subjects". Imf.org. April 16, 2013. Retrieved April 19, 2013.
- ^ International Monetary Fund. (October 2010). The Philippine Stock Exchange, It is one of the oldest stock exchanges in Southeast Asia, having been in continuous operation since its inception in 1927. It currently maintains two trading floors, one at the Ayala Tower One in the Makati Central Business District, and one at its headquarters in Pasig. The PSE is composed of a 15-man Board of Directors, chaired by Jose T. Pardo. World Economic Outlook Data, By Country – Philippines: [selected annual data for 1980–2015]. Retrieved 2011-01-31 from the World Economic Outlook Database.
- ^ International Monetary Fund. (April 2002). "The World Economic Outlook (WEO) Database April 2002 – Real Gross Domestic Product (annual percent change) – All countries".
- ^ Jump up to: a b King del Rosario. "MBA Buzz: More Funds in the Philippines". Archived from the original on April 7, 2014. Retrieved June 11, 2013.
- ^ Kevin Starr (June 22, 2011). Coast of Dreams. Knopf Doubleday Publishing Group. p. 159. ISBN 978-0-307-79526-7.
- ^ Drew Desilver (November 13, 2013). "More than 3.4M Americans trace their ancestry to the Philippines". Fact Tank. Pew Research Center. Retrieved December 19, 2014.
- ^ "Employment in agriculture (% of total employment)". Retrieved March 3, 2015.
- ^ "Agriculture, value added (% of GDP)". Retrieved March 3, 2015.
- ^ Hayami, Yūjirō; Quisumbing, Maria Agnes R.; Adriano, Lourdes S. (1990). Toward an alternative land reform paradigm: a Philippine perspective. Ateneo de Manila University Press. p. 108. ISBN 978-971-11-3096-1. Retrieved November 15, 2011.
- ^ "World pineapple production by Country". Retrieved September 27, 2020.
- ^ Faostat
- ^ "Factbox – Top 10 rice exporting, importing countries". Reuters. January 28, 2011. Retrieved March 30, 2011.
- ^ "ESS Website ESS : Statistics home". Retrieved March 3, 2015.
- ^ "Historical Statistics". Retrieved March 3, 2015.
- ^ Master Plan For the Philippine Sugar Industry. Sugar Master Plan Foundation, Inc. 2010. p. 7.
- ^ "Philippines Shipbuilding Hub In Asia-Pacific". Yahoo News Philippines. December 4, 2012. Retrieved March 3, 2015.
- ^ "Business - Cebu shipbuilder to deliver PHs largest vessel - INQUIRER.net". Archived from the original on August 6, 2014. Retrieved March 3, 2015.
- ^ "Crossworld Marine". crossworldmarine.com.
- ^ John Pike. "Philippine Shipbuilding Industry". Retrieved March 3, 2015.
- ^ "New era as shipbuilding production begins in the Philippines". Archived from the original on May 9, 2007. Retrieved March 3, 2015.
- ^ William Poole. "Big ambitions for Philippines shipbuilding". Archived from the original on April 2, 2015. Retrieved March 3, 2015.
- ^ "Filipino firm invests P259M for shipyard in Navotas". Archived from the original on December 16, 2012. Retrieved January 12, 2013.
- ^ "Toyota defends assembly of small cars in the Philippines – Manila Bulletin".
- ^ Oslowski, Justin. (March 25, 2003). "Automotive Production in the Philippines". Industry Canada. Archived from the original on December 8, 2007. Retrieved December 11, 2007.
- ^ Garcia-Yap, Aileen. "Laguna car plant seen to boost Chery's sales". newsinfo.inquirer.net.
- ^ "Mitsubishi expands in the Philippines". Investvine.com. February 21, 2013. Retrieved February 21, 2013.
- ^ "Relocating Firms To Double Exports Of Aerospace Components To $6B". ph.news.yahoo.com.
- ^ "The positive outlook to the Philippines". philnews.com. Retrieved December 11, 2007.
- ^ "Texas Instruments in Baguio retrenches 392 employees – Equipment\cn-c114 ĄŞ C114 – China Communication Network". Cn-c114.net. Archived from the original on July 6, 2010. Retrieved October 12, 2012.
- ^ Tester, JK; Anderson, Bj; Batchelor, As; Blackwell, Dd; DiPippo, R; Drake, Em; Garnish, J; Livesay, B; Moore, Mc; Nichols, K; Petty, S; Toksoz, Mn; Veatch, Rw; Baria, R; Augustine, C; Murphy, E; Negraru, P; Richards, M (April 2007). "Geothermal Energy Systems". Philosophical Transactions of the Royal Society A. 365 (1853): 1057–94. doi:10.1098/rsta.2006.1964. PMID 17272236. S2CID 34876278. Archived from the original on March 9, 2005. Retrieved December 11, 2007. (from internet archive)
- ^ Conde, Carlos H. (December 3, 2004). "Court ruling in Philippines buoys mining sector there". The New York Times. Retrieved January 15, 2021.
- ^ USGS Nickel Production Statistics
- ^ USGS Cobalt Production Statistics
- ^ Overland, Indra; Sagbakken, Haakon Fossum; Chan, Hoy-Yen; Merdekawati, Monika; Suryadi, Beni; Utama, Nuki Agya; Vakulchuk, Roman (December 2021). "The ASEAN climate and energy paradox". Energy and Climate Change. 2: 100019. doi:10.1016/j.egycc.2020.100019. hdl:11250/2734506.
- ^ Vakulchuk, R., Chan, H.Y., Kresnawan, M.R., Merdekawati, M., Overland, I., Sagbakken, H.F., Suryadi, B., Utama, N.A. and Yurnaidi, Z., 2020. The Philippines: how to leapfrog from a complicated renewable energy sector to an attractive one. ASEAN Centre for Energy (ACE) Policy Brief Series, No 10. https://www.researchgate.net/publication/341794159
- ^ IBM Global Business Services. (October 2008). Global Location Trends – 2008 Annual Report[permanent dead link].
- ^ Balana, Cynthia D. and Lawrence de Guzman. (December 5, 2008). It's official: Philippines bests India as No. 1 in BPO Archived September 26, 2012, at the Wayback Machine. The Philippine Daily Inquirer.
- ^ "foreign companies eye local BPO sector". inquirer.net. Retrieved August 5, 2015.
- ^ Philippine Economic Zone Authority."Information Technology Parks/Centers". Retrieved July 4, 2019.
- ^ ABS-CBNnews.com, By Cathy Rose A. Garcia. "BPO industry to generate 100,000 jobs this year: WB". ABS-CBN News.
- ^ "IT-BPO revenue reached $11B in 2011". Retrieved March 3, 2015.
- ^ "Business Outsourcing Reshaping Philippine Society – News". August 8, 2010. Archived from the original on May 25, 2013. Retrieved November 14, 2012.
- ^ Jump up to: a b c "The Philippines – Poised for Growth Through BPO". trendline.dcrworkforce.com. Archived from the original on November 17, 2015. Retrieved November 10, 2015.
- ^ "Accelerate PH:Future-Ready Roadmap 2022–The Philippine IT-BPM Sector–Executive Summary". Frost&Sullivan and IBPAP. 2016. Archived from the original on July 6, 2019. Retrieved July 4, 2019.
- ^ "Share of Tourism to GDP is 12.7 percent in 2019". Philippine Statistics Authority. Retrieved June 19, 2020.
- ^ "Natural Resources and Environment in Philippines". (n.d.). eTravel Pilipinas. Retrieved January 22, 2009.
- ^ https://cnnphilippines.com/life/leisure/travel/2018/4/11/problem-with-Philippine-tourism.html
- ^ Jump up to: a b "Daang Matuwid – Achievements". Official Gazette of the Republic of Philippines. Retrieved May 27, 2016.
- ^ "Phl now 56th in world economic freedom rankings" Archived September 28, 2013, at the Wayback Machine. Thechroniclevarsitarian.wordpress.com. Retrieved September 22, 2013.
- ^ List of countries by GDP (PPP)
- ^ List of countries by GDP (nominal)
- ^ List of countries by GDP (PPP) per capita
- ^ List of countries by GDP (nominal) per capita
- ^ List of countries by foreign-exchange reserves
- ^ "Index Data 2016". heritage.org.
- ^ External Debt List of countries by external debt
- ^ Human Development Index 2014 List of countries by Human Development Index
- ^ "The Global Competitiveness Report 2018". Retrieved October 17, 2018.
- ^ "Phl moves up in WEF Enabling Trade Index". philstar.com. Retrieved March 3, 2015.
- ^ "The Financial Development Index 2012 rankings: Comparison with 2011" (PDF). World Economic Forum. Retrieved September 15, 2014.
- ^ "Ease of Doing Business Report". Doingbusiness.org. Retrieved September 28, 2013.
- ^ National Economic and Development Authority (NEDA), Republic of the Philippines. (January 31, 2011). Annual GDP Sizzled to its Highest Growth Rate in the Post Marcos Era at 7.3 Percent; Q4 2010 GDP grew by 7.1 percent Archived February 2, 2011, at the Wayback Machine
- ^ National Economic and Development Authority (NEDA), Republic of the Philippines. "National Income Accounts (NIA) – GNP/GDP Matrices". Archived from the original on August 20, 2010. Retrieved September 24, 2010.
- ^ Agcaoili, Lawrence. (November 26, 2010). GDP growth slows to 6.5% in 3rd quarter. The Philippine Star.
- ^ "Philippine Statistics Authority | Republic of the Philippines". psa.gov.ph. Retrieved March 25, 2018.
- ^ Jump up to: a b "Philippine Statistics Authority". National Statistical Coordination Board. Archived from the original on November 13, 2012.
- ^ National Statistics Office, Republic of the Philippines. (October 5, 2010). "Consumer Price Index September 2010". Archived from the original on February 23, 2010. Retrieved September 30, 2010.
- ^ Jump up to: a b "Philippine Statistics Authority". National Statistical Coordination Board. Archived from the original on August 21, 2003.
- ^ "April 2011 Labor Force Survey (LFS)". Census.gov.ph. Archived from the original on June 24, 2011. Retrieved September 4, 2011.
- ^ Jump up to: a b "Philippine Statistics Authority". National Statistical Coordination Board. Archived from the original on December 12, 2012.
- ^ "End-September forex reserves climb to $81.9-B". InterAksyon.com. October 5, 2012. Archived from the original on October 5, 2012. Retrieved October 12, 2012.
- ^ Jump up to: a b "Philippine Statistics Authority". National Statistical Coordination Board. Archived from the original on December 12, 2012.
- ^ Ho, Abigail. (December 28, 2010). DTI says export earnings to hit $100B by '16 Archived December 30, 2010, at the Wayback Machine. The Philippine Daily Inquirer. Retrieved December 28, 2010.
- ^ "Philippine Statistics Authority". National Statistical Coordination Board. Archived from the original on November 13, 2012.
- ^ "PRRD signs the P4.506 Trillion National Budget for FY 2021". Department of Budget and Management. Retrieved January 7, 2021.
Further reading[]
- Balisacan, Arsenio; Hal Hill (2003). The Philippine Economy: Development, Policies, and Challenges. New York: Oxford University Press. p. 496. ISBN 978-0-19-515898-4. Archived from the original on 28 June 2011.
- Balisacan, Arsenio; Hal Hill (2007). "The Dynamics of Regional Development: The Philippines in East Asia" (PDF). Cheltenham, UK: Edward Elgar. Cite journal requires
|journal=(help) - Bhagwati, Jagdish and Anne Krueger. (1974). Foreign Trade Regimes and Economic Development. National Bureau of Economic Research.
- Hawes, Gary, And Ruth T. Mcvey. (2018) "Marcos, His Cronies, and the Philippines' Failure to Develop." Southeast Asian Capitalists (Cornell University Press, 2018) pp. 145-160.
- Hutchcroft, Paul D. (1998). Booty Capitalism: The Politics of Banking in the Philippines. Cornell University Press. ISBN 9781501738630.
- Kang, David C. (2002). Crony Capitalism – Corruption and Development in South Korea and the Philippines. Cambridge University Press. ISBN 978-0-521-00408-4.
- Krinks, Peter. The economy of the Philippines: Elites, inequalities and economic restructuring (Routledge, 2003_.
- Villegas, Bernardo. (2010). The Philippine Advantage (3rd ed.). Manila: University of Asia and the Pacific.
- Yang, Lan, et al. "Can an island economy be more sustainable? A comparative study of Indonesia, Malaysia, and the Philippines." Journal of Cleaner Production 242 (2020): 118572.
- State of the Philippine Islands (1821) online
- Philippines – Asia's new tiger economy
- Philippines' opportunity point
External links[]
| Wikimedia Commons has media related to Economy of the Philippines. |
- Bangko Sentral ng Pilipinas (Central Bank of the Philippines)
- Department of Trade and Industry
- Department of Finance
- Philippine Stock Exchange
- Department of Tourism
- Philippine Economic Zone Authority
- Trade


| show Philippines articles |
|---|

| show Economy of Asia |
|---|
- Economy of the Philippines
- World Trade Organization member economies