Economy of Croatia
 Sectors of the Croatian economy | |
| Currency | Croatian kuna (HRK, kn) |
|---|---|
Fiscal year | Calendar year |
Trade organisations | EU, WTO |
Country group |
|
| Statistics | |
| Population | |
| GDP | |
| GDP rank | |
GDP growth | |
GDP per capita | |
GDP per capita rank | |
GDP by sector |
|
GDP by component |
|
Inflation (CPI) | |
Population below poverty line |
|
Gini coefficient | |
Labour force | |
Labour force by occupation |
|
| Unemployment | |
Average gross salary | HRK 9,601 / €1,284 / $1,556 monthly (March 2021) |
Average net salary | HRK 7,138 / €955 / $1,157 monthly (March 2021) |
Main industries | chemicals and plastics, machine tools, fabricated metal, electronics, pig iron and rolled steel products, aluminium, paper, wood products, construction materials, textiles, shipbuilding, petroleum and petroleum refining, food and beverages, tourism |
| External | |
| Exports | |
Export goods | transport equipment, machinery, textiles, chemicals, foodstuffs, fuels |
Main export partners |
|
| Imports | |
Import goods | machinery, transport and electrical equipment; chemicals, fuels and lubricants; foodstuffs |
Main import partners | |
FDI stock | |
Gross external debt | |
| Public finances | |
| Revenues | 48.0% of GDP (2020)[25] |
| Expenses | 55.44% of GDP (2020)[25] |
| Economic aid | €179.5 million (0.12% of GNI) (2007) |
| |
Foreign reserves | |
All values, unless otherwise stated, are in US dollars. | |
The economy of Croatia is a developed high-income service based economy[30][31] with the tertiary sector accounting for 60% of total gross domestic product (GDP). Croatia joined the World Trade Organization in 2000, NATO in 2009 and became a member of the European Union on 1 July 2013. The Croatian economy was badly affected by the financial crisis which, together with slow progress of economic reforms, resulted in six years of recession and a cumulative decline in GDP of 12.5%. Croatia formally emerged from the recession in the fourth quarter of 2014, and had a continuous GDP growth since. The Croatian economy reached pre crisis levels in 2019, but due to the Coronavirus pandemic its GDP decreased by 8.4% in 2020.[32]
However Croatia bounced back supported by strong private consumption, the better-than-expected performance of tourism industry and the boom merchandise exports, that in the first nine months of 2021 amounted to 13.3 billion euros, an annual increase of 24.6 per cent. This made 2021 Croatian export's record year as the score from 2019 was exceeded by 2 billion euros.[33]
Tourism is one of the main pillars of the Croatian economy, comprising 19.6% of Croatia's GDP. Croatia is working to become an energy powerhouse with its floating liquefied natural gas (LNG) regasification terminal on the island of Krk[34] and investments in green energy,[35][36] particularly wind energy,[37] solar and geothermal energy, having opened 17 MW Velika 1 geothermal power plant in Ciglena in late 2019, that is the largest power plant in continental Europe with [38][39][40] and starting the work on the second one in the summer of 2021.[41][42][43] The government intends to spend about $1.4 billion on grid modernisation, with a goal of increasing renewable energy source connections by at least 800 MW by 2026 and 2,500 MW by 2030[44] and predicts that renewable energy resources as a share of total energy consumption will grow to 36.4% in 2030, and to 65.6% in 2050.[45]
On Friday, 12th of November 2021 Fitch raised Croatia's credit rating by one level, from ‘BBB-‘ to ‘BBB’, Croatia's highest credit rating in history,[46] with a positive outlook, noting progress in preparations for Eurozone membership and a strong recovery of the Croatian economy from the pandemic crisis.[47] Croatia is also set to join Schengen area soon which will have a positive impact on its tourism industry and will further easy the imports and exports of goods.[48][49]
History[]
Pre-1990[]


During the 19th century, the Kingdom of Croatia had a high ratio of population working in agriculture. Many industrial branches developed in that time, like forestry and wood industry (stave fabrication, the production of potash, lumber mills, shipbuilding). The most profitable one was stave fabrication, the boom of which started in the 1820s with the clearing of the oak forests around Karlovac and Sisak and again in the 1850s with the marshy oak masses along the Sava and Drava rivers. Shipbuilding in Croatia played a huge role in the 1850s Austrian Empire, especially the longe-range sailing boats. Sisak and Vukovar were the centres of river-shipbuilding.[50] Slavonia was also mostly an agricultural land and it was known for its silk production. Agriculture and the breeding of cattle were the most profitable occupations of the inhabitants. It produced corn of all kinds, hemp, flax, tobacco, and great quantities of liquorice.[51][52]
The first steps towards industrialization began in the 1830s and in the following decades the construction of big industrial enterprises took place.[53] During the 2nd half of the 19th and early 20th century there was an upsurge of industry in Croatia, strengthened by the construction of railways and the electric-power production. However, the industrial production was still lower than agricultural production.[54] Regional differences were high. Industrialization was faster in inner Croatia than in other regions, while Dalmatia remained one of the poorest provinces of Austria-Hungary.[55] The slow rate of modernization and rural overpopulation caused extensive emigration, particularly from Dalmatia. According to estimates, roughly 400,000 Croats emigrated from Austria-Hungary between 1880 and 1914. In 1910 8.5% of the population of Croatia-Slavonia lived in urban settlements.[56]
In 1918 Croatia became part of the Kingdom of Yugoslavia, which was in the interwar period one of the least developed countries in Europe. Most of its industry was based in Slovenia and Croatia, but further industrial development was modest and centered on textile mills, sawmills, brick yards and food-processing plants. The economy was still traditionally based on agriculture and raising of livestock, with peasants accounting for more than half of Croatia's population.[56][57]
In 1941 the Independent State of Croatia (NDH), a World War II puppet state of Germany and Italy, was established in parts of Axis-occupied Yugoslavia. The economic system of NDH was based on the concept of "Croatian socialism".[58] The main characteristic of the new system was the concept of a planned economy with high levels of state involvement in economic life. The fulfillment of basic economic interests was primarily ensured with measures of repression.[59] All large companies were placed under state control and the property of the regime's national enemies was nationalized. Its currency was the NDH kuna. The Croatian State Bank was the central bank, responsible for issuing currency. As the war progressed the government kept printing more money and its amount in circulation was rapidly increasing, resulting in high inflation rates.[60]
After World War II, the new Communist Party of Yugoslavia resorted to a command economy on the Soviet model of rapid industrial development. By 1948 almost all domestic and foreign-owned capital had been nationalized. The industrialization plan relied on high taxation, fixed prices, war reparations, Soviet credits, and export of food and raw materials. Forced collectivization of agriculture was initiated in 1949. At that time 94% of agricultural land was privately owned, and by 1950 96% was under the control of the social sector. A rapid improvement of food production and the standard of living was expected, but due to bad results the program was abandoned three years later.[56]
Throughout the 1950s Croatia experienced rapid urbanization. Decentralization came in 1965 and spurred growth of several sectors including the prosperous tourist industry. SR Croatia was, after SR Slovenia, the second most developed republic in Yugoslavia with a 25% higher GDP per capita than the Yugoslav average. Croatia and Slovenia accounted for nearly half of the total Yugoslav GDP, and this was reflected in the overall standard of living. In the mid-1960s, Yugoslavia lifted emigration restrictions and the number of emigrants increased rapidly. In 1971 224,722 workers from Croatia were employed abroad, mostly in West Germany.[61][62] Foreign remittances contributed $2 billion annually to the economy by 1990.[63] Profits gained through Croatia's industry were used to develop poor regions in other parts of former Yugoslavia, leading to Croatia contributing much more to the federal Yugoslav economy than it gained in return. This, coupled with austerity programs and hyperinflation in the 1980s, led to discontent in both Croatia and Slovenia which eventually fuelled political movements calling for independence.[64]
Transition and war years[]


In the late 1980s and early 1990s, with the collapse of socialism and the beginning of economic transition, Croatia faced considerable economic problems stemming from:[65]
- the legacy of longtime communist mismanagement of the economy;
- damage during the internecine fighting to bridges, factories, power lines, buildings, and houses;
- the large refugee and displaced population, both Croatian and Bosnian;
- the disruption of economic ties; and
- mishandled privatization
At the time Croatia gained independence, its economy (and the whole Yugoslavian economy) was in the middle of recession. Privatization under the new government had barely begun when war broke out in 1991. As a result of the Croatian War of Independence, infrastructure sustained massive damage in the period 1991–92, especially the revenue-rich tourism industry. Privatization in Croatia and transformation from a planned economy to a market economy was thus slow and unsteady, largely as a result of public mistrust when many state-owned companies were sold to politically well-connected at below-market prices. With the end of the war, Croatia's economy recovered moderately, but corruption, cronyism, and a general lack of transparency stymied economic reforms and foreign investment.[64][66] The privatization of large government-owned companies was practically halted during the war and in the years immediately following the conclusion of peace. As of 2000, roughly 70% of Croatia's major companies were still state-owned, including water, electricity, oil, transportation, telecommunications, and tourism.[67]
The early 1990s were characterized by high inflation rates. In 1991 the Croatian dinar was introduced as a transitional currency, but inflation continued to accelerate. The anti-inflationary stabilization steps in 1993 decreased retail price inflation from a monthly rate of 38.7% to 1.4%, and by the end of the year, Croatia experienced deflation. In 1994 Croatia introduced the kuna as its currency.[66]
As a result of the macro-stabilization programs, the negative growth of GDP during the early 1990s stopped and turned into a positive trend. Post-war reconstruction activity provided another impetus to growth. Consumer spending and private sector investments, both of which were postponed during the war, contributed to the growth in 1995–1997.[66] Croatia began its independence with a relatively low external debt because the debt of Yugoslavia was not shared among its former republics at the beginning. In March 1995 Croatia agreed with the Paris Club of creditor governments and took 28.5% of Yugoslavia's previously non-allocated debt over 14 years. In July 1996 an agreement was reached with the London Club of commercial creditors, when Croatia took 29.5% of Yugoslavia's debt to commercial banks. In 1997 around 60 percent of Croatia's external debt was inherited from former Yugoslavia.[68]
At the beginning of 1998 value-added tax was introduced. The central government budget was in surplus in that year, most of which was used to repay foreign debt.[69] Government debt to GDP had fallen from 27.30% to 26.20% at the end of 1998. However, the consumer boom was disrupted in mid 1998, as a result of the bank crisis when 14 banks went bankrupt.[66] Unemployment increased and GDP growth slowed down to 1.9%. The recession that began at the end of 1998 continued through most of 1999, and after a period of expansion GDP in 1999 had a negative growth of −0.9%.[70] In 1999 the government tightened its fiscal policy and revised the budget with a 7% cut in spending.[71]
In 1999 the private sector share in GDP reached 60%, which was significantly lower than in other former socialist countries. After several years of successful macroeconomic stabilization policies, low inflation and a stable currency, economists warned that the lack of fiscal changes and the expanding role of the state in the economy caused the decline in the late 1990s and were preventing sustainable economic growth.[68][71]
| Year | GDP growth | Deficit/surplus* | Debt to GDP | Privatization revenues* |
|---|---|---|---|---|
| 1994 | 5.9% | 1.8% | 22.2% | |
| 1995 | 6.8% | −0.7% | 19.3% | 0.9% |
| 1996 | 5.9% | −0.4% | 28.5% | 1.4% |
| 1997 | 6.6% | −1.2% | 27.3% | 2.0% |
| 1998 | 1.9% | 0.5% | 26.2% | 3.6% |
| 1999 | −0.9% | −2.2% | 28.5% | 8.2% |
| 2000 | 3.8% | −5.0% | 34.3% | 10.2% |
| 2001 | 3.4% | −3.2% | 35.2% | 13.5% |
| 2002 | 5.2% | −2.6% | 34.8% | 15.8% |
| *Including capital revenues *cumulative, in % of GDP | ||||
Economy since 2000[]
The new government led by the president of SDP, Ivica Račan, carried out a number of structural reforms after it won the parliamentary elections on 3 January 2000. The country emerged from the recession in the 4th quarter of 1999 and growth picked up in 2000.[72] Due to overall increase in stability, the economic rating of the country improved and interest rates dropped. Economic growth in the 2000s was stimulated by a credit boom led by newly privatized banks, capital investment, especially in road construction, a rebound in tourism and credit-driven consumer spending. Inflation remained tame and the currency, the kuna, stable.[64][73]
In 2000 Croatia generated 5,899 billion kunas in total income from the shipbuilding sector, which employed 13,592 people. Total exports in 2001 amounted to $4,659,286,000, of which 54.7% went to the countries of the EU. Croatia's total imports were $9,043,699,000, 56% of which originated from the EU.[74]
Unemployment reached its peak in late 2002, but has since been steadily declining. In 2003, the nation's economy would officially recover to the amount of GDP it had in 1990.[75] In late 2003 the new government led by HDZ took over the office. Unemployment continued falling, powered by growing industrial production and rising GDP, rather than only seasonal changes from tourism. Unemployment reached an all-time low in 2008 when the annual average rate was 8.6%,[76] GDP per capita peaked at $16,158,[70] while public debt as percentage of GDP decreased to 29%. Most economic indicators remained positive in this period except for the external debt as Croatian firms focused more on empowering the economy by taking loans from foreign resources.[75] Between 2003 and 2007, Croatia's private-sector share of GDP increased from 60% to 70%.[77]
The Croatian National Bank had to take steps to curb further growth of indebtedness of local banks with foreign banks. The dollar debt figure is quite adversely affected by the EUR/USD ratio—over a third of the increase in debt since 2002 is due to currency value changes.
2009–2015[]
Economic growth has been hurt by the global financial crisis.[78] Immediately after the crisis it seemed that Croatia did not suffer serious consequences like some other countries. However, in 2009, the crisis gained momentum and the decline in GDP growth, at a slower pace, continued during 2010. In 2011 the GDP stagnated as the growth rate was zero.[79] Since the global crisis hit the country, the unemployment rate has been steadily increasing, resulting in the loss of more than 100,000 jobs.[80] While unemployment was 9.6% in late 2007,[81] in January 2014 it peaked at 22.4%.[82] In 2010 Gini coefficient was 0,32.[83] In September 2012, Fitch ratings agency unexpectedly improved Croatia's economic outlook from negative to stable, reaffirming Croatia's current BBB rating.[84] The slow pace of privatization of state-owned businesses and an overreliance on tourism have also been a drag on the economy.[78]
Croatia joined the European Union on 1 July 2013 as the 28th member state. The Croatian economy is heavily interdependent on other principal economies of Europe, and any negative trends in these larger EU economies also have a negative impact on Croatia. Italy, Germany and Slovenia are Croatia's most important trade partners.[79] In spite of the rather slow post-recession recovery, in terms of income per capita it is still ahead of some European Union member states such as Bulgaria, and Romania.[85] In terms of average monthly wage, Croatia is ahead of 9 EU members (Czech Republic, Estonia, Slovakia, Latvia, Poland, Hungary, Lithuania, Romania, and Bulgaria).[86]

The annual average unemployment rate in 2014 was 17.3% and Croatia has the third-highest unemployment rate in the European Union, after Greece (26.5%), and Spain (24.%).[76] Of particular concern is the heavily backlogged judiciary system, combined with inefficient public administration, especially regarding the issues of land ownership and corruption in the public sector. Unemployment is regionally uneven: it is very high in eastern and southern parts of the country, nearing 20% in some areas, while relatively low in the north-west and in larger cities, where it is between 3 and 7%. In 2015 external debt rose by 2.7 billion euros since the end of 2014 and is now around €49.3 billion.
2016–2020[]
During 2015 the Croatian economy started with slow but upward economic growth, which continued during 2016 and conclusive at the end of the year seasonally adjusted was recorded at 3.5%.[87] The better than expected figures during 2016 enabled the Croatian Government and with more tax receipts enabled the repayment of debt as well as narrow the current account deficit during Q3 and Q4 of 2016[88][89] This growth in economic output, coupled with the reduction of government debt has made a positive impact on the financial markets with many ratings agencies revising their outlook from negative to stable, which was the first upgrade of Croatia's credit rating since 2007.[90] Due to consecutive months of economic growth and the demand for labour, plus the outflows of residents to other European countries, Croatia had recorded the biggest fall in the number of unemployed during the month of November 2016 from 16.1% to 12.7%.
2020 – present[]
COVID-19 Pandemic has caused more than 400,000 workers to file for economic aid of 4000.00 HRK./month. In the first quarter of 2020, Croatian GDP rose by 0.2% but then in Q2 Government of Croatia announced the biggest quarterly GDP plunge of -15.1% since GDP has been measured. Economic activity also plunged in Q3 2020 when GDP slid by an additional -10.0%.
In autumn 2020 European Commission estimated total GDP loss in 2020 to be -9.6%. Growth was set to pick up in the last month of Q1 2021 and the second quarter of 2021 respectively +1.4% and +3.0%, meaning that Croatia was set to reach 2019 levels by 2022.[91] In July 2021 projection was improved to 5.4% due to the strong outturn in the first quarter and the positive high-frequency indicators concerning consumption, construction, industry and tourism prospects.[92] In November 2021 Croatia outperformed these projections and the real GDP growth was calculated to be 8.1% for the year 2021, improving its projection of 5.4% GDP growth made in July.[93] The recovery was supported by strong private consumption, the better-than-expected performance of tourism and the ongoing resilience of the export sector. Preliminary data point to tourism-related expenditure already exceeding 2019 levels, which has been supportive of both employment and consumption. Exports of goods have also continued to perform strongly (up 43%yoy in 2Q21) pointing to resilient competitiveness.[94] Expressed in euros, Croatian merchandise exports in the first nine months of 2021 amounted to 13.3 billion euros, an annual increase of 24.6 per cent. At the same time, imports rose 20.3 per cent to 20.4 billion euros. The coverage of imports by exports for the first nine months is 65.4 per cent.[95] This made 2021 Croatian export's record year as the score from 2019 was exceeded by 2 billion euros.[33]
Exports recovered in all major markets, more precisely with all EU countries and CEFTA countries. Specifically, on the EU market, only a lower export result is recorded in relations with Sweden, Belgium and Luxembourg. Italy is again the main market for Croatian products, followed by Germany and Slovenia. Apart from the high contribution of crude oil that Ina sends to Hungary to the Mol refinery for processing, the export of artificial fertilizers from Petrokemija also has a significant contribution to growth.
For 2022, the Commission revised downwards its projection for Croatia's economic growth to 5.6% from 5.9% previously predicted in July 2021. Commission again confirmed that the volume of Croatia's GDP should reach its 2019 level during 2022, while in 2023 the GDP will grow by 3.4%. The Commission warned that the key downside risks stem from Croatia's relatively low vaccination rates, which could lead to stricter containment measures, and continued delays of the earthquake-related reconstruction. On the upside, potential entry into the Schengen area and euro adoption towards the end of the forecast period could benefit investment and trade.
On Friday, 12th of November 2021 Fitch raised Croatia's credit rating by one level, from ‘BBB-‘ to ‘BBB’, Croatia's highest credit rating in history,[46] with a positive outlook, noting progress in preparations for Eurozone membership and a strong recovery of the Croatian economy from the pandemic crisis.[47] This is also secured by the failure of the eurosceptic party Hrvatski Suverenisti in a bid on the referendum to block Euro adoption in Croatia.[96] In December 2021 Croatia's industrial production increased for the thirteenth consecutive month,[97] observing the growth of production increasing in all of the five aggregates.[98] meaning that industrial production in 2021 increased by 6.7 percent.[99]
Sectors[]
Industry[]

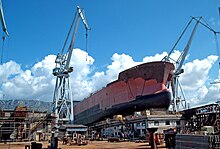
Uljanik shipyard
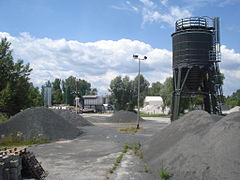
Asphalt plant in Ivanovec

Sisak oil refinery

liqueur factory in Zadar


Tourism[]
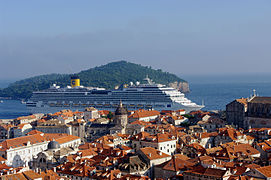
Cruise ship in Dubrovnik.

Kopački Rit Nature Reserve.

St. Mark's Church in Zagreb.

Varaždin Old Town.

Zlatni Rat beach on the Brač island.


Tourism is a notable source of income during the summer and a major industry in Croatia. It dominates the Croatian service sector and accounts for up to 20% of Croatian GDP. Annual tourist industry income for 2011 was estimated at €6.61 billion. Its positive effects are felt throughout the economy of Croatia in terms of increased business volume observed in retail business, processing industry orders and summer seasonal employment. The industry is considered an export business, because it significantly reduces the country's external trade imbalance.[100] Since the conclusion of the Croatian War of Independence, the tourist industry has grown rapidly, recording a fourfold rise in tourist numbers, with more than 10 million tourists each year. The most numerous are tourists from Germany, Slovenia, Austria and the Czech Republic as well as Croatia itself. Length of a tourist stay in Croatia averages 4.9 days.[101]
The bulk of the tourist industry is concentrated along the Adriatic Sea coast. Opatija was the first holiday resort since the middle of the 19th century. By the 1890s, it became one of the most significant European health resorts.[102] Later a large number of resorts sprang up along the coast and numerous islands, offering services ranging from mass tourism to catering and various niche markets, the most significant being nautical tourism, as there are numerous marinas with more than 16 thousand berths, cultural tourism relying on appeal of medieval coastal cities and numerous cultural events taking place during the summer. Inland areas offer mountain resorts, agrotourism and spas. Zagreb is also a significant tourist destination, rivalling major coastal cities and resorts.[103]
Croatia has unpolluted marine areas reflected through numerous nature reserves and 116 Blue Flag beaches.[104] Croatia is ranked as the 18th most popular tourist destination in the world.[105] About 15% of these visitors (over one million per year) are involved with naturism, an industry for which Croatia is world-famous. It was also the first European country to develop commercial naturist resorts.[106]
Agriculture[]
Croatian agricultural sector subsists from exports of blue water fish, which in recent years experienced a tremendous surge in demand, mainly from Japan and South Korea. Croatia is a notable producer of organic foods and much of it is exported to the European Union. Croatian wines, olive oil and lavender are particularly sought after.
Croatia produced in 2018:
- 2.1 million tons of maize;
- 776 thousand tons of sugar beet (the beet is used to manufacture sugar and ethanol);
- 744 thousand tons of wheat;
- 245 thousand tons of soybean;
- 227 thousand tons of barley;
- 182 thousand tons of potato;
- 155 thousand tons of rapeseed;
- 146 thousand tons of grape;
- 110 thousand tons of sunflower seed;
In addition to smaller productions of other agricultural products, like apple (93 thousand tons), triticale (62 thousand tons) and olive (28 thousand tons).[107]

Boškarin cattle.

Plantations in the fertile Neretva valley.

Vineyards of Istria.


Infrastructure[]
Transport[]

The highlight of Croatia's recent infrastructure developments is its rapidly developed motorway network, largely built in the late 1990s and especially in the 2000s. By September 2011, Croatia had completed more than 1,100 kilometres (680 miles) of motorways, connecting Zagreb to most other regions and following various European routes and four Pan-European corridors.[108][109][110] The busiest motorways are the A1, connecting Zagreb to Split and the A3, passing east–west through northwest Croatia and Slavonia.[111] A widespread network of state roads in Croatia acts as motorway feeder roads while connecting all major settlements in the country. The high quality and safety levels of the Croatian motorway network were tested and confirmed by several EuroTAP and EuroTest programs.[112][113]
Croatia has an extensive rail network spanning 2,722 kilometres (1,691 miles), including 985 kilometres (612 miles) of electrified railways and 254 kilometres (158 miles) of double track railways. The most significant railways in Croatia are found within the Pan-European transport corridors Vb and X connecting Rijeka to Budapest and Ljubljana to Belgrade, both via Zagreb.[108] All rail services are operated by Croatian Railways.[114]
There are international airports in Zagreb, Zadar, Split, Dubrovnik, Rijeka, Osijek and Pula.[115] As of January 2011, Croatia complies with International Civil Aviation Organization aviation safety standards and the Federal Aviation Administration upgraded it to Category 1 rating.[116]
The busiest cargo seaport in Croatia is the Port of Rijeka and the busiest passenger ports are Split and Zadar.[117][118] In addition to those, a large number of minor ports serve an extensive system of ferries connecting numerous islands and coastal cities in addition to ferry lines to several cities in Italy.[119] The largest river port is Vukovar, located on the Danube, representing the nation's outlet to the Pan-European transport corridor VII.[108][120]
Energy[]


There are 610 kilometres (380 miles) of crude oil pipelines in Croatia, connecting the Port of Rijeka oil terminal with refineries in Rijeka and Sisak, as well as several transhipment terminals. The system has a capacity of 20 million tonnes per year.[121] The natural gas transportation system comprises 2,113 kilometres (1,313 miles) of trunk and regional natural gas pipelines, and more than 300 associated structures, connecting production rigs, the Okoli natural gas storage facility, 27 end-users and 37 distribution systems.[122]
Croatian production of energy sources covers 85% of nationwide natural gas demand and 19% of oil demand. In 2008, 47.6% of Croatia's primary energy production structure comprised use of natural gas (47.7%), crude oil (18.0%), fuel wood (8.4%), hydro power (25.4%) and other renewable energy sources (0.5%). In 2009, net total electrical power production in Croatia reached 12,725 GWh and Croatia imported 28.5% of its electric power energy needs.[123] The bulk of Croatian imports are supplied by the Krško Nuclear Power Plant in Slovenia, 50% owned by Hrvatska elektroprivreda, providing 15% of Croatia's electricity.[124]
Electricity:
- production: 12.611 billion kWh (2019)
- exports: 5.261 billion kWh (2019)
- imports: 11.400 billion kWh (2019)
Electricity – production by source:
- hydro: 46.6% (2019)
- termo: 40.4% (2019)
- wind: 11.7% (2019)
- geothermal: 0.7% (2019)
- solar: 0.6% (2019)
Crude oil:
- production: 658 thousand tons (2017)
- imports: 2 million tons (2017)
- exports: 123 thousand tons (2017)
- proved reserves: 10,230,300 barrels (1,626,490 m3) (2017)
Natural gas:
- production: 1.069 billion m³ (2019)
- consumption: 2.908 billion m³ (2019)
- exports: 42 million m³ (2019)
- imports: 2.008 billion m³ (2019)
- proved reserves: 21.094 billion m³ (2019)
Stock exchanges[]

- Zagreb Stock Exchange
Banking[]
Central bank:
- Croatian National Bank
Major commercial banks:
- Zagrebačka banka (owned by UniCredit from Italy)
- Privredna banka Zagreb (owned by Intesa Sanpaolo from Italy)
- Hrvatska poštanska banka
- Hypo-Alpe-Adria Bank d.d. (owned by Addiko Bank from Austria)
- (owned by Raiffeisen from Austria)
- (former Riječka banka, owned by Erste Bank from Austria)
Central Budget[]
Overall Budget:[125]
Revenues:
- 163.69 billion Kuna ($24.72 billion), 2022
Expenditures:
- 173.82 billion Kuna ($26.25 billion), 2022
Expenditure by ministries for 2022:[125]
- Labor and Pension System, Family and Social Policy – 55.21 billion Kuna
- Finance – 50.87 billion Kuna
- Science and Education – 23.25 billion Kuna
- Health – 16.06 billion Kuna
- Maritime Affairs, Transport and Infrastructure – 10.23 billion Kuna
- Economy and Sustainable Development – 9.82 billion Kuna
- Agriculture – 8.66 billion Kuna
- Interior – 5.96 billion Kuna
- Defence – 6.91 billion Kuna
- Justice and Public Administration – 3.51 billion Kuna
- Construction, Physical Planning and State Property – 2.98 billion Kuna
- Regional Development and EU funds – 2.09 billion Kuna
- Veterans' Affairs – 1.21 billion Kuna
- Culture and Media – 2.26 billion Kuna
- Foreign and European Affairs – 0.87 billion Kuna
- Tourism and Sport – 0.63 billion Kuna
Economic indicators[]
The following table shows the main economic indicators in 2000–2020.[126]
| Year | 2000 | 2001 | 2002 | 2003 | 2004 | 2005 | 2006 | 2007 | 2008 | 2009 | 2010 | 2011 | 2012 | 2013 | 2014 | 2015 | 2016 | 2017 | 2018 | 2019 | 2020 | 2021 | 2022 |
|---|---|---|---|---|---|---|---|---|---|---|---|---|---|---|---|---|---|---|---|---|---|---|---|
| GDP (nominal in bln. USD) | 9.318 | 12.321 | 16.188 | 21.234 | 24.760 | 27.515 | 32.625 | 43.425 | 52.130 | 45.188 | 41.397 | 49.314 | 43.330 | 48.428 | 47.095 | 39.656 | 40.693 | 44.179 | 50.641 | 51.475 | 52.960 | 60.669 | 65.697 |
| GDP per capita (nominal in EUR) | 5,300 | 5,979 | 6,619 | 7,140 | 7,766 | 8,459 | 9,319 | 10,188 | 11,134 | 10,474 | 10,539 | 10,503 | 10,317 | 10,300 | 10,246 | 10,618 | 11,174 | 11,942 | 12,716 | 13,349 | 12,186 | ||
| GDP growth (real in %) |
3.8 | 3.0 | 5.7 | 5.6 | 4.2 | 4.3 | 5.0 | 5.1 | 1.9 | -7.3 | -1.3 | -0.2 | -2.4 | -0.4 | -0.3 | 2.4 | 3.5 | 3.4 | 2.8 | 2.9 | -8.0 | ||
| Inflation (in %) | 4.6 | 3.8 | 1.7 | 1.8 | 2.1 | 3.3 | 3.2 | 2.9 | 6.1 | 2.4 | 1.1 | 2.3 | 3.4 | 2.2 | -0.2 | -0.5 | -1.1 | 1.1 | 1.5 | 0.8 | 0.1 | ||
| Exchange rate (to 1 EUR) | 7.5983 | 7.3700 | 7.4423 | 7.6469 | 7.6712 | 7.3756 | 7.3451 | 7.3251 | 7.3244 | 7.3062 | 7.3852 | 7.5304 | 7.5456 | 7.6376 | 7.6615 | 7.6350 | 7.5578 | 7.5136 | 7.4176 | 7.4426 | 7.5369 | ||
| Exchange rate (to 1 USD) | 8.1553 | 8.3560 | 7.1457 | 6.1185 | 5.6369 | 6.2336 | 5.5784 | 4.9855 | 5.1555 | 5.0893 | 5.5683 | 5.8199 | 5.7268 | 5.5490 | 6.3021 | 6.9918 | 7.1685 | 6.2697 | 6.4692 | 6.6499 | 6.1390 | ||
| Unemployment rate (in %) | 16.1 | 15.8 | 14.8 | 14.3 | 13.8 | 12.7 | 11.2 | 9.9 | 8.5 | 9.2 | 11.6 | 13.7 | 15.9 | 17.3 | 17.3 | 16.2 | 13.1 | 11.2 | 8.4 | 6.6 | 7.5 | ||
| Employment rate (in %) | 42.6 | 41.8 | 43.3 | 43.1 | 43.5 | 43.3 | 43.6 | 47.6 | 48.6 | 48.2 | 46.5 | 44.8 | 43.2 | 42.1 | 43.3 | 44.2 | 44.6 | 45.8 | 46.9 | 47.7 | 47.2 | ||
| Government debt (% GDP) | 35.7 | 36.9 | 36.8 | 38.2 | 40.3 | 41.3 | 38.8 | 37.5 | 39.3 | 48.7 | 57.7 | 64.3 | 70.1 | 81.2 | 84.8 | 84.3 | 80.8 | 77.6 | 74.3 | 72.8 | 88.7 |
From the CIA World Factbook 2021.
Real GDP (purchasing power parity): $107.11 billion (2020 est.)
Real GDP growth rate: 2.94% (2019 est.)
Real GDP per capita: $26,500 (2020 est.)
GDP (official exchange rate): $60,687 billion (2019 est.)
Labor force: 1.656 million (2020 est.)
Labor force – by occupation: agriculture 1.9%, industry 27.3%, services 70.8% (2017)
Unemployment rate: 8.07% (2019 est.)
Population below poverty line: 18.3% (2018 est.)
Household income or consumption by percentage share:
lowest 10%:
2.7%
highest 10%:
23%
(2015 est.)
Distribution of family income – Gini index: 30.4 (2017)
Inflation rate (consumer prices): 0.7% (2019 est.)
Budget:
revenues:
$25.24 billion (2017 est.)
expenditures:
$24.83 billion, (2017 est.)
Public debt: 77.8% of GDP (2017 est.)
Taxes and revenues: 46.1% (of GDP) (2017 est.)
Agricultural products: maize, wheat, sugar beet, milk, barley, soybeans, potatoes, pork, grapes, sunflower seed
Industries: chemicals and plastics, machine tools, fabricated metal, electronics, pig iron and rolled steel products, aluminum, paper, wood products, construction materials, textiles, shipbuilding, petroleum and petroleum refining, food and beverages, tourism
Industrial production growth rate: 1.2% (2017 est.)
Current account balance: $1.597 billion (2019 est.)
Exports: $23.66 billion (2020 est.)
Exports – commodities: refined petroleum, packaged medicines, cars, medical cultures/vaccines, lumber (2019)
Exports – partners: Italy 13%, Germany 13%, Slovenia 10%, Bosnia and Herzegovina 9%, Austria 6%, Serbia 5% (2019)
Imports: $27.59 billion (2020 est.)
Imports – commodities: crude petroleum, cars, refined petroleum, packaged medicines, electricity (2019)
Imports – partners: Germany 14%, Italy 14%, Slovenia 11%, Hungary 7%, Austria 6% (2019)
Reserves of foreign exchange and gold: $18.82 billion (31 December 2017 est.)
Debt – external: $48.263 billion (2015 est.)
Currency: kuna (HRK)
Exchange rates: kuna per US$1 – 6.2474 (2020)
Gross Domestic Product[]
| Counties of Croatia by GDP, in million Euro | |||||||||||||||||||
|---|---|---|---|---|---|---|---|---|---|---|---|---|---|---|---|---|---|---|---|
| County | 2000 | 2001 | 2002 | 2003 | 2004 | 2005 | 2006 | 2007 | 2008 | 2009 | 2010 | 2011 | 2012 | 2013 | 2014 | 2015 | 2016 | 2017 | 2018 |
| 520 | 569 | 639 | 645 | 688 | 698 | 800 | 804 | 953 | 917 | 834 | 823 | 786 | 790 | 789 | 809 | 855 | 874 | 925 | |
| 564 | 628 | 687 | 713 | 779 | 771 | 849 | 918 | 1,032 | 952 | 914 | 917 | 895 | 888 | 853 | 879 | 917 | 969 | 1,016 | |
| 573 | 630 | 676 | 754 | 883 | 977 | 1,083 | 1,292 | 1,340 | 1,267 | 1,248 | 1,208 | 1,202 | 1,234 | 1,260 | 1,313 | 1,403 | 1,532 | 1,587 | |
| 1,420 | 1,614 | 1,814 | 1,980 | 2,182 | 2,291 | 2,482 | 2,729 | 2,842 | 2,768 | 2,773 | 2,762 | 2,635 | 2,631 | 2,666 | 2,747 | 2,947 | 3,106 | 3,162 | |
| 586 | 713 | 785 | 758 | 777 | 835 | 943 | 1,048 | 1,107 | 998 | 969 | 978 | 948 | 961 | 934 | 961 | 1,008 | 1,031 | 1,035 | |
| 723 | 762 | 830 | 845 | 853 | 855 | 988 | 1,046 | 1,069 | 998 | 935 | 926 | 906 | 919 | 905 | 916 | 961 | 991 | 979 | |
| 569 | 655 | 681 | 706 | 729 | 815 | 858 | 947 | 974 | 868 | 807 | 815 | 803 | 823 | 837 | 867 | 928 | 990 | 1,021 | |
| 235 | 250 | 309 | 384 | 522 | 407 | 429 | 417 | 491 | 445 | 416 | 405 | 382 | 388 | 379 | 388 | 402 | 427 | 436 | |
| 510 | 562 | 644 | 654 | 691 | 737 | 841 | 892 | 1,034 | 977 | 933 | 941 | 929 | 1,088 | 959 | 986 | 1,045 | 1,109 | 1,142 | |
| 1,352 | 1,459 | 1,668 | 1,700 | 1,872 | 2,043 | 2,249 | 2,600 | 2,834 | 2,642 | 2,507 | 2,514 | 2,421 | 2,438 | 2,375 | 2,436 | 2,544 | 2,581 | 2,572 | |
| 325 | 355 | 380 | 420 | 451 | 464 | 478 | 508 | 554 | 504 | 497 | 482 | 458 | 461 | 433 | 440 | 453 | 466 | 499 | |
| 2,111 | 2,138 | 2,261 | 2,543 | 2,685 | 3,066 | 3,371 | 3,560 | 4,060 | 3,820 | 3,822 | 3,905 | 3,981 | 3,849 | 3,849 | 3,854 | 3,961 | 4,177 | 4,270 | |
| 925 | 938 | 972 | 989 | 1,033 | 1,137 | 1,335 | 1,262 | 1,435 | 1,447 | 1,451 | 1,439 | 1,434 | 1,306 | 1,221 | 1,268 | 1,247 | 1,266 | 1,309 | |
| 1,924 | 2,118 | 2,318 | 2,529 | 2,898 | 3,061 | 3,427 | 3,934 | 4,115 | 3,804 | 3,788 | 3,695 | 3,578 | 3,583 | 3,581 | 3,712 | 3,913 | 4,133 | 4,278 | |
| 423 | 450 | 511 | 581 | 659 | 748 | 765 | 902 | 923 | 802 | 859 | 856 | 835 | 851 | 852 | 862 | 903 | 988 | 1,027 | |
| 894 | 996 | 1,139 | 1,175 | 1,166 | 1,229 | 1,347 | 1,451 | 1,637 | 1,549 | 1,463 | 1,456 | 1,436 | 1,467 | 1,462 | 1,506 | 1,601 | 1,718 | 1,865 | |
| 357 | 406 | 438 | 458 | 471 | 476 | 555 | 590 | 615 | 546 | 516 | 526 | 504 | 496 | 455 | 460 | 485 | 500 | 536 | |
| 624 | 686 | 762 | 816 | 864 | 928 | 1,079 | 1,109 | 1,260 | 1,171 | 1,090 | 1,092 | 1,049 | 1,048 | 999 | 1,031 | 1,076 | 1,120 | 1,171 | |
| 627 | 733 | 829 | 982 | 1,055 | 1,166 | 1,238 | 1,443 | 1,618 | 1,478 | 1,405 | 1,383 | 1,366 | 1,386 | 1,395 | 1,445 | 1,527 | 1,671 | 1,797 | |
| 1,284 | 1,272 | 1,583 | 1,653 | 1,823 | 2,059 | 2,128 | 2,419 | 2,653 | 2,555 | 2,398 | 2,449 | 2,439 | 2,450 | 2,466 | 2,549 | 2,651 | 2,832 | 3,011 | |
| 6,912 | 7,806 | 8,569 | 9,458 | 10,400 | 11,717 | 12,954 | 14,059 | 15,439 | 14,561 | 15,586 | 15,383 | 15,055 | 14,778 | 14,754 | 15,206 | 15,818 | 16,782 | 17,544 | |
| Source: Croatian Bureau of Statistics[127] | |||||||||||||||||||
| Counties of Croatia by GDP per capita, in Euro | |||||||||||||||||||
|---|---|---|---|---|---|---|---|---|---|---|---|---|---|---|---|---|---|---|---|
| County | 2000 | 2001 | 2002 | 2003 | 2004 | 2005 | 2006 | 2007 | 2008 | 2009 | 2010 | 2011 | 2012 | 2013 | 2014 | 2015 | 2016 | 2017 | 2018 |
| 4,007 | 4,383 | 4,951 | 5,042 | 5,417 | 5,539 | 6,395 | 6,489 | 7,756 | 7,522 | 6,907 | 6,888 | 6,657 | 6,766 | 6,829 | 7,107 | 7,647 | 7,958 | 7,986 | |
| 3,425 | 3,812 | 4,171 | 4,345 | 4,766 | 4,731 | 5,223 | 5,660 | 6,384 | 5,921 | 5,731 | 5,789 | 5,691 | 5,700 | 5,539 | 5,810 | 6,195 | 6,726 | 6,607 | |
| 4,886 | 5,373 | 5,738 | 6,378 | 7,442 | 8,197 | 9,025 | 10,698 | 11,024 | 10,351 | 10,174 | 9,855 | 9,812 | 10,083 | 10,297 | 10,737 | 11,500 | 12,608 | 13,277 | |
| 7,184 | 8,160 | 9,117 | 9,880 | 10,813 | 11,267 | 12,116 | 13,221 | 13,691 | 13,285 | 13,297 | 13,270 | 12,684 | 12,665 | 12,811 | 13,199 | 14,165 | 14,915 | 15,570 | |
| 4,181 | 5,082 | 5,635 | 5,491 | 5,666 | 6,139 | 6,989 | 7,830 | 8,341 | 7,598 | 7,458 | 7,615 | 7,461 | 7,651 | 7,541 | 7,868 | 8,373 | 8,701 | 8,301 | |
| 5,955 | 6,269 | 6,858 | 7,025 | 7,134 | 7,181 | 8,335 | 8,878 | 9,108 | 8,545 | 8,052 | 8,020 | 7,890 | 8,039 | 7,969 | 8,149 | 8,660 | 9,066 | 8,711 | |
| 4,089 | 4,702 | 4,919 | 5,129 | 5,323 | 5,972 | 6,313 | 7,008 | 7,250 | 6,479 | 6,049 | 6,142 | 6,091 | 6,287 | 6,439 | 6,721 | 7,265 | 7,830 | 7,919 | |
| 4,219 | 4,493 | 5,582 | 6,965 | 9,466 | 7,446 | 7,927 | 7,783 | 9,277 | 8,515 | 8,091 | 7,984 | 7,652 | 7,874 | 7,812 | 8,134 | 8,571 | 9,297 | 8,878 | |
| 4,472 | 4,930 | 5,644 | 5,729 | 6,056 | 6,459 | 7,375 | 7,830 | 9,086 | 8,583 | 8,196 | 8,273 | 8,176 | 9,592 | 8,480 | 8,751 | 9,328 | 9,989 | 10,302 | |
| 4,247 | 4,582 | 5,239 | 5,354 | 5,914 | 6,480 | 7,174 | 8,353 | 9,162 | 8,578 | 8,183 | 8,249 | 7,990 | 8,105 | 7,965 | 8,270 | 8,779 | 9,098 | 8,684 | |
| 3,904 | 4,255 | 4,572 | 5,066 | 5,479 | 5,658 | 5,874 | 6,286 | 6,897 | 6,330 | 6,314 | 6,194 | 5,971 | 6,081 | 5,774 | 5,973 | 6,307 | 6,681 | 6,620 | |
| 7,123 | 7,210 | 7,622 | 8,575 | 9,051 | 10,326 | 11,337 | 11,959 | 13,642 | 12,847 | 12,873 | 13,185 | 13,474 | 13,061 | 13,103 | 13,204 | 13,686 | 14,559 | 14,797 | |
| 4,884 | 4,952 | 5,158 | 5,285 | 5,552 | 6,156 | 7,292 | 6,966 | 8,018 | 8,184 | 8,321 | 8,372 | 8,465 | 7,832 | 7,459 | 7,899 | 7,939 | 8,284 | 7,868 | |
| 4,422 | 4,866 | 5,278 | 5,723 | 6,508 | 6,820 | 7,593 | 8,684 | 9,059 | 8,361 | 8,323 | 8,121 | 7,866 | 7,876 | 7,876 | 8,184 | 8,655 | 9,183 | 9,636 | |
| 3,855 | 4,094 | 4,631 | 5,254 | 5,946 | 6,733 | 6,863 | 8,081 | 8,262 | 7,202 | 7,788 | 7,855 | 7,764 | 7,998 | 8,086 | 8,267 | 8,776 | 9,737 | 9,713 | |
| 4,952 | 5,516 | 6,327 | 6,550 | 6,525 | 6,890 | 7,564 | 8,165 | 9,233 | 8,758 | 8,298 | 8,281 | 8,193 | 8,412 | 8,434 | 8,752 | 9,389 | 10,176 | 10,899 | |
| 3,887 | 4,416 | 4,793 | 5,029 | 5,222 | 5,329 | 6,253 | 6,703 | 7,048 | 6,326 | 6,037 | 6,213 | 6,012 | 5,979 | 5,542 | 5,704 | 6,135 | 6,480 | 6,525 | |
| 3,277 | 3,604 | 4,018 | 4,330 | 4,617 | 4,985 | 5,825 | 6,012 | 6,853 | 6,401 | 6,016 | 6,094 | 5,856 | 5,961 | 5,772 | 6,082 | 6,498 | 6,999 | 6,730 | |
| 4,050 | 4,726 | 5,289 | 6,193 | 6,579 | 7,186 | 7,534 | 8,676 | 9,640 | 8,752 | 8,281 | 8,114 | 7,985 | 8,084 | 8,146 | 8,478 | 9,003 | 9,901 | 10,803 | |
| 4,327 | 4,283 | 5,279 | 5,459 | 5,966 | 6,686 | 6,859 | 7,745 | 8,443 | 8,089 | 7,565 | 7,703 | 7,660 | 7,687 | 7,748 | 8,050 | 8,434 | 9,083 | 9,710 | |
| 8,962 | 10,114 | 11,091 | 12,238 | 13,418 | 15,082 | 16,642 | 18,005 | 19,709 | 18,526 | 19,765 | 19,453 | 18,986 | 18,578 | 18,479 | 18,992 | 19,711 | 20,879 | 22,695 | |
| Source: [127] | |||||||||||||||||||
See also[]
- Economy of Europe
- Areas of Special State Concern (Croatia)
- Croatia and the euro
- Croatia and the World Bank
- Croatian brands
- Taxation in Croatia
References[]
- ^ "World Economic Outlook Database, April 2019". IMF.org. International Monetary Fund. Retrieved 29 September 2019.
- ^ "World Bank Country and Lending Groups". datahelpdesk.worldbank.org. World Bank. Retrieved 29 September 2019.
- ^ "Population on 1 January". ec.europa.eu/eurostat. Eurostat. Retrieved 13 July 2020.
- ^ a b c d e f "World Economic Outlook Database, October 2021". IMF.org. International Monetary Fund. Retrieved 21 March 2022.
- ^ "FIRST QUARTERLY GROSS DOMESTIC PRODUCT ESTIMATE SECOND QUARTER OF 2021". dzs.hr. Croatian Bureau of Statistics. Retrieved 23 September 2021.
- ^ https://www.dzs.hr/
- ^ a b c d e f "The World Factbook". CIA.gov. Central Intelligence Agency. Retrieved 4 February 2019.
- ^ "Economic forecasts" (PDF). European Commission – European Commission.
- ^ a b c d Nikitović, Dijana; Žagmeštar, Hrvoje (30 September 2021). "Pokazatelji siromaštva i socijalne isključenosti u 2020" [Indicators of poverty and social exclusion in 2020]. Priopćenje (in Croatian and English). Zagreb: Državni zavod za statistiku. ISSN 1330-0350. Retrieved 25 October 2021.
- ^ "Gini coefficient of equivalised disposable income – EU-SILC survey". ec.europa.eu. Eurostat. Retrieved 21 March 2022.
- ^ "Human Development Index (HDI)". hdr.undp.org. HDRO (Human Development Report Office) United Nations Development Programme. Retrieved 11 December 2019.
- ^ "Inequality-adjusted HDI (IHDI)". hdr.undp.org. UNDP. Retrieved 22 May 2020.
- ^ "Labor force, total – Croatia". data.worldbank.org. World Bank. Retrieved 1 November 2019.
- ^ "Employment rate by sex, age group 20–64". ec.europa.eu/eurostat. Eurostat. Retrieved 1 November 2019.
- ^ https://www.hzz.hr/statistika
- ^ "Unemployment by sex and age – monthly average". appsso.eurostat.ec.europa.eu. Eurostat. Retrieved 4 October 2020.
- ^ https://www.statista.com/statistics/811946/youth-unemployment-rate-in-croatia/
- ^ "Youth unemployment rate by sex, age (15–24) and country of birth". appsso.eurostat.ec.europa.eu. Eurostat. Retrieved 26 December 2019.
- ^ "Ease of Doing Business in Croatia". Doingbusiness.org. Retrieved 21 November 2017.
- ^ https://www.dzs.hr/Hrv_Eng/publication/2020/04-02-01_06_2020.htm
- ^ https://izvoz.gov.hr/o-hrvatskom-izvozu/9
- ^ a b c d "Robna razmjena s inozemstvom". dzs.hr (in Croatian). Državni zavod za statistiku. Retrieved 25 October 2021.
- ^ "Archived copy". Archived from the original on 12 December 2019. Retrieved 12 December 2019.
{{cite web}}: CS1 maint: archived copy as title (link) - ^ "Main macroeconomic indicators - HNB".
- ^ a b c d e f "Euro area government deficit at 7.2% and EU at 6.9% of GDP". ec.europa.eu/eurostat. Eurostat. Retrieved 21 March 2022.
- ^ "Sovereigns rating list". Standard & Poor's. Retrieved 26 May 2011.
- ^ https://www.fitchratings.com/research/sovereigns/fitch-upgrades-croatia-to-bbb-outlook-positive-12-11-2021
- ^ "Scope affirms Croatia's credit rating at BBB- and revises Outlook to Positive". Scope Ratings. Retrieved 28 January 2022.
- ^ https://www.hnb.hr/en/statistics/statistical-data/financial-sector/central-bank-cnb/international-reserves
- ^ "Country and Lending Groups". World Bank. Archived from the original on 11 January 2018. Retrieved 10 January 2020.
- ^ "World Economic Situation and Prospects report 2019" (PDF). UN. Retrieved 21 January 2019.
- ^ "GDP growth (annual %) - Central Europe and the Baltics | Data". data.worldbank.org. Retrieved 26 November 2021.
- ^ a b "Rekordna godina: Skor iz 2019. nadmašen za 2 milijarde eura". Retrieved 17 November 2021.
- ^ Marinova, Krasimira (29 January 2021). "First Croatian LNG terminal officially inaugurated in Krk island". Innovation and Networks Executive Agency - European Commission. Retrieved 26 November 2021.
- ^ "Croatian government has realized renewables are the cheapest solution". Balkan Green Energy News. 30 March 2021. Retrieved 26 November 2021.
- ^ "Croatian island eyes green energy self-sufficiency in this decade". Reuters. Reuters. 18 June 2021. Retrieved 26 November 2021.
- ^ "Croatia Renewable Energy". www.trade.gov. Retrieved 26 November 2021.
- ^ "Binary Cycle - an overview". www.sciencedirect.com. Retrieved 26 November 2021.
- ^ "Velika Ciglena Geothermal Power Plant Croatia | News". Mannvit. Retrieved 26 November 2021.
- ^ "The 17.5 MW Velika Ciglena geothermal power plant starts operation in Croatia". ThinkGeoEnergy. 12 December 2018. Retrieved 26 November 2021.
- ^ "Work on Croatia's 2nd geothermal plant starting this summer". ThinkGeoEnergy. 10 April 2021. Retrieved 26 November 2021.
- ^ "Geo Power Zagocha to start building Croatia's second geothermal power plant in summer". Balkan Green Energy News. 8 April 2021. Retrieved 26 November 2021.
- ^ "Gradit će se geotermalna elektrana od 530 milijuna kuna u Čađavici". lokalni.vecernji.hr (in Croatian). Retrieved 26 November 2021.
- ^ "Croatia to add 1.5 GW of renewables by 2025". Balkan Green Energy News. 10 November 2021. Retrieved 26 November 2021.
- ^ "Croatia - Renewable Energy". www.trade.gov. Retrieved 26 November 2021.
- ^ a b Trkanjec, Zeljko (15 November 2021). "Fitch assigns Croatia highest credit rating in history". www.euractiv.com. Retrieved 17 November 2021.
- ^ a b "Fitch Upgrades Croatia to 'BBB'". Invest Croatia. 15 November 2021. Retrieved 17 November 2021.
- ^ Trkanjec, Zeljko (26 November 2021). "Macron: Croatia is ready for Schengen". www.euractiv.com. Retrieved 26 November 2021.
- ^ "EU to adopt conclusion on Croatia's readiness for Schengen Area in December". N1 (in Croatian). 25 November 2021. Retrieved 26 November 2021.
- ^ Mariann Nagy – Croatia in the Economic Structure of the Habsburg Empire in the Light of the 1857 Census, p. 81-82
- ^ Mariann Nagy – Croatia in the Economic Structure of the Habsburg Empire in the Light of the 1857 Census, p. 88
- ^ Society for the Diffusion of Useful Knowledge: The Penny Cyclopaedia of the Society for the Diffusion of Useful Knowledge, vol 22, p. 100-101
- ^ Mikulas Teich, Roy Porter: The Industrial Revolution in National Context: Europe and the USA, Cambridge University Press, 1996, p. 310
- ^ Mikulas Teich, Roy Porter: The Industrial Revolution in National Context: Europe and the USA, Cambridge University Press, 1996, p. 311
- ^ Tanner, Marcus (2001). Croatia: a nation forged in war (2nd ed.). New Haven; London: Yale University Press. p. 110. ISBN 0-300-09125-7.
- ^ a b c Richard C. Frucht: Eastern Europe: An Introduction to the People, Land, and Culture, p. 462–463
- ^ The First Yugoslavia: Search for a Viable Political System, Hoover Press, 1983, p. 72
- ^ Rory Yeomans:Visions of Annihilation: The Ustasha Regime and the Cultural Politics of Fascism, 1941–1945, University of Pittsburgh Pre, 2013, p. 197
- ^ Hrvoje Matković: Povijest nezavisne države Hrvatske, Drugo, dopunjeno izdanje Zagreb, 2002., p. 118
- ^ Jozo Tomašević: Rat i revolucija u Jugoslaviji 1941–1945, 2010, p. 785
- ^ "Yugoslavia (former) Guest Workers – Flags, Maps, Economy, History, Climate, Natural Resources, Current Issues, International Agreements, Population, Social Statistics, Political System". www.photius.com.
- ^ Ivo Nejašmić: Hrvatski građani na radu u inozemstvu: razmatranje popisnih podataka 1971, 1981. i 1991.
- ^ Europa Publications Limited. Eastern Europe and the Commonwealth of Independent States 1999: 1999. Routledge, 1999. (pg. 279)
- ^ a b c International Business Publications: Croatia Investment and Trade Laws and Regulations Handbook, p. 22
- ^ "CIA – The World Factbook 2000 – Croatia". www.iiasa.ac.at.
- ^ a b c d Istvan Benczes: Deficit and Debt in Transition: The Political Economy of Public Finances in Central and Eastern Europe, Central European University Press, 2014, p. 203
- ^ Eastern Europe: An Introduction to the People, Land, and Culture, p. 473
- ^ a b Istvan Benczes: Deficit and Debt in Transition: The Political Economy of Public Finances in Central and Eastern Europe, Central European University Press, 2014, p. 205-206
- ^ OECD: Agricultural Policies in Emerging and Transition Economies 1999, p. 43
- ^ a b "United Nations Statistics Division – National Accounts". unstats.un.org.
- ^ a b Gale Research: Countries of the World and Their Leaders: Yearbook 2001, p. 456
- ^ Istvan Benczes:Deficit and Debt in Transition: The Political Economy of Public Finances in Central and Eastern Europe, Central European University Press, 2014, p. 207
- ^ "The World Factbook — Central Intelligence Agency". www.cia.gov. 2 March 2022.
- ^ Richard C. Frucht: Eastern Europe: An Introduction to the People, Land, and Culture, p. 468
- ^ a b Adams, John. "The Political Economies of Slovenia and Croatia: Does EU and Eurozone Membership Play a Role At All?" (PDF). Archived from the original (PDF) on 9 July 2014. Retrieved 8 April 2013.
- ^ a b "Eurostat: Unemployment rate by sex and age groups – annual average".
- ^ "qfinance.com". www.qfinance.com. Archived from the original on 9 February 2013. Retrieved 8 April 2013.
- ^ a b "Croatia Economy: Population, GDP, Inflation, Business, Trade, FDI, Corruption". The Heritage Foundation.
- ^ a b Martina Dalić (2013): "Croatia: A Prolonged Crisis without Recovery" in Novotny Vitt (ed.) From Reform to Growth: Managing the Economic Crisis in Europe, Centre for European Studies, Brussels, May/2013, p. 67-88
- ^ "Economic Outlook Darkens in Croatia :: Balkan Insight". www.balkaninsight.com. 29 August 2012.
- ^ "Ekonomski Indikatori". Archived from the original on 28 September 2007.
- ^ "Državni Zavod Za Statistiku – Republika Hrvatska". www.dzs.hr.
- ^ "Pokazatelji Siromaštva u 2010/Poverty Indicators, 2010". www.dzs.hr.
- ^ "Fitch Cheers Croatia With Upbeat Rating :: Balkan Insight". www.balkaninsight.com. 6 September 2012.
- ^ "Statistics Explained". epp.eurostat.ec.europa.eu.
- ^ List of countries in Europe by monthly average wage
- ^ "Croatia GDP Growth Quickens In Q4, 28 February 2017, accessed 14 March 2017".
- ^ "Croatia Trade Deficit Narrows In September".
- ^ "Jasmina Kuzmanovic, Croatia to Narrow 2016 Budget Deficit on Planned Economic Growth, 10 March 2016, accessed 14 March 2017". Bloomberg News.
- ^ "Croatia views Moody's outlook upgrade as results of reform: minister, 11 March 2017, accessed 14 March 2017". 21 March 2014.
- ^ "Autumn 2020 Economic Forecast". European Commission - European Commission. Retrieved 28 January 2021.
- ^ "European Commission revises up Croatia's 2021 GDP forecast to 5.4 pct". N1 (in Croatian). 7 July 2021. Retrieved 17 November 2021.
- ^ "EU Commission raises forecast for Croatia's 2021 GDP growth to 8.1%". seenews.com. Retrieved 17 November 2021.
- ^ "Fitch Upgrades Croatia to 'BBB'; Outlook Positive". www.fitchratings.com. Retrieved 17 November 2021.
- ^ "Izvoz porastao za 24,9 posto, uvoz za 20,6. Razlika je još uvijek velika na strani uvoza". Novi list. 9 November 2021. Retrieved 17 November 2021.
- ^ "Croatia's eurosceptics fail in bid on referendum to block euro". SWI swissinfo.ch. Retrieved 17 November 2021.
- ^ Trkanjec, Zeljko (1 February 2022). "Industrial production in Croatia up 6.7% in 2021". www.euractiv.com. Retrieved 6 February 2022.
- ^ "CROATIAN BUREAU OF STATISTICS". www.dzs.hr. Retrieved 6 February 2022.
- ^ "Industrijska proizvodnja u 2021. godini porasla 6,7 posto". tportal.hr. Retrieved 6 February 2022.
- ^ Pili, Tomislav; Verković, Davor (1 October 2011). "Iako čini gotovo petinu BDP-a, i dalje niskoprofitabilna grana domaće privrede" [Even though it comprises nearly a fifth of the GDP, it is still a low-profit branch of the national economy]. Vjesnik (in Croatian). Archived from the original on 14 June 2012. Retrieved 20 October 2011.
- ^ "Turistički prihod porast će prvi put nakon 2008" [Tourist income to rise for the first time since 2008]. t-portal.hr (in Croatian). T-Hrvatski Telekom. 14 September 2011. Retrieved 21 October 2011.
- ^ "History of Opatija". Opatija Tourist Board. Archived from the original on 29 April 2012. Retrieved 21 October 2011.
- ^ "Activities and attractions". Croatian National Tourist Board. Retrieved 21 October 2011.
- ^ "Croatia". Foundation for Environmental Education. Archived from the original on 2 December 2011. Retrieved 21 October 2011.
- ^ "UNWTO World Tourism Barometer" (PDF). October 2007. Archived from the original (PDF) on 10 September 2013. Retrieved 23 April 2008.
- ^ "Croatian highlights, Croatia". Euro-poi.com. Archived from the original on 24 February 2013. Retrieved 26 March 2013.
- ^ "Croatia production in 2018, by FAO".
- ^ a b c Tanja Poletan Jugović (11 April 2006). "The integration of the Republic of Croatia into the Pan-European transport corridor network". Pomorstvo. University of Rijeka, Faculty of Maritime Studies. 20 (1): 49–65. Retrieved 14 October 2010.
- ^ "Odluka o razvrstavanju javnih cesta u autoceste" [Decision on classification of public roads as motorways]. Narodne Novine (in Croatian). 25 July 2007. Retrieved 18 October 2010.
- ^ "Odluka o izmjenama i dopunama odluke o razvrstavanju javnih cesta u autoceste" [Decision on amendments and additions to the Decision on classification of public roads as motorways]. Narodne Novine (in Croatian). 30 January 2009. Retrieved 18 October 2010.
- ^ "Traffic counting on the roadways of Croatia in 2009 – digest" (PDF). Hrvatske ceste. Archived from the original (PDF) on 21 July 2011. Retrieved 1 May 2010.
- ^ "EuroTest". Eurotestmobility.com. Archived from the original on 30 April 2011. Retrieved 3 January 2009.
- ^ "Brinje Tunnel Best European Tunnel". Javno.com. Archived from the original on 15 January 2009. Retrieved 3 January 2009.
- ^ Pili, Tomislav (10 May 2011). "Skuplje korištenje pruga uništava HŽ" [More Expensive Railway Fees Ruin Croatian Railways]. Vjesnik (in Croatian). Archived from the original on 14 June 2012. Retrieved 26 October 2011.
- ^ "Air transport". Ministry of the Sea, Transport and Infrastructure (Croatia). Archived from the original on 3 July 2016. Retrieved 10 October 2011.
- ^ "FAA Raises Safety Rating for Croatia". Federal Aviation Administration. 26 January 2011. Archived from the original on 26 June 2013. Retrieved 27 January 2011.
- ^ "Riječka luka –jadranski "prolaz" prema Europi" [The Port of Rijeka – Adriatic "gateway" to Europe] (in Croatian). World Bank. 3 March 2006. Archived from the original on 5 August 2012. Retrieved 13 October 2011.
- ^ "Luke" [Ports] (in Croatian). Ministry of the Sea, Transport and Infrastructure (Croatia). Archived from the original on 16 December 2012. Retrieved 24 August 2011.
- ^ "Plovidbeni red za 2011. godinu" [Sailing Schedule for Year 2011] (in Croatian). Agencija za obalni linijski pomorski promet. Archived from the original on 15 July 2011. Retrieved 27 August 2011.
- ^ "The JANAF system". Jadranski naftovod. Retrieved 8 October 2011.
- ^ "Transportni sustav" [Transport system] (in Croatian). Plinacro. Retrieved 8 October 2011.
- ^ "2010 – Statistical Yearbook of the Republic of Croatia" (PDF). Croatian Bureau of Statistics. December 2010. Retrieved 7 October 2011.
- ^ "Croatia, Slovenia's nuclear plant safe: Croatian president". EU Business. 28 March 2011. Retrieved 8 October 2011.
- ^ a b "Državni proračun Republike Hrvatske za 2022. godinu i projekcije za 2023. i 2024. godinu" [State Budget of the Republic of Croatia for 2022 and projections for 2023 and 2024] (PDF). Narodne novine (in Croatian). 21 December 2021. Archived (PDF) from the original on 7 January 2022. Retrieved 7 January 2022.
- ^ "Glavni makroekonomski indikatori" [Main macroeconomic indicators]. HNB (in Croatian). 20 October 2021. Archived from the original on 3 March 2016. Retrieved 7 January 2022.
- ^ a b "Gross domestic product - Review by countries 2000-2018". dzs.hr. Retrieved 19 July 2021.
External links[]
![]() Media related to Economy of Croatia at Wikimedia Commons
Media related to Economy of Croatia at Wikimedia Commons
- Croatian National Bank
- Croatian Chamber of Economy
- GDP per inhabitant varied by one to six across the EU27 Member States
- Tariffs applied by Croatia as provided by ITC's ITCMarket Access Map[permanent dead link], an online database of customs tariffs and market requirements.
Croatia articles | |||||||
|---|---|---|---|---|---|---|---|
| History |
|  | |||||
| Geography |
| ||||||
| Politics |
| ||||||
| Economy |
| ||||||
| Society |
| ||||||
| |||||||
World Trade Organization | |||
|---|---|---|---|
| System |
| ||
| Issues |
| ||
| Agreements |
| ||
| Ministerial Conferences | |||
| People |
| ||
| Members |
| ||
| |||
- Economy of Croatia
- World Trade Organization member economies
- Economies of Europe by country
- European Union member economies