Economy of Italy
 | |
| Currency | Euro (EUR, €) (Except in Campione d'Italia – CHF) |
|---|---|
Fiscal year | 1 January – 31 December |
Trade organisations | European Union, WTO, OECD, AIIB |
Country group |
|
| Statistics | |
| Population | |
| GDP | |
| GDP rank | |
GDP growth |
|
GDP per capita | |
GDP per capita rank | |
GDP by sector |
|
Inflation (CPI) | |
Population below poverty line | |
Gini coefficient | |
Human Development Index | |
Labour force | |
Labour force by occupation |
|
| Unemployment | |
Average gross salary | €2,446 / $2,740 monthly (2019) |
Average net salary | €1,729 / $1,936 monthly (2019) |
Main industries |
|
Ease-of-doing-business rank | |
| External | |
| Exports | |
Export goods | Engineering products, textiles and clothing, production machinery, motor vehicles, transport equipment, chemicals; foodstuffs, beverages, and tobacco; minerals, nonferrous metals |
Main export partners |
|
| Imports | |
Import goods | Engineering products, chemicals, transport equipment, energy products, minerals and nonferrous metals, textiles and clothing; food, beverages, tobacco |
Main import partners |
|
FDI stock | |
Current account | |
Gross external debt | $3.024 trillion (31 December 2020)[14] |
| Public finances | |
Public debt | |
| Revenues | 47.1% of GDP (2019)[15] |
| Expenses | 48.7% of GDP (2019)[15] |
| Economic aid | donor: ODA, $4.86 billion (2016)[16] |
Credit rating | |
Foreign reserves | |
All values, unless otherwise stated, are in US dollars. | |
The economy of Italy is the third-largest national economy in the European Union, the eighth-largest by nominal GDP in the world, and the 13th-largest by GDP (PPP). Italy is a founding member of the European Union, the Eurozone, the OECD, the G7 and the G20;[21] it is the tenth-largest exporter in the world, with $632 billion exported in 2019. Its closest trade ties are with the other countries of the European Union, with whom it conducts about 59% of its total trade. The largest trading partners, in order of market share in exports, are Germany (12.5%), France (10.3%), the United States (9%), Spain (5.2%), the United Kingdom (5.2%) and Switzerland (4.6%).[22]
In the post-World War II period, Italy saw a transformation from an agricultural based economy which had been severely affected by the consequences of the World Wars, into one of the world's most advanced nations,[23] and a leading country in world trade and exports. According to the Human Development Index, the country enjoys a very high standard of living. According to The Economist, Italy has the world's 8th highest quality of life.[24] Italy owns the world's third-largest gold reserve,[25] and is the third-largest net contributor to the budget of the European Union. Furthermore, the advanced country private wealth is one of the largest in the world.[26] In terms of private wealth, Italy ranks second, after Hong Kong, in private wealth to GDP ratio.
Italy is a large manufacturer (overall the second in the EU, behind Germany)[27] and exporter[28] of a significant variety of products. Its products include machinery, vehicles, pharmaceuticals, furniture, food and clothing.[29] Italy has therefore a significant trade surplus. The country is also well known for its influential and innovative business economic sector, an industrious and competitive agricultural sector (Italy is the world's largest wine producer),[30] and manufacturers of creatively designed, high-quality products: including automobiles, ships, home appliances, and designer clothing. Italy is the largest hub for luxury goods in Europe and the third luxury hub globally.[31][32]
Despite these important achievements, the country's economy today suffers from structural and non-structural problems. Annual growth rates have often been below the EU average. Italy was hit particularly hard by the late-2000s recession. Massive government spending from the 1980s onwards has produced a severe rise in public debt. In addition, Italian living standards have a considerable North–South divide: the average GDP per capita in Northern Italy significantly exceeds the EU average, while some regions and provinces in Southern Italy are significantly below the average. In Central Italy, GDP per capita is instead average.[33][34] In recent years, Italy's GDP per capita growth slowly caught-up with the Eurozone average,[35] while its employment rate still lags behind. However, economists dispute the official figures because of the large number of informal jobs (estimated to between 10% and 20% of the labour force) that lift the inactivity or unemployment rates.[36] The shadow economy is highly represented in Southern Italy, while it becomes less intense as one moves north. In real economic conditions, Southern Italy almost matches Central Italy's level.[37]
History[]
The economic history of Italy can be divided in three main phases:[38] an initial period of struggle after the unification of the country, characterised by high emigration and stagnant growth; a central period of robust catch-up from the 1890s to the 1980s, interrupted by the Great Depression of the 1930s and the two world wars; and a final period of sluggish growth that has been exacerbated by a double-dip recession following the 2008 global financial crush, and from which the country is slowly reemerging only in recent years.
Age of Industrialization[]
Prior to unification, the economy of the many Italian statelets was overwhelmingly agrarian; however, the agricultural surplus produced what historians call a "pre-industrial" transformation in North-western Italy starting from the 1820s,[39] that led to a diffuse, if mostly artisanal, concentration of manufacturing activities, especially in Piedmont-Sardinia under the liberal rule of the Count of Cavour.[40]
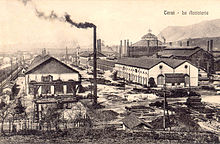
After the birth of the unified Kingdom of Italy in 1861, there was a deep consciousness in the ruling class of the new country's backwardness, given that the per capita GDP expressed in PPS terms was roughly half of that of Britain and about 25% less than that of France and Germany.[38] During the 1860s and 1870s, the manufacturing activity was backward and small-scale, while the oversized agrarian sector was the backbone of the national economy. The country lacked large coal and iron deposits[41] and the population was largely illiterate. In the 1880s, a severe farm crisis led to the introduction of more modern farming techniques in the Po valley,[42] while from 1878 to 1887 protectionist policies were introduced with the aim to establish a heavy industry base.[43] Some large steel and iron works soon clustered around areas of high hydropower potential, notably the Alpine foothills and Umbria in central Italy, while Turin and Milan led a textile, chemical, engineering and banking boom and Genoa captured civil and military shipbuilding.[44]
However, the diffusion of industrialisation that characterised the northwestern area of the country largely excluded Venetia and, especially, the South. The resulting Italian diaspora concerned up to 26 million Italians, the most part in the years between 1880 and 1914; by many scholars it is considered the biggest mass migration of contemporary times.[45] During the Great War, the still frail Italian state successfully fought a modern war, being able of arming and training some 5 million recruits.[46] But this result came at a terrible cost: by the end of the war, Italy had lost 700,000 soldiers and had a ballooning sovereign debt amounting to billions of lira.
Fascist regime[]
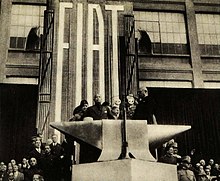
Italy emerged from World War I in a poor and weakened condition. The National Fascist Party of Benito Mussolini came to power in 1922, at the end of a period of social unrest. However, once Mussolini acquired a firmer hold of power, laissez-faire and free trade were progressively abandoned in favour of government intervention and protectionism.[47]
In 1929, Italy was hit hard by the Great Depression.[48] In order to deal with the crisis, the Fascist government nationalized the holdings of large banks which had accrued significant industrial securities, establishing the Istituto per la Ricostruzione Industriale.[49] A number of mixed entities were formed, whose purpose was to bring together representatives of the government and of the major businesses. These representatives discussed economic policy and manipulated prices and wages so as to satisfy both the wishes of the government and the wishes of business.[47]
This economic model based on a partnership between government and business was soon extended to the political sphere, in what came to be known as corporatism. At the same time, the aggressive foreign policy of Mussolini led to an increasing military expenditure. After the invasion of Ethiopia, Italy intervened to support Franco's nationalists in the Spanish Civil War. By 1939, Italy had the highest percentage of state-owned enterprises after the Soviet Union.[47]
Italy's involvement in World War II as a member of the Axis powers required the establishment of a war economy. The Allied invasion of Italy in 1943 eventually caused the Italian political structure – and the economy – to rapidly collapse. The Allies, on the one hand, and the Germans on the other, took over the administration of the areas of Italy under their control. By the end of the war, Italian per capita income was at its lowest point since the beginning of the 20th century.[50]
Post-war economic miracle[]
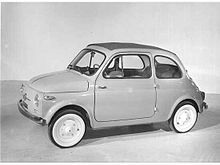
After the end of World War II, Italy was in rubble and occupied by foreign armies, a condition that worsened the chronic development gap towards the more advanced European economies. However, the new geopolitical logic of the Cold War made possible that the former enemy Italy, a hinge-country between Western Europe and the Mediterranean, and now a new, fragile democracy threatened by the NATO occupation forces, the proximity of the Iron Curtain and the presence of a strong Communist party,[52] was considered by the United States as an important ally for the Free World, and received under the Marshall Plan over US$1.2 billion from 1947 to 1951.
The end of aid through the Plan could have stopped the recovery but it coincided with a crucial point in the Korean War whose demand for metal and manufactured products was a further stimulus of Italian industrial production. In addition, the creation in 1957 of the European Common Market, with Italy as a founding member, provided more investment and eased exports.[53]
These favorable developments, combined with the presence of a large labour force, laid the foundation for spectacular economic growth that lasted almost uninterrupted until the "Hot Autumn's" massive strikes and social unrest of 1969–70, which then combined with the later 1973 oil crisis and put an abrupt end to the prolonged boom. It has been calculated that the Italian economy experienced an average rate of growth of GDP of 5.8% per year between 1951 and 1963, and 5% per year between 1964 and 1973.[53] Italian rates of growth were second only, but very close, to the German rates, in Europe, and among the OEEC countries only Japan had been doing better.[54]
The 1970s and 1980s: from stagflation to "il sorpasso"[]

The 1970s were a period of economic, political turmoil and social unrest in Italy, known as Years of lead. Unemployment rose sharply, especially among the young, and by 1977 there were one million unemployed people under age 24. Inflation continued, aggravated by the increases in the price of oil in 1973 and 1979. The budget deficit became permanent and intractable, averaging about 10 percent of the gross domestic product (GDP), higher than any other industrial country. The lira fell steadily, from 560 lira to the U.S. dollar in 1973 to 1,400 lira in 1982.[55]
The economic recession went on into the mid-1980s until a set of reforms led to the independence of the Bank of Italy[56] and a big reduction of the indexation of wages[57] that strongly reduced inflation rates, from 20.6% in 1980 to 4.7% in 1987.[58] The new macroeconomic and political stability resulted in a second, export-led "economic miracle", based on small and medium-sized enterprises, producing clothing, leather products, shoes, furniture, textiles, jewelry, and machine tools. As a result of this rapid expansion, in 1987 Italy overtook the UK's economy (an event known as il sorpasso), becoming the fourth richest nation in the world, after the US, Japan and West Germany.[59] The Milan stock exchange increased its market capitalization more than fivefold in the space of a few years.[60]
However, the Italian economy of the 1980s presented a problem: it was booming, thanks to increased productivity and surging exports, but unsustainable fiscal deficits drove the growth.[59] In the 1990s, the new Maastricht criteria boosted the urge to curb the public debt, already at 104% of GDP in 1992.[61] The consequent restrictive economic policies worsened the impact of the global recession already underway. After a brief recover at the end of the 1990s, high tax rates and red tape caused the country to stagnate between 2000 and 2008.[62][63]
Great Recession[]

Italy was among the countries hit hardest by the Great Recession of 2008–2009 and the subsequent European debt crisis. The national economy shrunk by 6.76% during the whole period, totaling seven-quarters of recession.[64] In November 2011 the Italian bond yield was 6.74 percent for 10-year bonds, nearing a 7 percent level where Italy is thought to lose access to financial markets.[65] According to Eurostat, in 2015 the Italian government debt stood at 128% of GDP, ranking as the second biggest debt ratio after Greece (with 175%).[66] However, the biggest chunk of Italian public debt is owned by Italian nationals and relatively high levels of private savings and low levels of private indebtedness are seen as making it the safest among Europe's struggling economies.[67][68] As a shock therapy to avoid the debt crisis and kick-start growth, the national unity government led by the economist Mario Monti launched a program of massive austerity measures, that brought down the deficit but precipitated the country in a double-dip recession in 2012 and 2013, receiving criticism from numerous economists.[69][70]
Economic recovery[]

In the period 2014-2019 the economy partially recovered from the disastrous losses incurred during the Great Recession, primarily thanks to strong exports, but nonetheless growth rates remained well below the Euro area average, meaning that Italy's GDP in 2019 was still 5 per cent below its level in 2008.[71]
Impact of the COVID-19 pandemic[]
Italy, starting from February 2020, was the first country of Europe to be severely affected by the COVID-19 pandemic,[72] that eventually expanded to the rest of the world. The economy suffered a massive shock as a result of the lockdown of most of the country's economic activity. After three months, at the end of May 2020, the epidemic was put under control, and the economy started to recover, especially the manufacturing sector. Overall, it remained surprisingly resilient, although GDP plummeted like in most western countries.[73][74] The Italian government issued special treasury bills, known as BTP Futura[75] as a COVID-19 emergency funding, waiting for the approval of the European Union response to the COVID-19 pandemic.[76] Eventually, in July 2020, the European Council approved the 750 billion € Next Generation EU fund,[77] of which €209 billion will go to Italy.[78]
Overview[]
Data[]
The following table shows the main economic indicators in 1980–2020. Inflation under 2% is in green.[79]
| Year | GDP (in bn. Euro) |
GDP per capita (in Euro) |
GDP growth (real) |
Inflation rate (in Percent) |
Unemployment (in Percent) |
Government debt (in % of GDP) |
|---|---|---|---|---|---|---|
| 1980 | 213.0 | 3,777 | 7.4% | n/a | ||
| 1981 | n/a | |||||
| 1982 | n/a | |||||
| 1983 | n/a | |||||
| 1984 | n/a | |||||
| 1985 | n/a | |||||
| 1986 | n/a | |||||
| 1987 | n/a | |||||
| 1988 | 93.0% | |||||
| 1989 | ||||||
| 1990 | ||||||
| 1991 | ||||||
| 1992 | ||||||
| 1993 | ||||||
| 1994 | ||||||
| 1995 | ||||||
| 1996 | ||||||
| 1997 | ||||||
| 1998 | ||||||
| 1999 | ||||||
| 2000 | ||||||
| 2001 | ||||||
| 2002 | ||||||
| 2003 | ||||||
| 2004 | ||||||
| 2005 | ||||||
| 2006 | ||||||
| 2007 | ||||||
| 2008 | ||||||
| 2009 | ||||||
| 2010 | ||||||
| 2011 | ||||||
| 2012 | ||||||
| 2013 | ||||||
| 2014 | ||||||
| 2015 | ||||||
| 2016 | ||||||
| 2017 | ||||||
| 2018[80] | ||||||
| 2019[81] | ||||||
| 2020[82] | ||||||
| 2021[83] |
Companies[]

Of the world's 500 largest stock-market-listed companies measured by revenue in 2016, the Fortune Global 500, nine are headquartered in Italy.[85]
| Rank (World) | Rank (Italy) | Company | Headquarters | Revenue (€bn) | Profit (€bn) | Employees (World) | Main sector |
|---|---|---|---|---|---|---|---|
| 19 | 1 | Fiat | Turin | 152.6 | 0.83 | 225,587 | Automotive |
| 49 | 2 | Generali Group | Trieste | 102.6 | 2.25 | 74,000 | Insurance |
| 65 | 3 | Eni | Rome | 93.0 | 1.33[86] | 80,911 | Petroleum |
| 78 | 4 | Enel | Rome | 83.9 | 2.44 | 62,080 | Electric utility |
| 224 | 5 | Intesa Sanpaolo | Turin | 42.2 | 3.04 | 90,807 | Banking |
| 300 | 6 | UniCredit | Milan | 34.6 | 1.88 | 117,659 | Banking |
| 305 | 7 | Poste italiane | Rome | 34.1 | 0.61 | 142,268 | Postal services |
| 404 | 8 | Telecom Italia | Milan | 26.6 | 0.44[87] | 66,025 | Telecommunications |
| 491 | 9 | Unipol | Bologna | 21.5 | 0.30 | 14,223 | Insurance |
Figures are for 2016. Figures in italic = Q3 2017
Wealth[]

Italy has over 1.4 million people with a net wealth greater than $1 million, a total national wealth of $11.857 trillion, and represents the 5th largest cumulative net wealth globally (it accounts for 4.92% of the net wealth in the world).[88] According to the Credit Suisse's Global Wealth Databook 2013, the median wealth per adult is $138,653 (5th in the world),[88] while according to the Allianz's Global Wealth Report 2013, the net financial wealth per capita is €45,770 (13th in the world).[89]
The following top 10 list of Italian billionaires is based on an annual assessment of wealth and assets compiled and published by Forbes in 2017.[90]
| Rank (World) | Rank (Italy) | Name | Net Worth ($bn) | Main source | Main sector |
|---|---|---|---|---|---|
| 29 | 1 | Maria Franca Fissolo Ferrero & family | 25.2 | Ferrero SpA | Food |
| 50 | 2 | Leonardo Del Vecchio | 17.9 | Luxottica | Eyewear |
| 80 | 3 | Stefano Pessina | 13.9 | Walgreens Boots | Pharmaceutical retail |
| 133 | 4 | Massimiliana Landini Aleotti | 9.5 | Menarini | Pharmaceutical |
| 199 | 5 | Silvio Berlusconi | 7.0 | Fininvest | Financial services |
| 215 | 6 | Giorgio Armani | 6.6 | Armani | Fashion |
| 250 | 7 | Augusto & Giorgio Perfetti | 5.8 | Perfetti Van Melle | Confectionery |
| 385 | 8 | Paolo & Gianfelice Rocca | 3.4 | Techint | Conglomerate |
| 474 | 9 | Giuseppe De'Longhi | 3.8 | De'Longhi | Small appliance |
| 603 | 10 | Patrizio Bertelli | 3.3 | Prada | Apparels |
Regional data[]

| Rank | Region | GDP €m | % of Nation | € per capita |
|---|---|---|---|---|
| – | 1,645,439 | 100.00 | 27,045 | |
| 1 | 357,200 | 21.71 | 35,885 | |
| 2 | 192,642 | 11.09 | 30,967 | |
| 3 | 151,634 | 9.21 | 30,843 | |
| 4 | 149,525 | 9.08 | 33,558 | |
| 5 | 127,365 | 7.74 | 28,870 | |
| 6 | 110,332 | 6.70 | 29,446 | |
| 7 | 100,544 | 6.11 | 17,187 | |
| 8 | 87,383 | 5.31 | 17,068 | |
| 9 | 72,135 | 4.38 | 17,166 | |
| 10 | 47,663 | 2.90 | 30,438 | |
| 11 | 40,593 | 2.47 | 25,971 | |
| 12 | 40,096 | 2.44 | 37,813 | |
| 13 | 35,669 | 2.17 | 29,147 | |
| 14 | 32,795 | 1.99 | 16,467 | |
| 15 | 32,592 | 1.98 | 24,160 | |
| 16 | 32,481 | 1.97 | 19,306 | |
| 17 | 21,438 | 1.30 | 23,735 | |
| 18 | 11,449 | 0.69 | 19,473 | |
| 19 | 6,042 | 0.36 | 18,891 | |
| 20 | 4,374 | 0.27 | 34,301 |
North–South divide[]
Since the unification of Italy in 1861, a wide and increasing economic divide has been growing between the northern provinces and the southern half of the Italian state. This gap was mainly induced by the region-specific policies selected by the Piedmontese elite, who dominated the first post-unitary governments.[93] To illustrate, the 1887 protectionist reform, instead of safeguarding the arboriculture sectors crushed by 1880s fall in prices, shielded the Po Valley wheat breeding and those Northern textile and manufacturing industries that had survived the liberal years thanks to state intervention.[94] While indeed the former dominated the allocation of military clothing contracts, the latter monopolized both coal mining permits and public contracts.[95] A similar logic guided the assignment of monopoly rights in the steamboat construction and navigation sectors and, above all, the public spending in the railway sector, which represented 53% of the 1861-1911 total.[96] To make things worse, the resources necessary to finance this public spending effort were obtained through highly unbalanced land property taxes, which affected the key source of savings available for investment in the growth sectors absent a developed banking system.[97] To elaborate, the 1864 reform fixed a 125 million target revenue to be raised from 9 districts resembling the pre-unitary states.[98] Given the inability of the government to estimate the land profitability, especially because of the huge differences among the regional cadasters, this policy irreparably induced large regional discrepancies.[98] To illustrate, the ex-Papal State (central Italy) took on the 10%, the ex-Kingdom of Two Sicilies (Southern Italy) the 40%, and the rest of the state (ex-Kingdom of Sardinia, Northern Italy) the 21%.[98] To weigh this burden down, a 20% surcharge was added by 1868.[98]
The 1886 cadastral reform opened the way to more egalitarian policies and, after the First World War, to the harmonization of the tax-rates, but the impact of extraction on the economies of the two blocks was at that point irreversible. While indeed a flourishing manufacturing sector was established in the North, the mix of low public spending and heavy taxation squeezed the Southern investment to the point that the local industry and export-oriented farming were wiped out.[99] Moreover, extraction destroyed the relationship between the central state and the Southern population by unchaining first a civil war called Brigandage, which brought about 20,000 victims by 1864 and the militarization of the area, and then favoring emigration, especially from 1892 to 1921.[100]
After the rise of Benito Mussolini, the "Iron Prefect" Cesare Mori tried to defeat the already powerful criminal organizations flourishing in the South with some degree of success. Fascist policy aimed at the creation of an Italian empire and Southern Italian ports were strategic for all commerce towards the colonies. With the invasion of Southern Italy, the Allies restored the authority of the mafia families, lost during the Fascist period, and used their influence to maintain public order.[101]
In the 1950s the Cassa per il Mezzogiorno was set up as a huge public master plan to help industrialize the South, aiming to do this in two ways: through land reforms creating 120,000 new smallholdings, and through the "Growth Pole Strategy" whereby 60% of all government investment would go to the South, thus boosting the Southern economy by attracting new capital, stimulating local firms, and providing employment. However, the objectives were largely missed, and as a result the South became increasingly subsidized and state dependent, incapable of generating private growth itself.[102]
Even at present, huge regional disparities persist. Problems in Southern Italy still include widespread political corruption, pervasive organized crime, and very high unemployment rates.[103] In 2007, it was estimated that about 80% of the businesses in the Sicilian cities of Catania and Palermo paid protection money;[104] thanks to grassroots movement like Addiopizzo, the mafia racket is slowly but constantly losing its effect.[105][106] The Italian Ministry of Interior reported that organized crime generated an estimated annual profit of €13 billion.[107]
Economic sectors[]
Primary[]

According to the last national agricultural census, there were 1.6 million farms in 2010 (−32.4% since 2000) covering 12.7 million hectares (63% of which are located in Southern Italy).[108] The vast majority (99%) are family-operated and small, averaging only 8 hectares in size.[108] Of the total surface area in agricultural use (forestry excluded), grain fields take up 31%, olive tree orchards 8.2%, vineyards 5.4%, citrus orchards 3.8%, sugar beets 1.7%, and horticulture 2.4%. The remainder is primarily dedicated to pastures (25.9%) and feed grains (11.6%).[108] The northern part of Italy produces primarily Maize corn, rice, sugar beets, soybeans, meat, fruits and dairy products, while the South specializes in wheat and citrus fruits. Livestock includes 6 million head of cattle, 8.6 million head of swine, 6.8 million head of sheep, and 0.9 million head of goats.[108] The total annual production of the fishing industry in Italy from capture and aquaculture, including crustaceans and molluscs, is around 480,000 tons.

Italy is the largest producer of wine in the world, and one of the leading producers of olive oil, fruits (apples, olives, grapes, oranges, lemons, pears, apricots, hazelnuts, peaches, cherries, plums, strawberries, and kiwifruits), and vegetables (especially artichokes and tomatoes). The most famous Italian wines are probably the Tuscan Chianti and the Piedmontese Barolo. Other famous wines are Barbaresco, Barbera d'Asti, Brunello di Montalcino, Frascati, Montepulciano d'Abruzzo, Morellino di Scansano, Amarone della Valpolicella DOCG and the sparkling wines Franciacorta and Prosecco. Quality goods in which Italy specialises, particularly the already mentioned wines and regional cheeses, are often protected under the quality assurance labels DOC/DOP. This geographical indication certificate, which is attributed by the European Union, is considered important to avoid confusion with low-quality mass-produced ersatz products.
Italian cuisine is one of the most popular and copied around the world.[111] The lack or total unavailability of some of its most characteristic ingredients outside of Italy, also and above all to falsifications (or food fraud), leads to the complete denaturalization of Italian ingredients.[112] This phenomenon, widespread in all continents, is better known as Italian Sounding, consisting in the use of words as well as images, colour combinations (the Italian tricolour), geographical references, brands evocative of Italy to promote and market agri-food products which in reality have nothing to do with Italian cuisine.[110] Italian Sounding invests almost every sector of Made in Italy food, from the most famous Italian cheeses to cured meats, from kinds of pasta to regional bread, from extra virgin olive oils to wines.[112] Counterfeit products violate registered trademarks or other distinctive signs protected by law such as the designations of origin (DOC, PDO, DOCG, PGI, TSG, IGT), therefore the counterfeiting is legally punishable.[113] However, Italian Sounding cannot be classified as illegal from a strictly legal standpoint, but they still represent "a huge damage to the Italian economy and to the potential resources of Made in Italy".[114] Two out of three Italian agri-food products sold worldwide are actually fakes that have nothing to do with Italian cuisine.[115] The Italian Sounding phenomenon is estimated to generate €55 billion worldwide annually.[116]
Secondary[]
Italy has a smaller number of global multinational corporations than other economies of comparable size, but it has a large number of small and medium-sized enterprises, many of them grouped in clusters, which are the backbone of the Italian industry.[117] This results in a manufacturing sector often focused on the export of niche market and luxury products, that is less capable of competing on quantity but is more capable of facing the competition of emerging economies based on lower labor costs, given the higher quality of its products.[118] The industrial districts are regionalized: in the Northwest there is a large modern group of industries, as in the so-called "industrial triangle" (Milan-Turin-Genoa), where there is an area of intense machinery, automotive, aerospace production and shipbuilding; in the Northeast, an area that experienced social and economic development mostly around family-based firms, there are mostly small and medium enterprises of lower technology but high craftsmanship, specializing in machinery, clothing, leather products, footwear, furniture, textiles, machine tools, spare parts, home appliances, and jewellery. Luxury cars such as Ferrari, Lamborghini, Maserati and Ducati motorcycles are also made in the Northeast's region of Emilia-Romagna. In central Italy there are mostly small and medium size companies specializing in products such as textiles, leather, jewelry but also machinery.[117][119]
Tertiary[]
The origins of modern banking can be traced to medieval and early Renaissance Italy, to the rich cities like Florence, Lucca, Siena, Venice and Genoa. The Bardi and Peruzzi families dominated banking in 14th-century Florence, establishing branches in many other parts of Europe.[120] One of the most famous Italian banks was the Medici Bank, set up by Giovanni di Bicci de' Medici in 1397.[121] The earliest known state deposit bank, the Bank of Saint George, was founded in 1407 in Genoa,[122] while Banca Monte dei Paschi di Siena, founded in 1472, is the oldest surviving bank in the world. Today, among the financial services companies, UniCredit is one of the largest bank in Europe by capitalization and Assicurazioni Generali is second largest insurance group in the world by revenue after AXA.
The following is a list of the main Italian banks and insurance groups ranked by total assets and gross premiums written.
- As of 31 December 2013
|
|
Infrastructure[]
Energy and natural resources[]


In the early 1970s Italy was a major producer of pyrites (from the Tuscan Maremma), asbestos (from the Balangero mines), fluorite (found in Sicily), and salt. At the same time, it was self-sufficient in aluminum (from Gargano), sulphur (from Sicily), lead, and zinc (from Sardinia).[124] By the beginning of the 1990s, however, it had lost all its world-ranking positions and was no longer self-sufficient in those resources. There are no substantial deposits of iron, coal, or oil. Moderate natural gas reserves, mainly in the Po Valley and offshore Adriatic Sea, have been discovered in recent years and constitute the country's most important mineral resource. Italy is one of the world's leading producers of pumice, pozzolana, and feldspar.[124] Another mineral resource for which Italy is well-known is marble, especially the world-famous white Carrara marble from the Massa and Carrara quarries in Tuscany. Most raw materials needed for manufacturing and more than 80% of the country's energy sources are imported (99.7% of the solid fuels demand, 92.5% of oil, 91.2% of natural gas and 13% of electricity).[125][126] Due to its reliance on imports, Italians pay approximately 45% more than the EU average for electricity.[127]
Italy has managed four nuclear reactors until the 1980s, but in 1987, after the Chernobyl disaster, a large majority of Italians passed a referendum opting for phasing out nuclear power in Italy. The government responded by closing existing nuclear power plants and stopping work on projects underway, continuing to work to the nuclear energy program abroad. The national power company Enel operates seven nuclear reactors in Spain (through Endesa) and four in Slovakia (through Slovenské elektrárne),[128] and in 2005 made an agreement with Électricité de France for a nuclear reactor in France.[127] With these agreements, Italy has managed to access nuclear power and direct involvement in design, construction, and operation of the plants without placing reactors on Italian territory.[127]
In the last decade, Italy has become one of the world's largest producers of renewable energy, ranking as the second largest producer in the European Union after Germany and the ninth in the world. The country is also the world's fifth largest producer of energy from solar power. Renewable sources account for the 27.5% of all electricity produced in Italy, with hydro alone reaching 12.6%, followed by solar at 5.7%, wind at 4.1%, bioenergy at 3.5%, and geothermal at 1.6%.[129] The rest of the national demand is covered by fossil fuels (38.2% natural gas, 13% coal, 8.4% oil) and by imports.[129]
Transportation[]

Italy was the first country in the world to build motorways, the so-called "autostrade", reserved for motor vehicles. The Milano-Laghi motorway, connecting Milan to Varese and now parts of the A8 and A9 motorways, was devised by Piero Puricelli, a civil engineer and entrepreneur. He received the first authorization to build a public-utility fast road in 1921, and completed the construction between 1924 and 1926. By the end of the 1930s, over 400 kilometers of multi- and dual-single-lane motorways were constructed throughout Italy, linking cities and rural towns. Today there are 668,721 km of serviceable roads in Italy, including 6,661 km of motorways (mostly toll roads, national and local roads), state-owned but privately operated mainly by Atlantia company.
The railway network is also extensive, especially in the north, totalizing 16,862 km of which 69% are electrified and on which 4,937 locomotives and railcars circulate. It is the 12th largest in the world, and is operated by state-owned Ferrovie dello Stato, while the rail tracks and infrastructure are managed by Rete Ferroviaria Italiana. While a number of private railroads exist and provide mostly commuter-type services, the national railway also provides sophisticated high-speed rail service that joins the major cities. The Florence–Rome high-speed railway was the first high-speed line opened in Europe when more than half of it opened in 1977. In 1991 the TAV was created for the planning and construction of high-speed rail lines along Italy's most important and saturated transport routes (Milan-Rome-Naples and Turin-Milan-Venice). High-speed trains include ETR-class trains, with the Frecciarossa 1000 reaching 400 km/h.
There are approximately 130 airports in Italy, of which 99 have paved runways (including the two hubs of Leonardo Da Vinci International in Rome and Malpensa International in Milan), and 43 major seaports including the Port of Genoa, the country's largest and the third busiest by cargo tonnage in the Mediterranean Sea. Due to the increasing importance of the maritime Silk Road with its connections to Asia and East Africa, the Italian ports for Central and Eastern Europe have become important in recent years. In addition, the trade in goods is shifting from the European northern ports to the ports of the Mediterranean Sea due to the considerable time savings and environmental protection. In particular, the deep water port of Trieste in the northernmost part of the Mediterranean Sea is the target of Italian, Asian and European investments.[130] The national inland waterway network comprises 1,477 km of navigable rivers and channels. In 2007 Italy maintained a civilian air fleet of about 389,000 units and a merchant fleet of 581 ships.[131]
Poverty[]
In 2015, poverty in Italy hit the highest levels in the previous 10 years. The level of absolute poverty for a two-person family was €1050.95/month. The poverty line per capita changed by region from €552.39/month to €819.13/month.The numbers of those in absolute poverty rose nearly an entire percent in 2015, from 6.8% in 2014, to 7.6% in 2015.[132] In Southern Italy the numbers are even higher, with 10% living in absolute poverty, up from 9 percent in 2014. Northern Italy is better off at 6.7%, but this is still an increase from 5.7% in 2014.[132]
The national statistics reporting agency, ISTAT, defines absolute poverty as those who can not buy goods and services which they need to survive. In 2015, the proportion of poor households in relative poverty also increased to 13.7 from 12.9 in 2014. ISTAT defines relative poverty as people whose disposable income is less than around half the national average. The unemployment rate in February 2016 remained at 11.7%, which has been the same for almost a year, but even having a job does not guarantee freedom from poverty.[133] Those who have at least one family member employed still suffer from 6.1% to 11.7% poverty, the higher number being for those who have factory jobs. The numbers are even higher for the younger generations because their unemployment rate is over 40%. Also, children are hit hard. In 2014, 32% of those aged 0–17 are at risk of poverty or social exclusion, which is one child out of three. While in the north the poverty rate is about the same as that of France and Germany, in the south it is almost double that figure. In the last ISTAT report, poverty is in decline.[134]
References[]
- ^ "World Economic Outlook Database, April 2019". IMF.org. International Monetary Fund. Retrieved 29 September 2019.
- ^ "World Bank Country and Lending Groups". datahelpdesk.worldbank.org. World Bank. Retrieved 29 September 2019.
- ^ "Population on 1 January". ec.europa.eu. Eurostat. Retrieved 23 August 2021.
- ^ a b c d e f g h "Report for Selected Countries and Subjects: October 2021". IMF. International Monetary Fund. Retrieved 14 October 2021.
- ^ a b c d e f g h i j "CIA World Factbook". CIA.gov. Central Intelligence Agency. Retrieved 1 February 2021.
- ^ "Poverta': Istat, in 2014 assoluta per 1,47 mln famiglie – Economia". ANSA.it. 14 March 2016.
- ^ "People at risk of poverty or social exclusion". ec.europa.eu. Eurostat. Retrieved 12 September 2019.
- ^ "Gini coefficient of equivalised disposable income - EU-SILC survey". ec.europa.eu. Eurostat. Retrieved 23 August 2021.
- ^ "Human Development Index (HDI)". hdr.undp.org. HDRO (Human Development Report Office) United Nations Development Programme. Retrieved 11 December 2019.
- ^ "Inequality-adjusted HDI (IHDI)". hdr.undp.org. UNDP. Retrieved 22 May 2020.
- ^ a b c "Labour market Q1 2021" (PDF). istat.it. Italian National Institute of Statistics. p. 2. Retrieved 23 August 2021.
- ^ a b "Unemployment rate by age group". data.oecd.org. OECD. Retrieved 8 September 2020.
- ^ "Ease of Doing Business in Italy". Doingbusiness.org. Retrieved 21 November 2017.
- ^ "Euromoney Institutional Investor Company". Retrieved 30 September 2017.
- ^ a b c d e f "Euro area and EU27 government deficit both at 0.6% of GDP" (PDF). ec.europa.eu/eurostat. Eurostat. Retrieved 28 April 2020.
- ^ "Development aid rises again in 2016 but flows to poorest countries dip". OECD. 1 April 2017. Retrieved 25 September 2017.
- ^ "Sovereigns Rating List". Standard & Poor's. Retrieved 26 May 2011.
- ^ Bufacchi, Isabella (16 October 2014). "Moody's confirms stable outlook on Italy's "Baa2" sovereign rating". Il Sole 24 Ore. Retrieved 8 February 2015.
- ^ "Fitch Affirms Italy at 'BBB+'; Outlook Stable". Reuters. 2 October 2014. Retrieved 24 October 2014.
- ^ "Scope revises the Outlook of Italy's BBB+ long-term credit ratings to Stable". . Retrieved 20 August 2021.
- ^ "Report for Selected Countries and Subjects". www.imf.org.
- ^ "CIA World Factbook: Italy". CIA. Retrieved 8 February 2015.
- ^ "Select Country or Country Groups". www.imf.org.
- ^ "The Economist Intelligence Unit's quality-of-life index" (PDF). The Economist. Retrieved 8 February 2015.
- ^ Stringa, Giovanni (5 January 2013). "Italia terza al mondo per riserve d'oro, per ogni cittadino dote di 1.650 euro". Corriere della Sera. Retrieved 6 February 2015.
- ^ "Quel bilancio Ue poco equilibrato". Il Sole 24 Ore. 1 February 2013. Retrieved 8 February 2015.
- ^ "Manufacturing statistics". Eurostat. November 2015. Retrieved 8 February 2015.
- ^ Workman, Daniel (27 December 2018). "Italy's Top 10 Exports". World's Top Exports.
- ^ Workman, Daniel (2 March 2019). "Top Industrial Robots Exporters". World's Top Exports.
- ^ a b Woodard, Richard (19 March 2013). "Italian wine now 22% of global market". Decanter. Retrieved 8 February 2015.
- ^ Gustafson, Krystina (31 December 2015). "The world's biggest luxury markets in 2015". www.cnbc.com.
- ^ Italy remains the third market for luxury goods
- ^ "REGIONAL ACCOUNTS YEARS 2017-2019" (PDF). ISTAT. 22 December 2020.
- ^ "Anno 2017 CONTI ECONOMICI TERRITORIALI" (PDF) (in Italian). ISTAT. 13 December 2018.
- ^ "GDP per capita growth (annual %) | Data". data.worldbank.org.
- ^ "In Italia 3,7 milioni di lavoratori in nero". LaStampa.it. 14 October 2016.
- ^ "Il Sud d'Italia e i settori che evadono di più". Il Sole 24 Ore (in Italian). 29 August 2019.
- ^ a b Toniolo, edited by Gianni (2013). The Oxford handbook of the Italian economy since unification. New York, NY: Oxford University Press. ISBN 9780199936694.CS1 maint: extra text: authors list (link)
- ^ Riall, Lucy (1999). The Italian risorgimento : state, society, and national unification (Repr. ed.). London [u.a.]: Routledge. p. 53. ISBN 978-0415057752.
- ^ Killinger, Charles L. (2002). The history of Italy ([Online-Ausg.] ed.). Westport, Conn. [u.a.]: Greenwood Press. p. 112. ISBN 978-0313314834.
- ^ Hildebrand, George Herbert (1965). Growth and Structure in the Economy of Modern Italy. Cambridge, Massachusetts: Harvard University Press. pp. 307–309.
- ^ Zamagni, Vera (1993). The economic history of Italy, 1860–1990 : from the periphery to the centre (Repr. ed.). [New York]: Clarendon Press. p. 64. ISBN 978-0198287735.
- ^ Kemp, Tom (1985). Industrialization in nineteenth-century Europe (2nd ed.). London: Longman. ISBN 978-0582493841.
- ^ Ciccarelli, Carlo; Fenoaltea, Stefano (July 2010). "Through the Magnifying Glass: Provincial Aspects of Industrial Growth in Post-Unification Italy" (PDF). Banca d'Italia. p. 4.
- ^ Cohen, Robin (1995). The Cambridge Survey of World Migration. Cambridge: Cambridge University Press. p. 114. ISBN 978-0-521-44405-7. Retrieved 8 February 2015.
- ^ Clark, Martin (1984). Modern Italy, 1871–1982. New York City: Longman. p. 186. ISBN 978-0-582-48361-3. Retrieved 8 February 2015.
- ^ a b c Knight, Patricia (2003). Mussolini and Fascism. New York City: Routledge. pp. 64–65. ISBN 978-0-415-27921-5. Retrieved 8 February 2015.
- ^ Welk, William G. (1938). Fascist Economy Policy: An Analysis of Italy's Economic Experiment. Cambridge: Harvard University Press. p. 166. Retrieved 8 February 2015.
- ^ Morgan, Philip (2003). Italian Fascism, 1915–1945. Basingstoke: Macmillan Publishers. p. 160. ISBN 978-0-333-94998-6. Retrieved 8 February 2015.
- ^ Lyttelton, Adrian (2002). Liberal and Fascist Italy, 1900–1945. Oxford: Oxford University Press. p. 13. ISBN 978-0-198-73198-6. Retrieved 8 February 2015.
- ^ Tagliabue, John (11 August 2007). "Italian Pride Is Revived in a Tiny Fiat". The New York Times. Retrieved 8 February 2015.
- ^ Hogan, Michael J. (1987). The Marshall Plan: America, Britain, and the reconstruction of Western Europe, 1947–1952. Cambridge: Cambridge University Press. pp. 44–45. ISBN 978-0-521-37840-6.
- ^ a b Crafts, Nicholas; Toniolo, Gianni (1996). Economic Growth in Europe Since 1945. Cambridge: Cambridge University Press. p. 428. ISBN 978-0-521-49627-8.
- ^ Di Nolfo, Ennio (1992). Power in Europe? Great Britain, France, Germany, and Italy, and the Origins of the EEC, 1952–57. Berlin: Walter de Gruyter. p. 198. ISBN 978-3-11-012158-2.
- ^ "Italy since 1945: Demographic and social change". Encyclopædia Britannica Online. Retrieved 8 February 2015.
- ^ Vicarelli, Fausto; Sylla, Richard; Cairncross, Alec (1988). Central banks' independence in historical perspective. Berlin: Walter de Gruyter. p. 180. ISBN 978-3110114409.
- ^ "Italy since 1945: The economy in the 1980s". Encyclopædia Britannica Online. Retrieved 8 February 2015.
- ^ "L'Italia in 150 anni. Sommario di statistiche storiche 1861–2010". ISTAT. Archived from the original on 9 February 2015. Retrieved 8 February 2015.
- ^ a b Vietor, Richard (1 April 2001). "Italy's Economic Half-Miracle". Strategy&. Retrieved 8 October 2014.
- ^ "Italian Stock Exchange: Main Indicators (1975–2012)". Borsa Italiana. Retrieved 8 February 2015.
- ^ "Italy: General government gross debt (Percent of GDP)". International Monetary Fund. Retrieved 8 October 2014.
- ^ Balcerowicz, Leszek (2013). Economic Growth in the European Union (PDF). Brussels: Lisbon Council. p. 13. ISBN 978-9-0902-7915-2. Archived from the original (PDF) on 14 July 2014. Retrieved 8 October 2014.
- ^ ""Secular stagnation" in graphics". The Economist. 19 November 2014. Retrieved 8 February 2015.
- ^ "Quarterly Growth Rates of real GDP, change over previous quarter". OECD. Retrieved 8 February 2015.
- ^ Moody, Barry; Mackenzie, James (8 November 2011). "Berlusconi to resign after parliamentary setback". Reuters. Retrieved 8 February 2015.
- ^ "General government gross debt". Eurostat. Retrieved 8 February 2015.
- ^ Auret, Lisa (18 May 2010). "Could Italy Be Better Off than its Peers?". CNBC. Archived from the original on 30 April 2011. Retrieved 30 May 2011.
- ^ Sanderson, Rachel (10 January 2011). "Italian deficit narrows in third quarter". Financial Times. Retrieved 16 July 2011.
- ^ Krugman, Paul (24 February 2013). "Austerity, Italian-Style". The New York Times. Retrieved 26 November 2017.
- ^ Orsi, Roberto. "The Demise of Italy and the Rise of Chaos". London School of Economics. Retrieved 26 November 2017.
- ^ "Italy exits recession as exports boost growth". Financial Times. 30 April 2019. Retrieved 6 December 2020.
- ^ "Coronavirus in Italia, i dati e la mappa". ilsole24ore.com. ilsole24ore.com. Retrieved 18 July 2020.
- ^ "L'Italia che riparte". ilsole24ore.com. ilsole24ore.com. Retrieved 18 July 2020.
- ^ "Why Can't Trump's America Be Like Italy?". nytimes.com. Retrieved 27 July 2020.
- ^ "BTP Futura – Prima Emissione". borsaitaliana.it. borsaitaliana.it. Retrieved 18 July 2020.
- ^ "Recovery Fund e bilancio: ecco le poste in gioco al Consiglio europeo". ilsole24ore.com. ilsole24ore.com. Retrieved 18 July 2020.
- ^ Special European Council, 17-21 July 2020 Retrieved 15 November 2020.
- ^ "EU recovery fund gives chance to 'change the face' of Italy". Reuters. 21 July 2020. Retrieved 2 September 2020.
- ^ "Report for Selected Countries and Subjects". www.imf.org. Retrieved 10 September 2018.
- ^ "Report for Selected Countries and Subjects". www.imf.org. Retrieved 25 December 2019.
- ^ "Report for Selected Countries and Subjects". www.imf.org. Retrieved 18 July 2020.
- ^ "Report for Selected Countries and Subjects". www.imf.org. Retrieved 27 July 2020.
- ^ "Report for Selected Countries and Subjects: October 2020". imf.org. International Monetary Fund. Retrieved 14 October 2020.
- ^ "Productivity – GDP per hour worked – OECD Data". theOECD.
- ^ Mehta, Stephanie (2016). "2016 Fortune Global 500". Fortune. Retrieved 26 November 2017.
- ^ "Results for the third quarter and the nine months of 2017". Eni. Retrieved 26 November 2017.
- ^ "Telecom Italia Q3 Profit Declines". Business Insider. Retrieved 26 November 2017.
- ^ a b "Global Wealth Databook 2013" (PDF). Credit Suisse. October 2013. Archived from the original (PDF) on 9 February 2015. Retrieved 9 February 2015.
- ^ "Global Wealth Report 2013" (PDF). Allianz. August 2013. Retrieved 9 February 2015.
- ^ "The World's Billionaires, 2017 Rankings". Forbes. 2017. Retrieved 26 November 2017.
- ^ "Gross domestic product (GDP) at current market prices by NUTS 2 regions". Retrieved 15 November 2017.
- ^ "Regional accounts: per capita values". Istituto Nazionale di Statistica. Retrieved 24 November 2017.
- ^ Duggan, Christopher (2008). The Force of Destiny: A History of Italy since 1796. New York, NY: Houghton Mifflin Company. p. 141.
- ^ Pescosolido, Guido. Unità Nazionale e Sviluppo Economico 1750–1913. Roma: Edizioni Nuova Cultura. pp. 64, 177–182, 202.
- ^ Pescosolido, Guido (2014). Unità Nazionale e Sviluppo Economico 1750–1913. Roma: Edizioni Nuova Cultura. pp. 182–184, 203.
- ^ Giovanni Iuzzolino, Guido Pellegrini and, Gianfranco Viesti. "Convergence among Italian Regions, 1861–2011".
- ^ Pescosolido, Guido (2014). Unità Nazionale e Sviluppo Economico 1750–1913. Roma: Edizioni Nuova Cultura. pp. 90–92, 118–120, 157.
- ^ a b c d Parravicini, Giannino (1958). La Politica Fiscale e le Entrate Effettive del Regno d'Italia 1860���1890. Turin: ILTE.
- ^ Pescosolido, Guido (2014). Unità Nazionale e Sviluppo Economico 1750–1913. Roma: Edizioni Nuova Cultura. pp. 254–269, 278–279.
- ^ Smith, Dennis M. (1997). Modern Italy: A Political History. Ann Arbor: University of Michigan Press. pp. 209–210. ISBN 978-0-472-10895-4.
- ^ Newark, Tim (2007). Mafia Allies: The True Story of America's Secret Alliance with the Mob in World War II. London: MBI Publishing Company. pp. 123–135. ISBN 978-0-7603-2457-8.
- ^ "Italy: The South". Encyclopædia Britannica Online. 3 February 2015. Retrieved 9 February 2015.
- ^ Astarita, Tommaso (2005). Between Salt Water and Holy Water: A History of Southern Italy. New York City: W. W. Norton & Company. ISBN 978-0-393-05864-2.
- ^ Kiefer, Peter (22 October 2007). "Mafia crime is 7% of GDP in Italy, group reports". The New York Times. Retrieved 9 February 2015.
- ^ Addiopizzo (30 October 2014). "Report on the activity of "Addiopizzo Catania"" (PDF). European Parliament. Retrieved 9 February 2015.
- ^ Kington, Tom (9 March 2008). "Shopkeepers revolt against Sicilian Mafia". The Guardian. Retrieved 9 February 2015.
- ^ "Gli investimenti delle mafie" (PDF). Programma Operativo Nazionale. Obiettivo Sud. 16 January 2013. Archived from the original (PDF) on 14 February 2015. Retrieved 9 February 2015.
- ^ a b c d "Censimento Agricoltura 2010". ISTAT. 24 October 2010. Retrieved 11 February 2015.
- ^ "Dal Prosek al Parmesan, le imitazioni delle eccellenze italiane nel mondo" (in Italian). Retrieved 30 November 2021.
- ^ a b "In cosa consiste l'Italian Sounding" (in Italian). Retrieved 30 November 2021.
- ^ "How pasta became the world's favourite food". bbc. 15 June 2011. Retrieved 28 September 2014.
- ^ a b "I finti prodotti italiani? Anche in Italia!" (in Italian). Retrieved 30 November 2021.
- ^ "Indagine conoscitiva sulle ricadute sul sistema agroalimentare italiano dell'accordo di partenariato transatlantico su commercio e investimenti (TTIP)" (in Italian). Retrieved 30 November 2021.
- ^ "Rapporto IPERICO sulla Lotta alla Contraffazione in Italia nel Settore Agroalimentare 2009-2012" (PDF) (in Italian). Retrieved 30 November 2021.
- ^ "Italian sounding: cos'è, come funziona e quali danni fa al made in Italy" (in Italian). Retrieved 30 November 2021.
- ^ "Italian sounding: giro di affari da 55 miliardi" (in Italian). Retrieved 17 December 2021.
- ^ a b Mignone, Mario B. (2008). Italy today: Facing the Challenges of the New Millennium. New York City: Lang Publishing. pp. 161–162. ISBN 978-1-4331-0187-8.
- ^ "Knowledge Economy Forum 2008: Innovative Small And Medium Enterprises Are Key To Europe & Central Asian Growth". World Bank. 19 May 2005. Retrieved 17 June 2008.
- ^ Friedman, Jonathan (2003). Globalization, the State, and Violence. Lanham: Rowman & Littlefield. p. 97. ISBN 978-0-7591-0280-4.
- ^ Hoggson, Noble F. (1926). Banking Through the Ages. New York City: Dodd, Mead and Company. p. 76. Retrieved 11 February 2015.
- ^ Goldthwaite, Richard A. (1995). Banks, Palaces, and Entrepreneurs in Renaissance Florence. Aldershot: Ashgate Publishing. ISBN 978-0-860-78484-5. Retrieved 11 February 2015.
- ^ Macesich, George (2000). Issues in Money and Banking. Westport: Greenwood Publishing Group. p. 42. ISBN 978-0-275-96777-2. Retrieved 12 March 2009.
- ^ a b "Leading Italian Companies". Mediobanca. October 2014. Retrieved 9 February 2015.
- ^ a b "Italy, the economy: Resources and power". Encyclopædia Britannica Online. 3 February 2015. Retrieved 9 February 2015.
- ^ Eurostat (2008). Energy, transport and environment indicators (PDF). EU Bookshop. ISBN 978-92-79-09835-2. Retrieved 10 May 2009.
- ^ Eurostat (2009). Panorama of Energy (PDF). EU Bookshop. ISBN 978-92-79-11151-8. Retrieved 10 May 2009.
- ^ a b c "Emerging Nuclear Energy Countries". World Nuclear Association. December 2014. Retrieved 11 February 2015.
- ^ "Nuclear Production". Enel. 31 December 2013. Archived from the original on 7 February 2015. Retrieved 11 February 2015.
- ^ a b "Rapporto Statistico sugli Impianti a fonti rinnovabili". Gestore dei Servizi Energetici. 19 December 2013. Archived from the original (PDF) on 18 October 2017. Retrieved 11 February 2015.
- ^ Marcus Hernig: Die Renaissance der Seidenstraße (2018) pp 112; Guido Santevecchi: Di Maio e la Via della Seta: «Faremo i conti nel 2020», siglato accordo su Trieste in Corriere della Sera: 5 November 2019; Trieste to become Hungary’s sea exit, The Budapest Business Journal, 21 June 2019; "Hamburger Hafenkonzern investiert groß in Triest" in Die Presse 29 September 2020; Linda Vierecke, Elisabetta Galla "Triest und die neue Seidenstraße" In: Deutsche Welle, 8 December 2020; Harry de Wilt: Is One Belt, One Road a China crisis for North Sea main ports? in World Cargo News, 17 December 2019.
- ^ Eurostat (2007). Panorama of Transport (PDF). European Commission. ISBN 978-92-79-04618-6. Retrieved 3 May 2009.
- ^ a b "Poverty in Italy" (PDF). National Institute of Statistics. Retrieved 1 December 2016.
- ^ "Unemployment by sex and age – monthly average". eurostat.ec. eurostat. Retrieved 2 December 2016.
- ^ "Italy: tackling child poverty and overcoming the crisis – European Platform for Investing in Children (EPIC) – European Union". europa.eu. Europa. Retrieved 2 December 2016.
Notes[]
External links[]
| Wikimedia Commons has media related to Economy of Italy. |
- Italian National Institute of Statistic (ISTAT)
- Italy – OECD
- Italy profile at The World Bank
- The leading international footwear exhibition (MICAM)
- Italian Business Facts
| History |
| |
|---|---|---|
| Industry and business |
| |
| Research |
| |
| Energy |
| |
| Trade and Infrastructure |
| |
| Taxation | ||
| Finance and banking |
| |
| Development | ||
| Events |
| |
| See also | ||
| ||
| ||||||||||||||||||||||||||||||||||||||||||||||||||||||||||

- Economy of Italy
- European Union member economies
- OECD member economies
- World Trade Organization member economies
- Economies of Europe by country