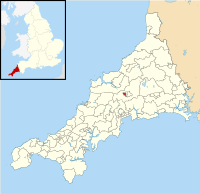
Bodmin St Mary's (electoral division)
| Bodmin St Mary's | |
|---|---|
| Former ward Cornwall Council. | |
 Boundary of Bodmin St Mary's in Cornwall from 2013-2021. | |
| County | Cornwall |
| 2013–2021 | |
| Number of councillors | One |
| Replaced by | |
| Created from | |
| Number of councillors | One |
Bodmin St Mary's was an electoral division of Cornwall in the United Kingdom which returned one member to sit on Cornwall Council between 2013 and 2021. It was abolished at the 2021 local elections, being succeeded by . It was also previously a ward of Cornwall County Council (as Bodmin St Marys) from 1985 to 2009.
Cornwall Council[]
Extent[]
The Cornwall Council division of Bodmin St Mary's represented the west of Bodmin, the hamlet of Dunmere and parts of the hamlet of St Lawrence (which was shared with Lanivet and Blisland), covering a total of 342 hectares.[1]
Election results[]
2017 election[]
| Party | Candidate | Votes | % | ±% | |
|---|---|---|---|---|---|
| Liberal Democrats | Jacquie Gammon | 507 | 48.7 | ||
| Conservative | Louise Garfield | 287 | 27.6 | N/A | |
| Labour | Joy Bassett | 247 | 23.7 | ||
| Majority | 220 | 21.1 | |||
| Turnout | 1041 | 28.4 | |||
| Liberal Democrats hold | Swing | ||||
2013 election[]
| Party | Candidate | Votes | % | ±% | |
|---|---|---|---|---|---|
| Liberal Democrats | Ann Kerridge | 602 | 56.4 | ||
| UKIP | Pete Walters | 212 | 19.9 | ||
| Mebyon Kernow | Roger Lashbrook | 176 | 16.5 | ||
| Labour | Janet Hulme | 77 | 7.2 | ||
| Majority | 390 | 36.6 | |||
| Turnout | 1067 | 27.4 | |||
| Liberal Democrats win (new seat) | |||||
Cornwall County Council[]
Election results[]
2005 election[]
| Party | Candidate | Votes | % | ±% | |
|---|---|---|---|---|---|
| Liberal Democrats | A. Kerridge | 1,477 | 54.2 | ||
| Independent | A. Quinnell | 465 | 17.1 | ||
| Conservative | J. Battersby | 419 | 15.4 | ||
| Labour | D. Acton | 364 | 13.4 | ||
| Majority | 1,012 | 37.1 | |||
| Turnout | 2725 | 52.8 | |||
| Liberal Democrats gain from Independent | Swing | ||||
2001 election[]
| Party | Candidate | Votes | % | ±% | |
|---|---|---|---|---|---|
| Independent | A. Quinnell | 1,843 | 79.1 | ||
| Conservative | M. Shelley | 487 | 20.9 | ||
| Majority | 1356 | 58.2 | |||
| Turnout | 2330 | 52.4 | |||
| Independent gain from Liberal Democrats | Swing | ||||
1997 election[]
| Party | Candidate | Votes | % | ±% | |
|---|---|---|---|---|---|
| Liberal Democrats | A. Quinnell | 2,278 | 77.5 | ||
| Labour | S. Davis | 661 | 22.5 | ||
| Majority | 1,617 | 55.0 | |||
| Turnout | 2939 | 63.6 | |||
| Liberal Democrats hold | Swing | ||||
1993 election[]
| Party | Candidate | Votes | % | ±% | |
|---|---|---|---|---|---|
| Liberal Democrats | A. Quinnell | 961 | 76.7 | ||
| Labour | M. Williams | 292 | 23.3 | ||
| Majority | 669 | 53.4 | |||
| Turnout | 1253 | 26.6 | |||
| Liberal Democrats gain from Alliance | Swing | ||||
1989 election[]
| Party | Candidate | Votes | % | ±% | |
|---|---|---|---|---|---|
| Alliance | A. Quinnell | 739 | 47.0 | ||
| Labour | F. Jordan | 632 | 40.2 | ||
| Independent | F. Wallace | 203 | 12.9 | ||
| Majority | 107 | 6.8 | |||
| Turnout | 1574 | 33.4 | |||
| Alliance hold | Swing | ||||
1985 election[]
| Party | Candidate | Votes | % | ±% | |
|---|---|---|---|---|---|
| Alliance | A. Quinnell | 669 | 53.9 | ||
| Labour | F. Jordan | 306 | 24.6 | ||
| Independent | F. Wallace | 267 | 21.5 | ||
| Majority | 363 | 29.2 | |||
| Turnout | 1242 | 27.3 | |||
| Alliance win (new seat) | |||||
References[]
- ^ "E05 Electoral Ward/Division Bodmin St Mary's". Office for National Statistics. Retrieved 15 May 2021.
- ^ "Election results for Bodmin St Mary's Cornwall Council elections - Thursday, 4th May, 2017". Cornwall Council. Retrieved 9 December 2020.
- ^ "Election results for Bodmin St Mary's Cornwall Council elections - Thursday, 2nd May, 2013". Cornwall Council. Retrieved 9 December 2020.
- ^ a b c d e f "Cornwall County Council Election Results 1973-2005" (PDF). Elections Centre. Retrieved 9 December 2020.
Categories:
- Bodmin
- Electoral divisions of Cornwall Council
- Electoral divisions of Cornwall County Council