Brighton Kemptown (UK Parliament constituency)

From Wikipedia, the free encyclopedia

Coordinates: 50°49′26″N 0°02′06″W / 50.824°N 0.035°W / 50.824; -0.035

Brighton Kemptown
Borough constituency
for the House of Commons
Outline map
Boundary of Brighton Kemptown in East Sussex
Outline map
Location of East Sussex within England
CountyEast Sussex
Population91,567 (2011 census)[1]
Electorate66,557 (December 2010)[2]
Major settlementsFalmer, Moulsecoomb, Rottingdean, Kemp Town, Peacehaven, Telscombe, Saltdean, Brighton Marina, Woodingdean, Queen's Park, Brighton, Bevendean and Whitehawk
Current constituency
Created1950
Member of ParliamentLloyd Russell-Moyle (Labour Co-op)
Created fromBrighton

Brighton Kemptown, often referred to as Brighton Kemptown and Peacehaven by local political parties,[3][4] is a constituency[n 1] represented in the House of Commons of the UK Parliament since 2017 by Lloyd Russell-Moyle, a Labour Co-op MP.[n 2]

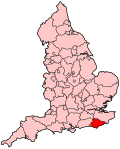
The constituency covers the eastern portion of the city of Brighton and Hove including Kemptown and part of the Lewes District.

Boundaries[]

Map of present boundaries

1950–1983: The County Borough of Brighton wards of Elm Grove, Hanover, King's Cliff, Lewes Road, Moulsecoomb, Pier, Queen's Park, Rottingdean, and St John's.

1983–1997: The Borough of Brighton wards of Hanover, King's Cliff, Marine, Moulsecoomb, Queen's Park, Rottingdean, Tenantry, and Woodingdean.

1997–2010: The Borough of Brighton wards of King's Cliff, Marine, Moulsecoomb, Queen's Park, Rottingdean, Tenantry, and Woodingdean, and the District of Lewes wards of East Saltdean, Peacehaven East, Peacehaven North, Peacehaven West, and Telscombe Cliffs.

2010–present: The City of Brighton and Hove wards of East Brighton, Moulsecoomb and Bevendean, Queen's Park, Rottingdean Coastal, and Woodingdean, and the District of Lewes wards of East Saltdean and Telscombe Cliffs, Peacehaven East, Peacehaven North, and Peacehaven West.

Constituency profile[]

The constituency takes in the eastern part of Brighton and semi-rural suburbs and villages stretching out to the east. From west to east it includes Queen's Park; Kemptown, the centre of Brighton's homosexual community; the council estates of Whitehawk and Moulsecoomb; and beyond the racecourse affluent and genteel coastal villages like Rottingdean, Woodingdean, Saltdean and the town of Peacehaven.

History[]

History of boundaries

This constituency was created in 1950 when the two-member constituency of Brighton was split into three single-member seats.

Boundary changes for the 1997 general election moved Peacehaven, a semi-rural area, into the constituency. This added a ward where the Conservatives had been favoured, but Labour gained the seat at its landslide victory. Des Turner held it until 2010, when Simon Kirby of the Conservative Party won it.

History of results

For a total of 48 years since the seat's creation, it has been Conservative-controlled (1950–1964; 1970–1997; 2010–2017). The only other party to hold the seat since its creation has been the Labour Party.

Labour first won Kemptown in 1964, with a narrow majority of just seven votes[n 3]. Dennis Hobden, the first Labour MP to ever be elected in Sussex, increased his majority in 1966, but lost the seat in 1970, and another Labour MP was not returned until 1997. The seat was a national bellwether constituency from 1979-2015, but in 2017 elected a Labour MP when the country as a whole returned a hung parliament with the Conservatives being the largest party by a margin of 56 MPs.

Liberal Democrats and their two predecessor parties following national trends formed the third-largest party in the constituency, 1950–2010 inclusive. The 2010 general election result for the party can be seen as 0.6% behind "its" highest, at 18.6%, if including its SDP forerunner. The Liberal Democrat vote share collapsed to 3% in 2015 (behind UKIP and Green Party candidates) and remained at the 3% level in 2017 despite the absence of UKIP and Green candidates for the seat at that election.

The Green Party candidate finished in fourth place at the 2005, 2010 and 2015 elections, retaining their deposit each time, with vote shares ranging from 5.5% to 7.0%. The Greens did not field a candidate in 2017[5] and endorsed Labour, who subsequently gained the seat with a majority of just under 10,000 votes.

The 2015 general election result had made the seat the tenth-most marginal majority of the Conservative Party's 331 seats by percentage of majority.[6]

Members of Parliament[]

Election Member[7][8] Party
1950 Howard Johnson Conservative
1959 David James Conservative
1964 Dennis Hobden Labour
1970 Andrew Bowden Conservative
1997 Des Turner Labour
2010 Simon Kirby Conservative
2017 Lloyd Russell-Moyle Labour Co-op

Elections[]

Elections in the 2010s[]

General election 2019: Brighton Kemptown[9]
Party Candidate Votes % ±%
Labour Co-op Lloyd Russell-Moyle 25,033 51.6 -6.7
Conservative Joe Miller 16,972 35.0 -3.3
Liberal Democrats Ben Thomas 2,964 6.1 +3.1
Green Alexandra Phillips 2,237 4.6 New
Brexit Party Graham Cushway 1,327 2.7 New
Majority 8,061 16.6 -3.4
Turnout 48,533 69.5 -3.0
Labour Co-op hold Swing -1.6
General election 2017: Brighton Kemptown
Party Candidate Votes % ±%
Labour Co-op Lloyd Russell-Moyle 28,703 58.3 +19.1
Conservative Simon Kirby[10] 18,835 38.3 -2.4
Liberal Democrats Emily Tester[11] 1,457 3.0 ±0.0
Independent Doktor Haze[12] 212 0.4 New
Majority 9,868 20.0 N/A
Turnout 49,207 72.5 +5.7
Labour Co-op gain from Conservative Swing +10.8
General election 2015: Brighton Kemptown[13][14]
Party Candidate Votes % ±%
Conservative Simon Kirby[15] 18,428 40.7 +2.7
Labour Nancy Platts[15] 17,738 39.2 +4.3
UKIP Ian Buchanan[16] 4,446 9.8 +6.6
Green Davy Jones[15] 3,187 7.0 +1.5
Liberal Democrats Paul Chandler[17] 1,365 3.0 −15.0
Socialist (GB) Jacqueline Shodeke[18] 73 0.2 New
Independent Matthew Taylor [19] 69 0.2 New
Majority 690 1.5 −1.6
Turnout 45,306 66.8 +2.1
Conservative hold Swing -0.8
General election 2010: Brighton Kemptown[20]
Party Candidate Votes % ±%
Conservative Simon Kirby 16,217 38.0 +5.0
Labour Co-op Simon Burgess 14,889 34.9 −5.0
Liberal Democrats Juliet Williams 7,691 18.0 +1.5
Green Ben Duncan 2,330 5.5 −1.5
UKIP James Chamberlain-Webber 1,384 3.2 +1.3
TUSC Dave Hill 194 0.5 New
Majority 1,328 3.1 N/A
Turnout 42,705 64.7 +4.5
Conservative gain from Labour Swing +5.0

Elections in the 2000s[]

General election 2005: Brighton Kemptown[21]
Party Candidate Votes % ±%
Labour Des Turner 15,858 39.9 −7.9
Conservative Judith Symes 13,121 33.0 −2.3
Liberal Democrats Marina Pepper 6,560 16.5 +6.1
Green Simon Williams 2,800 7.0 +3.7
UKIP James Chamberlain-Webber 758 1.9 +0.5
Peace Caroline O'Reilly 172 0.4 New
Socialist Labour John McLeod 163 0.4 −0.5
Independent Elaine Cooke 127 0.3 New
Socialist Alternative Phil Clarke 113 0.3 New
Independent Gene Dobbs 47 0.1 New
Majority 2,737 6.9 -5.6
Turnout 39,719 60.2 +2.6
Labour hold Swing −2.8
General election 2001: Brighton Kemptown[22]
Party Candidate Votes % ±%
Labour Des Turner 18,745 47.8 +1.2
Conservative Geoffrey Theobald 13,823 35.3 −3.6
Liberal Democrats Janet Marshall 4,064 10.4 +0.7
Green Barney Miller 1,290 3.3 New
UKIP James Chamberlain-Webber 543 1.4 New
Socialist Labour John McLeod 364 0.9 +0.2
Free Party Dave Dobbs 227 0.6 New
ProLife Alliance Elaine Cooke 147 0.4 New
Majority 4,922 12.5 +4.8
Turnout 39,203 57.6 −13.0
Labour hold Swing

Elections in the 1990s[]

General election 1997: Brighton Kemptown[23]
Party Candidate Votes % ±%
Labour Des Turner 21,479 46.6 +14.0
Conservative Andrew Bowden 17,945 38.9 −13.9
Liberal Democrats Clive Gray 4,478 9.7 −4.2
Referendum David Inman 1,526 3.3 New
Socialist Labour Hannah Williams 316 0.7 New
Natural Law Jeremy Bowler 172 0.4 −0.1
Monster Raving Loony Lorrie Newman 123 0.3 New
Rainbow Dream Ticket Richard Darlow 93 0.2 New
Majority 3,534 7.7 N/A
Turnout 46,132 70.6 -5.5
Labour gain from Conservative Swing +14.0
General election 1992: Brighton Kemptown[24][25]
Party Candidate Votes % ±%
Conservative Andrew Bowden 21,129 48.1 −5.4
Labour Gill O. Haynes 18,073 41.2 +8.3
Liberal Democrats Paul D. Scott 4,461 10.2 −3.4
Natural Law Elizabeth J. Overall 230 0.5 New
Majority 3,056 6.9 −13.7
Turnout 43,893 76.1 +1.6
Conservative hold Swing −6.8

Elections in the 1980s[]

General election 1987: Brighton Kemptown[26]
Party Candidate Votes % ±%
Conservative Andrew Bowden 24,031 53.5 +2.4
Labour Steve Bassam 14,771 32.9 +3.3
Liberal Chris Berry 6,080 13.6 -5.0
Majority 9,260 20.6 -0.5
Turnout 44,882 74.5 +3.0
Conservative hold Swing
General election 1983: Brighton Kemptown[27]
Party Candidate Votes % ±%
Conservative Andrew Bowden 22,265 51.1
Labour R. Fitch 12,887 29.6
SDP D. T. Burke 8,098 18.6 New
National Front Ted Budden 290 0.7
Majority 9,378 21.5
Turnout 43,540 71.5
Conservative hold Swing

Elections in the 1970s[]

General election 1979: Brighton Kemptown
Party Candidate Votes % ±%
Conservative Andrew Bowden 25,512 53.6 +7.7
Labour Quintin Barry 17,504 36.8 -3.5
Liberal S. Osbourne 8,098 8.8 -4.3
National Front Valerie Tyndall 404 0.8 New
Majority 8,008 16.8 +11.2
Turnout 47,599 74.2 +1.9
Conservative hold Swing
General election October 1974: Brighton Kemptown
Party Candidate Votes % ±%
Conservative Andrew Bowden 21,725 45.9 -0.1
Labour Dennis Hobden 19,060 40.3 +2.2
Liberal S. Osbourne 6,214 13.1 -2.5
English National Harvey Holford 155 0.3 New
Marxist-Leninist (England) J. Buckle 125 0.3 0.0
Independent Brian Ralfe 47 0.1 New
Majority 2,665 5.6 -2.3
Turnout 47,326 72.3 -6.5
Conservative hold Swing
General election February 1974: Brighton Kemptown
Party Candidate Votes % ±%
Conservative Andrew Bowden 23,504 46.0 -3.3
Labour Dennis Hobden 19,484 38.1 -4.8
Liberal D. Hall 7,954 15.6 +7.8
Marxist-Leninist (England) J. Buckle 170 0.3 New
Majority 4,020 7.9 +1.5
Turnout 51,112 78.8 +3.8
Conservative hold Swing
General election 1970: Brighton Kemptown
Party Candidate Votes % ±%
Conservative Andrew Bowden 24,208 49.3 +0.1
Labour Dennis Hobden 21,105 42.9 -7.9
Liberal Oliver Moxon 3,833 7.8 New
Majority 3,103 6.4 N/A
Turnout 49,146 75.0 -5.1
Conservative gain from Labour Swing

Elections in the 1960s[]

General election 1966: Brighton Kemptown
Party Candidate Votes % ±%
Labour Dennis Hobden 24,936 50.8 +0.8
Conservative Andrew Bowden 24,105 49.2 -0.8
Majority 831 1.6 +1.6
Turnout 49,041 80.1 +7.9
Labour hold Swing
General election 1964: Brighton Kemptown
Party Candidate Votes % ±%
Labour Dennis Hobden 22,308 50.0 +6.4
Conservative David James 22,301 50.0 -6.4
Majority 7 0.0 N/A
Turnout 44,609 72.2 -1.6
              6 recounts
Labour gain from Conservative Swing

Elections in the 1950s[]

General election 1959: Brighton Kemptown
Party Candidate Votes % ±%
Conservative David James 25,411 56.4 0.0
Labour Lewis Cohen 19,665 43.6 0.0
Majority 5,746 12.8 0.0
Turnout 45,076 73.8 +3.8
Conservative hold Swing
General election 1955: Brighton Kemptown
Party Candidate Votes % ±%
Conservative Howard Johnson 23,142 56.4 -1.2
Labour Lewis Cohen 17,885 43.6 -0.8
Majority 5,257 12.8 +1.6
Turnout 41,027 70.0 -7.1
Conservative hold Swing
General election 1951: Brighton Kemptown
Party Candidate Votes % ±%
Conservative Howard Johnson 25,923 55.6 +6.8
Labour Lewis Cohen 20,726 44.4 +2.1
Majority 5,197 11.2 +4.7
Turnout 46,649 77.1 -0.9
Conservative hold Swing
General election 1950: Brighton Kemptown
Party Candidate Votes % ±%
Conservative Howard Johnson 22,431 48.8
Labour Joseph Huddart 19,430 42.3
Liberal Robert Michael Buckley 4,073 8.9
Majority 3,001 6.5
Turnout 45,934 78.0
Conservative hold Swing

See also[]

Notes[]

  1. ^ A borough constituency (for the purposes of election expenses and type of returning officer)
  2. ^ As with all constituencies, the constituency elects one Member of Parliament (MP) by the first past the post system of election at least every five years.
  3. ^ The majority of seven made Brighton Kemptown the most marginal seat in the country in 1964

References[]

  1. ^ "Brighton, Kemptown: Usual Resident Population, 2011". Neighbourhood Statistics. Office for National Statistics. Archived from the original on 3 February 2015. Retrieved 3 February 2015.
  2. ^ "Electorate Figures – Boundary Commission for England". 2011 Electorate Figures. Boundary Commission for England. 4 March 2011. Archived from the original on 6 November 2010. Retrieved 13 March 2011.
  3. ^ https://www.kemptownconservatives.com/
  4. ^ http://kemptownlabour.org.uk/
  5. ^ "Greens pull out of General Election contest in Brighton Kemptown". Brighton & Hove News. 27 April 2017. Retrieved 11 June 2017.
  6. ^ List of Conservative MPs elected in 2015 by % majority UK Political.info. Retrieved 2017-01-29
  7. ^ "Brighton Kemptown 1950-". Hansard 1803-2005. UK Parliament. Retrieved 2 February 2015.
  8. ^ Leigh Rayment's Historical List of MPs – Constituencies beginning with "K" (part 1)
  9. ^ "Brighton Kemptown Parliamentary constituency". BBC News. BBC. Retrieved 27 November 2019.
  10. ^ "MPs fire the election starting gun – and the contest begins in Brighton and Hove". 20 April 2017.
  11. ^ "Lib Dems confirm candidates in Hove and Brighton Kemptown and consult members on whether to stand aside in Brighton Pavilion". 24 April 2017.
  12. ^ "General election latest – 14 candidates stand for the three seats in Brighton and Hove". Brighton and Hove News. 11 May 2017.
  13. ^ "Election Data 2015". Electoral Calculus. Archived from the original on 17 October 2015. Retrieved 17 October 2015.
  14. ^ "Election results for Brighton Kemptown". city council web site. Brighton & Hove Council. 7 May 2015. Retrieved 8 May 2015.
  15. ^ Jump up to: a b c "UK ELECTION RESULTS". electionresults.blogspot.co.uk.
  16. ^ "Ian Buchanan". YourNextMP. Archived from the original on 22 January 2015. Retrieved 22 January 2015.
  17. ^ http://www.libdems.org.uk/general_election_candidates#South_East
  18. ^ "General Election - Campaign News". worldsocialism.org. Archived from the original on 20 January 2015. Retrieved 16 January 2015.
  19. ^ "Matt Taylor for Brighton Kemptown 2015". Archived from the original on 22 December 2014. Retrieved 25 November 2014.
  20. ^ "Election Data 2010". Electoral Calculus. Archived from the original on 26 July 2013. Retrieved 17 October 2015.
  21. ^ "Election Data 2005". Electoral Calculus. Archived from the original on 15 October 2011. Retrieved 18 October 2015.
  22. ^ "Election Data 2001". Electoral Calculus. Archived from the original on 15 October 2011. Retrieved 18 October 2015.
  23. ^ "Election Data 1997". Electoral Calculus. Archived from the original on 15 October 2011. Retrieved 18 October 2015.
  24. ^ "Election Data 1992". Electoral Calculus. Archived from the original on 15 October 2011. Retrieved 18 October 2015.
  25. ^ "Politics Resources". Election 1992. Politics Resources. 9 April 1992. Archived from the original on 24 July 2011. Retrieved 6 December 2010.
  26. ^ "Election Data 1987". Electoral Calculus. Archived from the original on 15 October 2011. Retrieved 18 October 2015.
  27. ^ "Election Data 1983". Electoral Calculus. Archived from the original on 15 October 2011. Retrieved 18 October 2015.
Sources

External links[]

Retrieved from ""