1955 United Kingdom general election
| |||||||||||||||||||||||||||||||||||||||||||||
All 630 seats in the House of Commons 316 seats needed for a majority | |||||||||||||||||||||||||||||||||||||||||||||
|---|---|---|---|---|---|---|---|---|---|---|---|---|---|---|---|---|---|---|---|---|---|---|---|---|---|---|---|---|---|---|---|---|---|---|---|---|---|---|---|---|---|---|---|---|---|
| Opinion polls | |||||||||||||||||||||||||||||||||||||||||||||
| Turnout | 76.8%, | ||||||||||||||||||||||||||||||||||||||||||||
| |||||||||||||||||||||||||||||||||||||||||||||
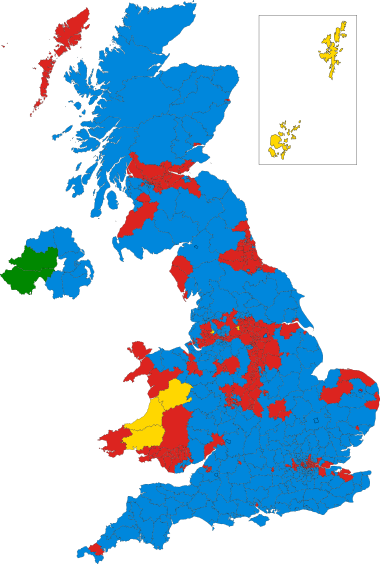 Colours denote the winning party—as shown in § Results | |||||||||||||||||||||||||||||||||||||||||||||
 Composition of the House of Commons after the election | |||||||||||||||||||||||||||||||||||||||||||||
| |||||||||||||||||||||||||||||||||||||||||||||

The 1955 United Kingdom general election was held on Thursday 26 May 1955, four years after the previous general election in 1951. It was a snap election: After Winston Churchill retired in April 1955, Anthony Eden took over and immediately called the election in order to gain a mandate for his government. It resulted in a majority of 60 seats for the government under new leader and Prime Minister Anthony Eden; the result remains the largest party share of the vote at a post-war general election. This was the first general election to be held with Elizabeth II as monarch, having succeeded her father George VI a year after the previous election.
The 1955 general election remains the most recent occasion that the Conservative Party won the most seats in Scotland, also winning a majority of the popular vote in that country. No party has since won a majority of the votes there, though the Scottish National Party came very close in 2015. This was also the last time the Conservatives did better in Scotland than in the United Kingdom as a whole.
|
|
Results[]
The election was fought on new boundaries, with five seats added to the 625 fought in 1951. On election day, the Daily Mirror had printed the front-page headline "Don't Let the Tories Cheat Our Children", urging its readers to elect Labour on the basis that it had "built a better Britain for us all" (Daily Mirror 2012).
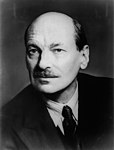
The BBC later described the election as one of the "dullest" after World War II.[1] The Daily Express wrote that the British people were more interested in Princess Margaret's romance with Peter Townsend.[2] The Labour Party, then in its twentieth year of leadership under Clement Attlee, steadily lost ground owing to infighting between the left-wing (Bevanites) and the right-wing (Gaitskellites), resulting in an unclear election message. It was the fifth and last general election fought by Labour leader Clement Attlee, who by this time was 72 years old. Eden had only become Leader of the Conservative Party a few weeks before the election, after the retirement of former Prime Minister Winston Churchill, but he had long been considered the heir apparent to the Conservative leadership. The Conservatives were hoping to take advantage of the end of food rationing and the positive atmosphere created by the coronation of Queen Elizabeth II in 1953. Eden himself was telegenic (although not as great a public speaker as Churchill) and gradual economic growth benefited the party greatly.[1]
The result showed very little change from 1951, with fewer than 25 seats changing hands and only a small swing from Labour to the Conservatives. The only real highlight of the night was in Northern Ireland, where Sinn Féin won two seats at a UK election for the first time since 1918 (before the partition of Ireland).
The Labour Party suffered at this time from deep internal divisions, yet for it this election was not the disaster it could have been.
Although little changed, this was a strong victory for the Conservatives, who won the largest share of the vote for a single party at a post-war general election.
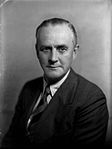
The Liberal Party had yet another poor performance, only slightly improving their popular vote total from the previous election, and again winning just six seats. Five of their six seats did not have Conservative challengers, as per local-level agreements to avoid vote-splitting which likely would have thrown the seats to Labour; the only Liberal candidate to be victorious against both Conservative and Labour challengers was Orkney and Shetland MP Jo Grimond, who was first elected in 1950. The poor national showing was widely viewed as the death knell for the embattled leadership of Clement Davies, who resigned the following year and was replaced by Grimond.
Future Labour leader Michael Foot lost his seat of Plymouth Devonport at this election; he returned for Ebbw Vale at a 1960 by-election.
For the first time, television took a prominent role in the campaign; this is the earliest UK general election of which television coverage survives (the 1950 and 1951 election nights were broadcast on television live, but the footage was not recorded). Only three hours of the coverage, presented by Richard Dimbleby, was kept; this was rebroadcast on BBC Parliament on the fiftieth and sixtieth anniversaries of the date of the election.

| 345 | 277 | 6 | 2 |
| Conservative | Labour | Lib | O |
| Candidates | Votes | ||||||||||
|---|---|---|---|---|---|---|---|---|---|---|---|
| Party | Leader | Stood | Elected | Gained | Unseated | Net | % of total | % | No. | Net % | |
| Conservative | Anthony Eden | 624 | 345 | 22 | 3 | +23 | 54.8 | 49.7 | 13,310,891 | +1.7 | |
| Labour | Clement Attlee | 620 | 277 | 4 | 21 | −18 | 44.0 | 46.4 | 12,405,254 | −2.4 | |
| Liberal | Clement Davies | 110 | 6 | 0 | 0 | 0 | 1.0 | 2.7 | 722,402 | +0.2 | |
| Sinn Féin | Paddy McLogan | 12 | 2 | 2 | 0 | +2 | 0.3 | 0.6 | 152,310 | +0.5 | |
| Plaid Cymru | Gwynfor Evans | 11 | 0 | 0 | 0 | 0 | 0.2 | 45,119 | +0.2 | ||
| Independent | N/A | 8 | 0 | 0 | 0 | 0 | 0.2 | 43,791 | +0.1 | ||
| Communist | Harry Pollitt | 17 | 0 | 0 | 0 | 0 | 0.1 | 33,144 | 0.0 | ||
| Irish Labour | William Norton | 1 | 0 | 0 | 1 | −1 | 0.1 | 16,050 | 0.0 | ||
| Independent Labour | N/A | 2 | 0 | 0 | 0 | 0 | 0.1 | 15,322 | N/A | ||
| SNP | Robert McIntyre | 2 | 0 | 0 | 0 | 0 | 0.1 | 12,112 | 0.0 | ||
| Ind. Labour Party | Annie Maxton | 2 | 0 | 0 | 0 | 0 | 0.0 | 3,334 | 0.0 | ||
| Government's new majority | 60 |
| Total votes cast | 26,759,729 |
| Turnout | 76.8% |
Votes summary[]
Seats summary[]
Selected declarations[]
- First declaration: Cheltenham (Con: 24,259, Lab: 16,638; Con hold)
- Prime Minister's seat: Warwick and Leamington (Con: 29,979, Lab: 16,513; Con hold)
Transfers of seats[]
- All comparisons are with the 1951 election.
- In some cases the change is due to the MP defecting to the gaining party. Such circumstances are marked with a *.
- In other circumstances the change is due to the seat having been won by the gaining party in a by-election in the intervening years, and then retained in 1955. Such circumstances are marked with a †. The parliament of 1951–55 only saw one by-election where a seat changed hands (Sunderland South), and unusually this was a gain for the party in government.
- 1 Sinn Féin winner overturned on petition for a criminal conviction. The second-placed Ulster Unionist candidate was also overturned by resolution of the House; eventually the 1956 by-election was held, which returned an Independent Unionist.
- 2 Sinn Féin winner overturned on petition for a criminal conviction. The second-placed candidate, an Ulster Unionist, was awarded the seat.
See also[]
- List of MPs elected in the 1955 United Kingdom general election
- 1955 United Kingdom general election in Northern Ireland
- 1955 United Kingdom local elections
Notes[]
- ^ Conservatives include 19 National Liberals and 10 Ulster Unionists.
References[]
- ^ Jump up to: a b (BBC News 2005)
- ^ "Palace Challenged To Deny Royal Romance". Sarasota Herald-Tribune. United Press. 30 May 1955. p. 8. Retrieved 7 November 2020.
- "1955: Eden given mandate", BBC News, 5 April 2005, retrieved 19 May 2018
- Craig, F. W. S. (1989), British Electoral Facts: 1832–1987, Dartmouth: Gower, ISBN 0900178302
- "General Election 2010 – A century of Daily Mirror front pages", Daily Mirror, 3 February 2012, retrieved 19 May 2018
Further reading[]
- Butler, David E. (1956), The British General Election of 1955, the standard studyCS1 maint: postscript (link)
External links[]
- United Kingdom election results—summary results 1885–1979 Archived 23 February 2008 at the Wayback Machine
Manifestos[]
- United for Peace and Progress: The Conservative and Unionist Party's Policy, 1955 Conservative Party manifesto
- Forward With Labour: Labour's Policy for the Consideration of the Nation, 1955 Labour Party manifesto
- Crisis Unresolved, 1955 Liberal Party manifesto
| hide | |
|---|---|
| General elections |
|
| Local elections |
|
| European elections | |
| Referendums |
|
- 1955 United Kingdom general election
- General elections to the Parliament of the United Kingdom
- 1955 elections in the United Kingdom
- May 1955 events