Bradford Central (UK Parliament constituency)
| Bradford Central | |
|---|---|
| Former Borough constituency for the House of Commons | |
| County | West Riding of Yorkshire |
| Major settlements | Bradford |
| 1885–1955 | |
| Number of members | One |
| Replaced by | Bradford North, Bradford East, Bradford South and Bradford West |
| Created from | Bradford |
Bradford Central was a parliamentary constituency in the city of Bradford, West Yorkshire, which returned one Member of Parliament (MP) to the House of Commons of the Parliament of the United Kingdom. Elections were held under the first-past-the-post voting system.
The constituency was created for the 1885 general election, when the Redistribution of Seats Act split the two-member Bradford constituency into three single-seat divisions. It was abolished for the 1955 general election.
Political history[]
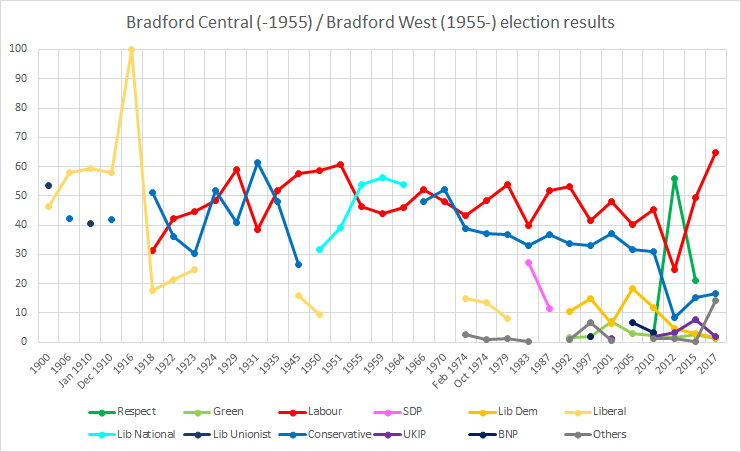
For most of its existence, Bradford Central was a marginal seat, initially between the Liberal Party and the Conservatives or their Liberal Unionist allies. The Liberals held it for all but eleven of the years from 1885 to 1918, after which it became a Labour-Conservative marginal. Control alternated between Labour and the Conservatives through the 1920s and 1930s, and in 1945 it became a safe seat for Labour.
Boundaries[]
1885–1918: The Municipal Borough of Bradford wards of Exchange, Lister Hills, Little Horton, North, and West.
1918–1950: The County Borough of Bradford wards of East, Exchange, Manningham, North, South, and West.
1950–1955: The County Borough of Bradford wards of Bradford Moor, Exchange, Manningham, North East, and South.
Members of Parliament[]
| Year | Member [1] | Party [2][3] | ||
|---|---|---|---|---|
| 1885 | William Forster | Liberal | ||
| George Shaw-Lefevre | Liberal | |||
| 1895 | James Wanklyn | Liberal Unionist | ||
| 1906 | Sir George Robertson | Liberal | ||
| 1916 | Sir James Hill | Liberal | ||
| 1918 | Henry Ratcliffe | Unionist | ||
| 1922 | William Leach | Labour | ||
| 1924 | Anthony Gadie | Unionist | ||
| 1929 | William Leach | Labour | ||
| 1931 | George Eady | Conservative | ||
| 1935 | William Leach | Labour | ||
| 1945 | Maurice Webb | Labour | ||
| 1955 | constituency abolished | |||
Elections[]
| Election | Political result | Candidate | Party | Votes | % | ±% | ||
|---|---|---|---|---|---|---|---|---|
| 1951 general election[4] Electorate: 49,625 Turnout: 41,558 (83.7%) −0.9 | Labour hold Majority: 8,872 (21.4%) −5.7 Swing: 2.8% from Lab to Conservative | Maurice Webb | Labour | 25,215 | 60.7 | +2.0 | ||
| Arthur Tiley | Conservative | 16,343 | 39.3 | +7.6 | ||||
| 1950 general election[5] Electorate: 49,935 Turnout: 42,260 (84.6%) +8.4 | Labour hold Majority: 11,447 (27.1%) −3.8 Swing: 2.0% from Lab to Conservative | Maurice Webb | Labour | 24,822 | 58.7 | +1.2 | ||
| T. Boyce | Conservative | 13,375 | 31.7 | +5.1 | ||||
| Charles Frederick Sarsby | Liberal | 4,063 | 9.6 | −6.3 | ||||
| 1945 general election[3] Electorate: 38,331 Turnout: 29,205 (76.2%) +10.2 | Labour hold Majority: 8,988 (30.9%) +27.3 Swing: 14.2% from Conservative to Lab | Maurice Webb | Labour | 16,764 | 57.5 | +6.7 | ||
| T. L. Dallas | Conservative | 7,776 | 26.6 | −21.6 | ||||
| Peter Edward Trench | Liberal | 4,665 | 15.9 | N/A | ||||
| 1935 general election[3] Electorate: 47,906 Turnout: 31,638 (66.0%) −12.2 | Labour gain from Conservative Majority: 1,156 (3.6%) Swing: 13.2% from Conservative to Lab | William Leach | Labour | 16,397 | 51.8 | +13.2 | ||
| George Eady | Conservative | 15,241 | 48.2 | −13.2 | ||||
| 1931 general election[3] Electorate: 51,996 Turnout: 40,673 (78.2%) −1.8 | Conservative gain from Labour Majority: 9,289 (22.8%) Swing: 20.4% from Lab to Conservative | George Eady | Conservative | 24,986 | 61.4 | +20.4 | ||
| William Leach | Labour | 15,687 | 38.6 | −20.4 | ||||
| 1929 general election[3] Electorate: 52,674 Turnout: 42,141 (80.0%) +3.5 | Labour gain from Unionist Majority: 7,611 (18.9%) Swing: 10.7% from Unionist to Lab | William Leach | Labour | 24,876 | 59.0 | +10.7 | ||
| Anthony Gadie | Unionist | 17,265 | 41.0 | −10.7 | ||||
| 1924 general election[3] Electorate: 45,127 Turnout: 34,506 (76.5%) +5.5 | Unionist gain from Labour Majority: 1,202 (3.4%) Swing: 8.8% from Lab to Unionist | Anthony Gadie | Unionist | 17,854 | 51.7 | +21.3 | ||
| William Leach | Labour | 16,652 | 48.3 | +3.7 | ||||
| 1923 general election[3] Electorate: 44,991 Turnout: 31,939 (71.0%) −4.4 | Labour hold Majority: 4,516 (14.2%) +7.9 Swing: 3.7% from Unionist to Lab | William Leach | Labour | 14,241 | 44.6 | +1.8 | ||
| Jonas Pearson | Unionist | 9,725 | 30.4 | −5.7 | ||||
| Rev. William Paxton | Liberal | 7,973 | 25.0 | +3.5 | ||||
| 1922 general election[3] Electorate: 44,689 Turnout: 75.4% (+0.7) | Labour gain from Unionist Majority: 2,125 (6.3%) Swing: 13.0% from Unionist to Lab | William Leach | Labour | 14,296 | 42.4 | +11.1 | ||
| Fred Denby Moore | Unionist | 12,171 | 36.1 | −14.9 | ||||
| Rev. William Paxton | Liberal | 7,250 | 21.5 | +3.8 | ||||
| 1918 general election[3] Electorate: 44,549 Turnout: 24,374 (54.7%) −27.1 | Coalition Conservative gain from Liberal Majority: 4,798 (19.7%) Swing: 27.7% from Lib to Conservative | Henry Butler Ratcliffe | Coalition Conservative | 12,434 | 51.0 | +9.0 | ||
| William Leach | Labour | 7,636 | 31.3 | N/A | ||||
| Sir James Hill, Bt | Liberal | 4,304 | 17.7 | −40.3 | ||||
| 1916 by-election[2] Death of Sir George Scott Robertson | Liberal hold | Sir James Hill, Bt | Liberal | unopposed | ||||
| December 1910 general election[2] Electorate: 9,848 Turnout: 8,058 (81.8%) −8.1 | Liberal hold Majority: 1,296 (16.0%) −2.6 Swing: 1.3% from Lib to Conservative | Sir George Scott Robertson | Liberal | 4,677 | 58.0 | −1.3 | ||
| G. H. R. Pauling | Conservative | 3,381 | 42.0 | +1.3 | ||||
| January 1910 general election[2] Electorate: 9,848 Turnout: 8,857 (89.9%) +4.0 | Liberal hold Majority: 1,641 (18.6%) +3.0 Swing: 1.5% from LibU to Lib | Sir George Scott Robertson | Liberal | 5,249 | 59.3 | +1.5 | ||
| Viscount Howick | Liberal Unionist | 3,608 | 40.7 | −1.5 | ||||
| 1906 general election[2] Electorate: 9,978 Turnout: 8,568 (85.9%) +3.1 | Liberal gain from Liberal Unionist Majority: 1,340 (15.6%) +8.4 Swing: 4.2% from LibU to Lib | Sir George Scott Robertson | Liberal | 4,954 | 57.8 | +4.2 | ||
| Vicary Gibbs[6] | Conservative | 3,614 | 42.2 | −4.2 | ||||
| 1900 general election[2] Electorate: 10,442 Turnout: 8,641 (82.8%) +5.2 | Liberal Unionist hold Majority: 627 (7.2%) +6.6 Swing: 3.3% from Lib to LibU | James Wanklyn | Liberal Unionist | 4,634 | 53.6 | +3.3 | ||
| A. Anderton | Liberal | 4,007 | 46.4 | −3.3 | ||||
| 1895 general election[2] Electorate: 10,316 Turnout: 7,917 (77.6%) −0.7 | Liberal Unionist gain from Liberal Majority: 41 (0.6%) Swing: 2.9% from Lib to LibU | James Wanklyn | Liberal Unionist | 4,024 | 50.3 | +2.9 | ||
| George Shaw-Lefevre | Liberal | 3,893 | 49.7 | −2.9 | ||||
| By-election, 23 August 1892[2][7] Sitting MP seeks re-election | Liberal hold | George Shaw-Lefevre | Liberal | unopposed | ||||
| 1892 general election[2] Electorate: 11,434 Turnout: 8,955 (78.3%) +4.3 | Liberal hold Majority: 465 (5.2%) −0.2 Swing: 0.1% from Lib to LibU | George Shaw-Lefevre | Liberal | 4,710 | 52.6 | −0.1 | ||
| Marquess of Lorne | Liberal Unionist | 4,245 | 47.4 | +0.1 | ||||
| 1886 general election[2] Electorate: 11,297 Turnout: 8,361 (74.0%) +2.9 | Liberal hold Majority: 459 (5.4%) −4.4 Swing: 2.2% from Lib to LibU | George Shaw-Lefevre | Liberal | 4,410 | 52.7 | −2.2 | ||
| Charles Norwood | Liberal Unionist | 3,951 | 47.3 | +2.2 | ||||
| [2] Death of William Edward Forster Electorate: 11,297 Turnout: 8,032 (71.1%) −8.6 | Liberal hold Majority: 780 (9.8%) −4.4 Swing: 3.7% from Lib to Conservative | George Shaw-Lefevre | Liberal | 4,407 | 54.9 | −3.7 | ||
| Edward Hoare | Conservative | 3,627 | 45.1 | +3.7 | ||||
| 1885 general election[2] New constituency Electorate: 11,297 Turnout: 9,007 (79.7%) | Liberal win Majority: 1,543 (17.2%) | William Edward Forster | Liberal | 5,275 | 58.6 | |||
| George Motley Waud | Conservative | 3,732 | 41.4 | |||||
References[]
- ^ Leigh Rayment's Historical List of MPs – Constituencies beginning with "B" (part 4)
- ^ a b c d e f g h i j k l Craig, F. W. S. (1989) [1974]. British parliamentary election results 1885–1918 (2nd ed.). Chichester: Parliamentary Research Services. p. 79. ISBN 0-900178-27-2.
- ^ a b c d e f g h i Craig, F. W. S. (1983) [1969]. British parliamentary election results 1918–1949 (3rd ed.). Chichester: Parliamentary Research Services. p. 99. ISBN 0-900178-06-X.
- ^ "UK General Election results October 1951, part 4". Richard Kimber's political science resources. Retrieved 9 July 2010.
- ^ "UK General Election results February 1950, part 4". Richard Kimber's political science resources. Retrieved 9 July 2010.
- ^ Vicary Gibbs had been the MP for St Albans from 1892 to 1904
- ^ The by-election in 1892 was caused by the appointment of George Shaw-Lefevre to the ministerial post of First Commissioner of Works. Until the 1920s, appointment as a minister required an MP to seek re-election.
- British Parliamentary Election Results 1885-1918, compiled and edited by F.W.S. Craig (The Macmillan Press 1974)
- Parliamentary constituencies in Yorkshire and the Humber (historic)
- Constituencies of the Parliament of the United Kingdom established in 1885
- Constituencies of the Parliament of the United Kingdom disestablished in 1955
- Politics of Bradford