1935 United Kingdom general election
| |||||||||||||||||||||||||||||||||||||||||||||||||
All 615 seats in the House of Commons 308 seats needed for a majority | |||||||||||||||||||||||||||||||||||||||||||||||||
|---|---|---|---|---|---|---|---|---|---|---|---|---|---|---|---|---|---|---|---|---|---|---|---|---|---|---|---|---|---|---|---|---|---|---|---|---|---|---|---|---|---|---|---|---|---|---|---|---|---|
| Turnout | 71.1%, | ||||||||||||||||||||||||||||||||||||||||||||||||
| |||||||||||||||||||||||||||||||||||||||||||||||||
 Colours denote the winning party—as shown
in § Results | |||||||||||||||||||||||||||||||||||||||||||||||||
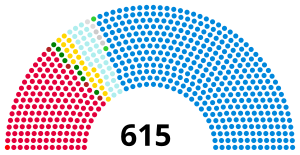
 Composition of the House of Commons after the election | |||||||||||||||||||||||||||||||||||||||||||||||||
| |||||||||||||||||||||||||||||||||||||||||||||||||


The 1935 United Kingdom general election was held on Thursday 14 November 1935 and resulted in a large, albeit reduced, majority for the National Government now led by Stanley Baldwin of the Conservative Party. The greatest number of members, as before, were Conservatives, while the National Liberal vote held steady. The much smaller National Labour vote also held steady but the resurgence in the main Labour vote caused over a third of their MPs, including National Labour leader Ramsay MacDonald, to lose their seats.
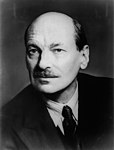
Labour, under what was then regarded internally as the caretaker leadership of Clement Attlee following the resignation of George Lansbury slightly over a month before, made large gains over their very poor showing at the 1931 general election, and saw their highest share of the vote yet. They made a net gain of over a hundred seats, thus reversing much of the ground lost in 1931. The Liberals continued a slow political decline, with their leader, Sir Herbert Samuel, losing his seat.
The Independent Labour Party stood entirely separately from Labour for the first time since 1895, having stood candidates unendorsed by Labour at the 1931 general election and having disaffiliated fully from Labour in 1932. The Scottish National Party contested their first general election, and the Communist Party gained the West Fife seat, their first in ten years. Major election issues were stubborn unemployment and the role of the League of Nations, particularly regarding the Empire of Japan.
No general elections were held in the Second World War until Allied victory was assured; hence the 1935 House sat until 1945. This parliament would see two leadership changes. Neville Chamberlain took over from Stanley Baldwin as Prime Minister and Tory Leader in 1937. He in turn resigned in 1940 in favour of Winston Churchill, who led the three main parties in Parliament in government for the war.
|
Results[]
| 387 | 33 | 8 | 1 | 154 | 21 | 11 |
| Conservative | LN | NL | N | Labour | Lib | O |
| Candidates | Votes | ||||||||||
|---|---|---|---|---|---|---|---|---|---|---|---|
| Party | Leader | Stood | Elected | Gained | Unseated | Net | % of total | % | No. | Net % | |
| National Government | |||||||||||
| Conservative | Stanley Baldwin | 515 | 387 | 5 | 88 | −83 | 62.9 | 47.8 | 10,025,083 | −7.2 | |
| Liberal National | John Simon | 44 | 33 | 5 | 7 | −2 | 5.4 | 3.7 | 784,608 | 0.0 | |
| National Labour | Ramsay MacDonald | 20 | 8 | 1 | 6 | −5 | 1.3 | 1.5 | 321,028 | 0.0 | |
| National | N/A | 4 | 1 | 1 | 4 | −3 | 0.2 | 0.3 | 53,189 | −0.2 | |
| National Government (total) | Stanley Baldwin | 583 | 429 | 12 | 139 | −125 | 69.8 | 51.8 | 11,183,908 | −15.4 | |
| Opposition | |||||||||||
| Labour | Clement Attlee | 552 | 154 | 105 | 3 | +102 | 25.0 | 38.0 | 7,984,988 | +7.4 | |
| Liberal | Herbert Samuel | 161 | 21 | 3 | 15 | −12 | 3.4 | 6.7 | 1,414,010 | −0.3 | |
| Ind. Labour Party | James Maxton | 17 | 4 | 4 | 0 | +4 | 0.7 | 0.7 | 136,208 | N/A | |
| Nationalist | Thomas J. Campbell | 2 | 2 | 0 | 0 | 0 | 0.3 | 0.2 | 50,747 | −0.1 | |
| Independent Republican | N/A | 3 | 0 | 0 | 0 | 0 | 0.0 | 0.2 | 46,715 | N/A | |
| Independent National | N/A | 2 | 2 | 0 | 0 | 0 | 0.3 | 0.2 | 33,527 | N/A | |
| SNP | Alexander MacEwen | 8 | 0 | 0 | 0 | 0 | 0.0 | 0.2 | 29,517 | 0.0 | |
| Ind. Conservative | N/A | 3 | 0 | 0 | 0 | 0 | 0.0 | 0.1 | 29,475 | N/A | |
| Communist | Harry Pollitt | 2 | 1 | 1 | 0 | 0 | 0.2 | 0.1 | 27,177 | −0.2 | |
| Independent | N/A | 5 | 2 | 1 | 0 | 0 | 0.3 | 0.1 | +0.1 | ||
| Independent Labour | N/A | 1 | 0 | 0 | 0 | 0 | 0.0 | 0.1 | 14,867 | 0.0 | |
| Liverpool Protestant | Harry Longbottom | 1 | 0 | 0 | 0 | 0 | 0.0 | 0.0 | 6,677 | 0.0 | |
| Independent Progressive | N/A | 1 | 0 | 0 | 0 | 0 | 0.0 | 0.0 | 6,421 | N/A | |
| Social Credit | John Hargrave | 3 | 0 | 0 | 0 | 0 | 0.0 | 0.0 | 10,376 | N/A | |
| Plaid Cymru | Saunders Lewis | 1 | 0 | 0 | 0 | 0 | 0.0 | 0.0 | 2,534 | 0.0 | |
| Independent Liberal | N/A | 1 | 0 | 0 | 0 | 0 | 0.0 | 0.0 | 2,525 | 0.0 | |
| Agriculturalist | N/A | 1 | 0 | 0 | 0 | 0 | 0.0 | 0.0 | 1,771 | N/A | |
| Christian Socialist | N/A | 1 | 0 | 0 | 0 | 0 | 0.0 | 0.0 | 1,480 | N/A | |
Votes summary[]
Seats summary[]
Transfers of seats[]
- All comparisons are with the 1931 election.
- In some cases the change is due to the MP defecting to the gaining party. Such circumstances are marked with a *.
- In other circumstances the change is due to the seat having been won by the gaining party in a by-election in the intervening years, and then retained in 1935. Such circumstances are marked with a †.
Constituency results[]
These are available on the Political Science Resources Elections Database, a link to which is given below.
See also[]
- List of MPs elected in the 1935 United Kingdom general election
- 1935 United Kingdom general election in Northern Ireland
References[]
- ^ Tetteh, Edmund (1 February 2008). "Election Statistics: UK 1918–2007". parliament.uk. Retrieved 5 May 2018.
Further reading[]
- Craig, F. W. S. (1989), British Electoral Facts: 1832–1987, Dartmouth: Gower, ISBN 0900178302
- Fry, Geoffrey K. (1991), "A Reconsideration of the British General Election of 1935 and the Electoral Revolution of 1945", History, 76 (246): 43–55, doi:10.1111/j.1468-229X.1991.tb01533.x
- Stannage, Tom (1980), Baldwin Thwarts the Opposition: The British General Election of 1935, London: Croom Helm, ISBN 0709903413
Manifestos[]
| General elections |
|
|---|---|
| Local elections |
|
| European elections | |
| Referendums |
|
- 1935 United Kingdom general election
- General elections to the Parliament of the United Kingdom
- 1935 elections in the United Kingdom
- November 1935 events
- 1935 in British politics