2003 United Kingdom local elections
| |||||||||||||||||||||||||||||||||||||||||
All 36 metropolitan boroughs, 40 out of 46 unitary authorities, 232 out of 238 English districts and all 32 Scottish council areas | |||||||||||||||||||||||||||||||||||||||||
|---|---|---|---|---|---|---|---|---|---|---|---|---|---|---|---|---|---|---|---|---|---|---|---|---|---|---|---|---|---|---|---|---|---|---|---|---|---|---|---|---|---|
| |||||||||||||||||||||||||||||||||||||||||

Local elections took place in various parts of the United Kingdom on 1 May 2003, the same day as the Scottish Parliamentary and the Welsh Assembly elections. There were local elections for all councils in Scotland and in most of England. There were no elections in Wales, Northern Ireland or London.
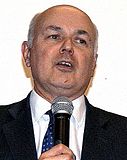
The ruling Labour Party lost a considerable 833 seats, while both the main opposition parties, Conservative and Liberal Democrat, polled strongly, with the Conservatives enjoying the largest share of the vote. Labour had now been in government for six years and still had a triple-digit majority, and over the summer of 2003 some opinion polls showed the Tories level with Labour. However, these were to be the last of the two local council elections contested by the Tories under the leadership of Iain Duncan Smith, who was ousted as leader later in the year and succeeded by Michael Howard due to his unpopularity as leader and doubts about his ability to win a general election.
Fifty-nine councils held electoral pilot schemes to try to boost turnout figures. Schemes included all postal voting, mobile polling stations, alterations to voting hours and various kinds of Electronic voting. The most successful in raising turnout was all-postal voting which saw turnout rise to an average of 50%. In comparison, turnout across the whole of England was only 33%.
Summary of results[]
The Labour party lost a considerable 833 seats, losing control of councils such as Birmingham and Coventry, both of which the party had controlled for 20 years.
The Conservative party, who following the elections had the most councillors in the country (ahead of Labour by 601), extended its lead over the Labour party by 1,399 councillors. However, their celebrations were tempered by the resignation of Conservative front bencher Crispin Blunt, who described the party leader, Iain Duncan Smith as a "handicap" and called for him to be replaced.[2]
| Party | Councils | Councillors | |||||||
|---|---|---|---|---|---|---|---|---|---|
| Gain | Loss | Change | Total | Gain | Loss | Change | Total | ||
| Conservative | +31 | 110 | +566 | 4,423 | |||||
| Labour | -28 | 66 | -833 | 3,001 | |||||
| Liberal Democrats | +5 | 28 | +193 | 2,624 | |||||
| Independent | -2 | 10 | -42 | 1,142 | |||||
| SNP | -1 | 1 | -21 | 182 | |||||
| Residents | 0 | 2 | 0 | 84 | |||||
| Green_Party_of_England_and Wales | 0 | 0 | +9 | 34 | |||||
| BNP | 0 | 0 | +13 | 13 | |||||
| Liberal | 0 | 0 | -2 | 9 | |||||
| Health Concern | 0 | 0 | -2 | 5 | |||||
| Scottish Socialist | 0 | 0 | -1 | 2 | |||||
| Other | 0 | 0 | 0 | 0 | -24 | 107 | |||
| No overall control | -5 | 123 | — | — | — | — | |||
England[]
Metropolitan boroughs[]
All 36 English Metropolitan borough councils had one third of their seats up for election.
| Council | Previous control | Result | Details | ||
|---|---|---|---|---|---|
| Barnsley | Labour | Labour hold | Details | ||
| Birmingham | Labour | No overall control gain | |||
| Bolton | Labour | No overall control gain | Details | ||
| Bradford | No overall control | No overall control hold | Details | ||
| Bury | Labour | Labour hold | Details | ||
| Calderdale | No overall control | No overall control hold | Details | ||
| Coventry | Labour | No overall control gain | Details | ||
| Doncaster | Labour | Labour hold | |||
| Dudley | Labour | No overall control gain | |||
| Gateshead | Labour | Labour hold | Details | ||
| Kirklees | No overall control | No overall control hold | |||
| Knowsley | Labour | Labour hold | Details | ||
| Leeds | Labour | Labour hold | Details | ||
| Liverpool | Liberal Democrats | Liberal Democrats hold | Details | ||
| Manchester | Labour | Labour hold | Details | ||
| Newcastle upon Tyne | Labour | Labour hold | |||
| North Tyneside | Labour | Labour hold | Details | ||
| Oldham | No overall control | Labour gain | |||
| Rochdale | Labour | No overall control gain | Details | ||
| Rotherham | Labour | Labour hold | |||
| St. Helens | Labour | Labour hold | Details | ||
| Salford | Labour | Labour hold | Details | ||
| Sandwell | Labour | Labour hold | Details | ||
| Sefton | No overall control | No overall control hold | Details | ||
| Sheffield | No overall control | Labour gain | Details | ||
| Solihull | Conservative | Conservative hold | Details | ||
| South Tyneside | Labour | Labour hold | Details | ||
| Stockport | Liberal Democrats | Liberal Democrats hold | |||
| Sunderland | Labour | Labour hold | Details | ||
| Tameside | Labour | Labour hold | |||
| Trafford | Labour | No overall control gain | Details | ||
| Wakefield | Labour | Labour hold | Details | ||
| Walsall | No overall control | No overall control hold | Details | ||
| Wigan | Labour | Labour hold | Details | ||
| Wirral | No overall control | No overall control hold | Details | ||
| Wolverhampton | Labour | Labour hold | Details | ||
Unitary authorities[]
Whole council[]
In 27 English Unitary authorities the whole council was up for election.
| Council | Previous control | Result | Details | ||
|---|---|---|---|---|---|
| Bath and North East Somerset | No overall control | No overall control hold | Details | ||
| Blackpool ‡ | Labour | Labour hold | Details | ||
| Bournemouth ‡ | No overall control | Liberal Democrats gain | Details | ||
| Bracknell Forest ‡ | Conservative | Conservative hold | |||
| Brighton & Hove ‡ | Labour | No overall control gain | Details | ||
| Darlington ‡ | Labour | Labour hold | |||
| East Riding of Yorkshire ‡ | No overall control | No overall control hold | |||
| Herefordshire ‡ | No overall control | No overall control hold | Details | ||
| Leicester ‡ | No overall control | No overall control hold | |||
| Luton ‡ | Labour | No overall control gain | |||
| Medway ‡ | No overall control | Conservative gain | |||
| Middlesbrough ‡ | Labour | Labour hold | |||
| North East Lincolnshire ‡ | Labour | No overall control gain | |||
| North Lincolnshire ‡ | Labour | Conservative gain | Details | ||
| North Somerset | Conservative | No overall control gain | Details | ||
| Nottingham ‡ | Labour | Labour hold | |||
| Plymouth ‡ | Conservative | Labour gain | Details | ||
| Poole ‡ | No overall control | Conservative gain | |||
| Redcar and Cleveland ‡ | Labour | No overall control gain | Details | ||
| Rutland ‡ | Independent | Conservative gain | |||
| South Gloucestershire | Liberal Democrats | No overall control gain | Details | ||
| Stockton-on-Tees | Labour | Labour hold | |||
| Telford and Wrekin ‡ | Labour | Labour hold | |||
| Torbay ‡ | Conservative | Liberal Democrats gain | |||
| West Berkshire ‡ | Liberal Democrats | No overall control gain | Details | ||
| Windsor and Maidenhead ‡ | No overall control | Liberal Democrats gain | Details | ||
| York ‡ | No overall control | Liberal Democrats gain | Details | ||
‡ New ward boundaries
Third of council[]
In 13 English Unitary authorities one third of the council was up for election.
| Council | Previous control | Result | Details | ||
|---|---|---|---|---|---|
| Bristol | Labour | No overall control gain | Details | ||
| Derby | Labour | No overall control gain | Details | ||
| Hartlepool | No overall control | No overall control hold | |||
| Kingston upon Hull | No overall control | No overall control hold | Details | ||
| Milton Keynes | Liberal Democrats | Liberal Democrats hold | Details | ||
| Portsmouth | No overall control | No overall control hold | Details | ||
| Reading | Labour | Labour hold | |||
| Slough | Labour | Labour hold | |||
| Southampton | No overall control | No overall control hold | Details | ||
| Southend-on-Sea | Conservative | Conservative hold | Details | ||
| Stoke-on-Trent | No overall control | No overall control hold | |||
| Swindon | No overall control | No overall control hold | Details | ||
| Wokingham | Conservative | Conservative hold | Details | ||
District councils[]
Whole council[]
In 150 English district authorities the whole council was up for election.
| Council | Previous control | Result | Details | ||
|---|---|---|---|---|---|
| Allerdale | Labour | No overall control gain | Details | ||
| Alnwick | No overall control | No overall control hold | Details | ||
| Arun ‡ | Conservative | Conservative hold | Details | ||
| Ashfield ‡ | Labour | No overall control gain | Details | ||
| Ashford ‡ | No overall control | Conservative gain | Details | ||
| Aylesbury Vale ‡ | No overall control | Conservative gain | Details | ||
| Babergh ‡ | No overall control | No overall control hold | Details | ||
| Berwick-upon-Tweed | Liberal Democrats | No overall control gain | |||
| Blaby ‡ | Conservative | Conservative hold | |||
| Blyth Valley | Labour | Labour hold | |||
| Bolsover ‡ | Labour | Labour hold | Details | ||
| Boston | No overall control | No overall control hold | |||
| Braintree ‡ | No overall control | No overall control hold | |||
| Breckland ‡ | Conservative | Conservative hold | Details | ||
| Bridgnorth ‡ | Independent | No overall control gain | |||
| Bromsgrove ‡ | Conservative | Conservative hold | |||
| Broxtowe ‡ | Labour | No overall control gain | |||
| Canterbury ‡ | No overall control | No overall control hold | Details | ||
| Caradon ‡ | No overall control | No overall control hold | |||
| Carrick ‡ | Liberal Democrats | Liberal Democrats hold | |||
| Castle Morpeth | No overall control | No overall control hold | |||
| Castle Point ‡ | Labour | Conservative gain | Details | ||
| Charnwood ‡ | No overall control | No overall control hold | |||
| Chelmsford ‡ | No overall control | Conservative gain | |||
| Chester-le-Street ‡ | Labour | Labour hold | |||
| Chesterfield ‡ | Labour | Liberal Democrats gain | |||
| Chichester ‡ | Conservative | Conservative hold | Details | ||
| Chiltern ‡ | Conservative | Conservative hold | |||
| Christchurch ‡ | Conservative | Conservative hold | Details | ||
| Copeland | Labour | Labour hold | Details | ||
| Corby | Labour | Labour hold | |||
| Cotswold ‡ | No overall control | Conservative gain | |||
| Dacorum | No overall control | Conservative gain | Details | ||
| Dartford ‡ | Labour | No overall control gain | Details | ||
| Derbyshire Dales ‡ | Conservative | Conservative hold | Details | ||
| Derwentside ‡ | Labour | Labour hold | |||
| Dover ‡ | No overall control | No overall control hold | Details | ||
| Durham ‡ | Labour | Liberal Democrats gain | |||
| Easington ‡ | Labour | Labour hold | |||
| East Cambridgeshire ‡ | Liberal Democrats | No overall control gain | |||
| East Devon ‡ | Conservative | Conservative hold | |||
| East Dorset ‡ | Conservative | Conservative hold | Details | ||
| East Hampshire ‡ | Conservative | Conservative hold | Details | ||
| East Hertfordshire | Conservative | Conservative hold | |||
| East Lindsey | Independent | No overall control gain | |||
| East Northamptonshire | Conservative | Conservative hold | Details | ||
| East Staffordshire ‡ | Labour | Conservative gain | |||
| Eden | Independent | Independent hold | |||
| Epsom and Ewell ‡ | Residents | Residents hold | |||
| Erewash ‡ | Labour | Conservative gain | Details | ||
| Fenland ‡ | Conservative | Conservative hold | Details | ||
| Forest Heath ‡ | Conservative | Conservative hold | |||
| Forest of Dean ‡ | Labour | No overall control gain | |||
| Fylde ‡ | No overall control | Conservative gain | Details | ||
| Gedling ‡ | Conservative | No overall control gain | Details | ||
| Gravesham ‡ | Labour | Labour hold | Details | ||
| Guildford ‡ | No overall control | Conservative gain | Details | ||
| Hambleton ‡ | Conservative | Conservative hold | |||
| Harborough ‡ | No overall control | No overall control hold | |||
| High Peak ‡ | Labour | No overall control gain | Details | ||
| Hinckley and Bosworth ‡ | No overall control | Conservative gain | Details | ||
| Horsham ‡ | Conservative | No overall control gain | |||
| Kennet ‡ | Conservative | Conservative hold | |||
| Kerrier ‡ | No overall control | No overall control hold | |||
| Kettering | Labour | Conservative gain | Details | ||
| King's Lynn and West Norfolk ‡ | No overall control | Conservative gain | |||
| Lancaster ‡ | No overall control | No overall control hold | Details | ||
| Lewes ‡ | Liberal Democrats | Liberal Democrats hold | |||
| Lichfield ‡ | Conservative | Conservative hold | |||
| Maldon ‡ | Conservative | Conservative hold | |||
| Malvern Hills ‡ | Conservative | No overall control gain | |||
| Mansfield ‡ | Labour | Independent gain | |||
| Melton ‡ | No overall control | Conservative gain | |||
| Mendip | No overall control | Conservative gain | |||
| Mid Bedfordshire ‡ | Conservative | Conservative hold | Details | ||
| Mid Devon ‡ | No overall control | No overall control hold | |||
| Mid Suffolk ‡ | No overall control | Conservative gain | |||
| Mid Sussex ‡ | Conservative | Conservative hold | |||
| New Forest ‡ | Conservative | Conservative hold | |||
| Newark and Sherwood ‡ | No overall control | No overall control hold | |||
| North Cornwall ‡ | Independent | Independent hold | |||
| North Devon ‡ | Liberal Democrats | Liberal Democrats hold | Details | ||
| North Dorset ‡ | No overall control | No overall control hold | |||
| North East Derbyshire ‡ | Labour | Labour hold | |||
| North Kesteven | No overall control | No overall control hold | |||
| North Norfolk ‡ | No overall control | Liberal Democrats gain | |||
| North Shropshire ‡ | Independent | No overall control gain | |||
| North Warwickshire ‡ | Labour | No overall control gain | |||
| North West Leicestershire ‡ | Labour | Labour hold | Details | ||
| North Wiltshire ‡ | No overall control | No overall control hold | |||
| Northampton | Labour | No overall control gain | Details | ||
| Oadby and Wigston ‡ | Liberal Democrats | Liberal Democrats hold | |||
| Oswestry ‡ | No overall control | No overall control hold | |||
| Restormel ‡ | No overall control | No overall control hold | Details | ||
| Ribble Valley ‡ | No overall control | Conservative gain | |||
| Richmondshire ‡ | No overall control | No overall control hold | Details | ||
| Rother ‡ | Conservative | Conservative hold | Details | ||
| Rushcliffe ‡ | Conservative | Conservative hold | |||
| Ryedale ‡ | No overall control | No overall control hold | Details | ||
| Salisbury ‡ | No overall control | Conservative gain | |||
| Scarborough ‡ | No overall control | Conservative gain | Details | ||
| Sedgefield ‡ | Labour | Labour hold | Details | ||
| Sedgemoor | Conservative | Conservative hold | Details | ||
| Selby ‡ | No overall control | Conservative gain | |||
| Sevenoaks ‡ | Conservative | Conservative hold | |||
| Shepway ‡ | Conservative | Liberal Democrats gain | |||
| South Bucks ‡ | Conservative | Conservative hold | |||
| South Derbyshire ‡ | Labour | Labour hold | |||
| South Hams | Conservative | Conservative hold | Details | ||
| South Holland | No overall control | Conservative gain | |||
| South Kesteven | No overall control | Conservative gain | Details | ||
| South Norfolk ‡ | Liberal Democrats | Liberal Democrats hold | |||
| South Northamptonshire | Conservative | Conservative hold | |||
| South Oxfordshire ‡ | No overall control | Conservative gain | Details | ||
| South Ribble ‡ | No overall control | No overall control hold | Details | ||
| South Shropshire ‡ | No overall control | No overall control hold | |||
| South Somerset | Liberal Democrats | Liberal Democrats hold | |||
| South Staffordshire ‡ | Conservative | Conservative hold | |||
| Spelthorne ‡ | Conservative | Conservative hold | |||
| St Edmundsbury ‡ | No overall control | Conservative gain | |||
| Stafford ‡ | No overall control | Conservative gain | |||
| Staffordshire Moorlands ‡ | No overall control | No overall control hold | |||
| Suffolk Coastal ‡ | Conservative | Conservative hold | |||
| Surrey Heath ‡ | Conservative | Conservative hold | |||
| Taunton Deane | No overall control | Conservative gain | |||
| Teesdale ‡ | No overall control | Independent gain | |||
| Teignbridge ‡ | No overall control | No overall control hold | |||
| Tendring ‡ | No overall control | No overall control hold | Details | ||
| Test Valley ‡ | Conservative | Conservative hold | |||
| Tewkesbury ‡ | No overall control | No overall control hold | |||
| Thanet ‡ | Labour | Conservative gain | |||
| Tonbridge and Malling ‡ | No overall control | Conservative gain | Details | ||
| Torridge ‡ | No overall control | No overall control hold | Details | ||
| Tynedale | No overall control | Conservative gain | Details | ||
| Uttlesford ‡ | No overall control | Liberal Democrats gain | |||
| Vale of White Horse ‡ | Liberal Democrats | Liberal Democrats hold | Details | ||
| Vale Royal | Labour | No overall control gain | |||
| Wansbeck | Labour | Labour hold | |||
| Warwick ‡ | No overall control | No overall control hold | |||
| Waverley ‡ | Conservative | Liberal Democrats gain | |||
| Wealden ‡ | Conservative | Conservative hold | Details | ||
| Wear Valley ‡ | Labour | Labour hold | |||
| Wellingborough | Labour | Conservative gain | Details | ||
| West Devon ‡ | No overall control | No overall control hold | |||
| West Dorset ‡ | No overall control | Conservative gain | |||
| West Somerset | Conservative | Conservative hold | Details | ||
| West Wiltshire ‡ | Liberal Democrats | No overall control gain | Details | ||
| Wychavon ‡ | Conservative | Conservative hold | Details | ||
| Wycombe ‡ | Conservative | Conservative hold | |||
| Wyre ‡ | Conservative | Conservative hold | Details | ||
‡ New ward boundaries
Third of council[]
In 82 English district authorities one third of the council was up for election.
| Council | Previous control | Result | Details | ||
|---|---|---|---|---|---|
| Adur | Conservative | Conservative hold | Details | ||
| Amber Valley | Conservative | Conservative hold | Details | ||
| Barrow-in-Furness | No overall control | Labour gain | Details | ||
| Basildon | No overall control | Conservative gain | Details | ||
| Basingstoke and Deane | No overall control | No overall control hold | Details | ||
| Bassetlaw | Labour | Labour hold | Details | ||
| Bedford | No overall control | No overall control hold | |||
| Brentwood | Liberal Democrats | No overall control gain | Details | ||
| Broadland | Conservative | Conservative hold | |||
| Broxbourne | Conservative | Conservative hold | Details | ||
| Burnley | Labour | Labour hold | Details | ||
| Cambridge | Liberal Democrats | Liberal Democrats hold | |||
| Cannock Chase | Labour | No overall control gain | |||
| Carlisle | No overall control | No overall control hold | Details | ||
| Cherwell | Conservative | Conservative hold | Details | ||
| Chester | No overall control | No overall control hold | |||
| Chorley | No overall control | No overall control hold | Details | ||
| Colchester | No overall control | No overall control hold | Details | ||
| Congleton | No overall control | Conservative gain | |||
| Craven | No overall control | No overall control hold | Details | ||
| Crawley | Labour | Labour hold | Details | ||
| Crewe and Nantwich | No overall control | No overall control hold | |||
| Daventry | Conservative | Conservative hold | Details | ||
| Eastbourne | Liberal Democrats | Liberal Democrats hold | Details | ||
| Eastleigh | Liberal Democrats | Liberal Democrats hold | Details | ||
| Ellesmere Port and Neston | Labour | Labour hold | Details | ||
| Elmbridge | Residents | Residents hold | |||
| Epping Forest | No overall control | No overall control hold | Details | ||
| Exeter | Labour | No overall control gain | Details | ||
| Gloucester | No overall control | No overall control hold | |||
| Great Yarmouth | Conservative | Conservative hold | Details | ||
| Harlow | No overall control | No overall control hold | Details | ||
| Harrogate | No overall control | No overall control hold | Details | ||
| Hart | Conservative | Conservative hold | Details | ||
| Havant | Conservative | Conservative hold | Details | ||
| Hertsmere | Conservative | Conservative hold | Details | ||
| Huntingdonshire | Conservative | Conservative hold | Details | ||
| Hyndburn | Labour | Conservative gain | Details | ||
| Ipswich | Labour | Labour hold | Details | ||
| Lincoln | Labour | Labour hold | Details | ||
| Macclesfield | Conservative | Conservative hold | |||
| Maidstone | No overall control | No overall control hold | Details | ||
| Mole Valley | No overall control | No overall control hold | Details | ||
| Newcastle-under-Lyme | No overall control | No overall control hold | Details | ||
| North Hertfordshire | Conservative | Conservative hold | |||
| Norwich | Liberal Democrats | Liberal Democrats hold | |||
| Pendle | No overall control | No overall control hold | Details | ||
| Penwith | No overall control | No overall control hold | Details | ||
| Preston | No overall control | No overall control hold | Details | ||
| Purbeck | Conservative | Conservative hold | Details | ||
| Redditch | No overall control | No overall control hold | Details | ||
| Reigate and Banstead | Conservative | Conservative hold | |||
| Rochford | Conservative | Conservative hold | Details | ||
| Rossendale | Labour | No overall control gain | Details | ||
| Rugby | No overall control | No overall control hold | Details | ||
| Runnymede | Conservative | Conservative hold | Details | ||
| Rushmoor | Conservative | Conservative hold | Details | ||
| Shrewsbury and Atcham | Conservative | Conservative hold | |||
| South Bedfordshire | Conservative | Conservative hold | |||
| South Cambridgeshire | No overall control | No overall control hold | |||
| South Lakeland | No overall control | No overall control hold | Details | ||
| St Albans | No overall control | No overall control hold | Details | ||
| Stevenage | Labour | Labour hold | Details | ||
| Stratford-on-Avon | No overall control | Conservative gain | Details | ||
| Stroud | Conservative | Conservative hold | Details | ||
| Swale | Conservative | Conservative hold | Details | ||
| Tamworth | Labour | Labour hold | Details | ||
| Tandridge | Conservative | Conservative hold | Details | ||
| Three Rivers | Liberal Democrats | Liberal Democrats hold | Details | ||
| Tunbridge Wells | Conservative | Conservative hold | Details | ||
| Watford | No overall control | Liberal Democrats gain | Details | ||
| Waveney | No overall control | No overall control hold | Details | ||
| Welwyn Hatfield | Conservative | Conservative hold | Details | ||
| West Lancashire | Conservative | Conservative hold | Details | ||
| West Lindsey | No overall control | No overall control hold | Details | ||
| West Oxfordshire | Conservative | Conservative hold | Details | ||
| Weymouth and Portland | No overall control | No overall control hold | Details | ||
| Winchester | Liberal Democrats | Liberal Democrats hold | Details | ||
| Woking | No overall control | No overall control hold | Details | ||
| Worcester | No overall control | Conservative gain | Details | ||
| Worthing | Liberal Democrats | No overall control gain | Details | ||
| Wyre Forest | No overall control | No overall control hold | Details | ||
Scotland[]
All 32 Scottish unitary authorities held elections. They were held at the same time as the 2003 Scottish Parliament election.
| Council | Previous control | Result | Details | ||
|---|---|---|---|---|---|
| Aberdeen | No overall control | No overall control hold | |||
| Aberdeenshire | No overall control | No overall control hold | |||
| Angus | SNP | SNP hold | Details | ||
| Argyll and Bute | Independent | Independent hold | Details | ||
| Clackmannanshire | SNP | Labour gain | |||
| Comhairle nan Eilean Siar | Independent | Independent hold | |||
| Dumfries and Galloway | No overall control | No overall control hold | |||
| Dundee | No overall control | No overall control hold | Details | ||
| East Ayrshire | Labour | Labour hold | Details | ||
| East Dunbartonshire | No overall control | No overall control hold | |||
| East Lothian | Labour | Labour hold | Details | ||
| East Renfrewshire | No overall control | No overall control hold | Details | ||
| Edinburgh | Labour | Labour hold | |||
| Falkirk | No overall control | No overall control hold | |||
| Fife | No overall control | No overall control hold | Details | ||
| Glasgow | Labour | Labour hold | Details | ||
| Highland | Independent | Independent hold | |||
| Inverclyde | No overall control | Liberal Democrats gain | Details | ||
| Midlothian | Labour | Labour hold | Details | ||
| Moray | Independent | Independent hold | Details | ||
| North Ayrshire | Labour | Labour hold | |||
| North Lanarkshire | Labour | Labour hold | Details | ||
| Orkney | Independent | Independent hold | |||
| Perth and Kinross | No overall control | No overall control hold | Details | ||
| Renfrewshire | No overall control | Labour gain | Details | ||
| Scottish Borders | No overall control | No overall control hold | Details | ||
| Shetland | Independent | Independent hold | |||
| South Ayrshire | Labour | No overall control gain | Details | ||
| South Lanarkshire | Labour | Labour hold | Details | ||
| Stirling | No overall control | Labour gain | |||
| West Dunbartonshire | No overall control | Labour gain | Details | ||
| West Lothian | Labour | Labour hold | Details | ||
Notes[]
References[]
- ^ "Tory leader hails poll gains". 2 May 2003 – via news.bbc.co.uk.
- ^ "Tory leader dismisses leadership threat". BBC News. 2 May 2003. Retrieved 27 June 2016.
- Vote 2003 BBC News
- Local elections 2003. House of Commons Library Research Paper 03/44.
- Voting Pilots in 2003
- The Guardian 2003 election coverage
| General elections |
|
|---|---|
| Local elections |
|
| European elections |
|
| Referendums |
|
- 2003 United Kingdom local elections
- Council elections in the United Kingdom
- 2003 elections in the United Kingdom