2003 Portsmouth City Council election
| |||||||||||||||||
14 of 42 seats to Portsmouth City Council 22 seats needed for a majority | |||||||||||||||||
|---|---|---|---|---|---|---|---|---|---|---|---|---|---|---|---|---|---|
| |||||||||||||||||
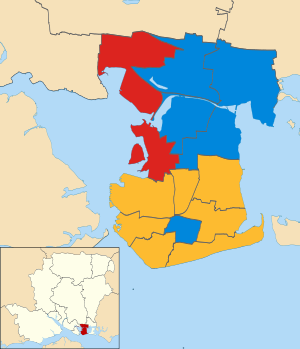 Results by Ward | |||||||||||||||||
| |||||||||||||||||
Elections to Portsmouth City Council were held on 1 May 2003. One third of the council was up for election and the council stayed under no overall control. Overall turnout was 26.6%.
After the election, the composition of the council was:
- Liberal Democrat 16
- Conservative 15
- Labour 11
Election result[]
| 2003 Portsmouth City Council election | ||||||||||
|---|---|---|---|---|---|---|---|---|---|---|
| Party | This election | Full council | This election | |||||||
| Seats | Net | Seats % | Other | Total | Total % | Votes | Votes % | +/− | ||
| Liberal Democrats | 7 | 50.0 | 9 | 16 | 38.1 | 13,281 | 35.3 | +5.6 | ||
| Conservative | 5 | 35.7 | 10 | 15 | 35.7 | 13,738 | 36.5 | -1.1 | ||
| Labour | 2 | 14.3 | 9 | 11 | 26.2 | 9,798 | 26.0 | -5.2 | ||
| Green | 0 | 0.0 | 0 | 0 | 0.0 | 360 | 1.0 | +0.3 | ||
| Independent | 0 | 0.0 | 0 | 0 | 0.0 | 254 | 0.7 | +0.4 | ||
| Socialist Alliance | 0 | 0.0 | 0 | 0 | 0.0 | 193 | 0.5 | +0.1 | ||
Ward results[]
Baffins[]
| Party | Candidate | Votes | % | ±% | |
|---|---|---|---|---|---|
| Liberal Democrats | Geoffrey Goble | 1,638 | 50.1 | ||
| Conservative | Neil Pettigrew | 1,055 | 32.2 | ||
| Labour | Simon Bramwell | 434 | 13.3 | ||
| Green | Sarah Coote | 145 | 4.4 | ||
| Majority | 583 | 17.9 | |||
| Turnout | 3,272 | 32.1 | |||
| Liberal Democrats hold | Swing | ||||
Central Southsea[]
| Party | Candidate | Votes | % | ±% | |
|---|---|---|---|---|---|
| Conservative | Deborah Tomes | 1,271 | 41.2 | ||
| Labour | Mark Button | 1,118 | 36.2 | ||
| Liberal Democrats | Edward Couldwell | 575 | 18.6 | ||
| Socialist Alliance | Timothy Evans | 121 | 3.9 | ||
| Majority | 153 | 5.0 | |||
| Turnout | 3,085 | 28.3 | |||
| Conservative gain from Labour | Swing | ||||
Charles Dickens[]
| Party | Candidate | Votes | % | ±% | |
|---|---|---|---|---|---|
| Liberal Democrats | Steven Wylie | 1,123 | 46.4 | ||
| Labour | John McIntyre | 874 | 36.1 | ||
| Conservative | Andrew Pursglove | 333 | 13.7 | ||
| Independent | Roland Woods | 92 | 3.8 | ||
| Majority | 249 | 10.3 | |||
| Turnout | 2,422 | 23.1 | |||
| Liberal Democrats gain from Labour | Swing | ||||
Copnor[]
| Party | Candidate | Votes | % | ±% | |
|---|---|---|---|---|---|
| Conservative | Alan Langford | 1,118 | 47.5 | ||
| Labour | Barbara Sparrow | 761 | 32.3 | ||
| Liberal Democrats | Jennifer Evans | 477 | 20.2 | ||
| Majority | 357 | 15.2 | |||
| Turnout | 2,356 | 23.5 | |||
| Conservative hold | Swing | ||||
Cosham[]
| Party | Candidate | Votes | % | ±% | |
|---|---|---|---|---|---|
| Conservative | Lee Mason | 1,048 | 40.6 | ||
| Labour | Stephen Reid | 936 | 36.3 | ||
| Liberal Democrats | Alan Webb | 596 | 23.1 | ||
| Majority | 108 | 4.3 | |||
| Turnout | 2,580 | 26.3 | |||
| Conservative gain from Labour | Swing | ||||
Drayton and Farlington[]
| Party | Candidate | Votes | % | ±% | |
|---|---|---|---|---|---|
| Conservative | Robin Sparshatt | 1,848 | 51.5 | ||
| Liberal Democrats | Patrick Whittle | 1,157 | 32.3 | ||
| Labour | Sonia Relf | 582 | 16.2 | ||
| Majority | 691 | 19.2 | |||
| Turnout | 3,587 | 36.6 | |||
| Conservative hold | Swing | ||||
Eastney and Craneswater[]
| Party | Candidate | Votes | % | ±% | |
|---|---|---|---|---|---|
| Liberal Democrats | Frederick Charlton | 1,410 | 48.6 | ||
| Conservative | Nicholas Lacey | 1,070 | 36.9 | ||
| Labour | June Clarkson | 419 | 14.5 | ||
| Majority | 340 | 11.7 | |||
| Turnout | 2,899 | 28.6 | |||
| Liberal Democrats hold | Swing | ||||
Fratton[]
| Party | Candidate | Votes | % | ±% | |
|---|---|---|---|---|---|
| Liberal Democrats | Eleanor Scott | 1,102 | 52.6 | ||
| Labour | Beverley Hancock | 545 | 26.0 | ||
| Conservative | Peter Ross | 450 | 21.5 | ||
| Majority | 557 | 26.6 | |||
| Turnout | 2,097 | 20.2 | |||
| Liberal Democrats hold | Swing | ||||
Hilsea[]
| Party | Candidate | Votes | % | ±% | |
|---|---|---|---|---|---|
| Conservative | Alistair Thompson | 1,281 | 45.1 | ||
| Labour | John Ferrett | 1,126 | 39.6 | ||
| Liberal Democrats | Hugh Mason | 435 | 15.3 | ||
| Majority | 155 | 5.5 | |||
| Turnout | 2,842 | 28.5 | |||
| Conservative hold | Swing | ||||
Milton[]
| Party | Candidate | Votes | % | ±% | |
|---|---|---|---|---|---|
| Liberal Democrats | Robert Vernon-Jackson | 1,547 | 51.3 | ||
| Conservative | Gerald Shimbart | 822 | 27.3 | ||
| Labour | Kenneth Ferrett | 372 | 12.3 | ||
| Independent | Nigel Sizer | 162 | 5.4 | ||
| Green | Andrea Smith | 112 | 3.7 | ||
| Majority | 725 | 24.0 | |||
| Turnout | 3,015 | 31.7 | |||
| Liberal Democrats hold | Swing | ||||
Nelson[]
| Party | Candidate | Votes | % | ±% | |
|---|---|---|---|---|---|
| Labour | Leo Madden | 987 | 46.5 | ||
| Conservative | Selina Corkerton | 717 | 33.8 | ||
| Liberal Democrats | James Bowden | 417 | 19.7 | ||
| Majority | 270 | 12.7 | |||
| Turnout | 2,121 | 20.5 | |||
| Labour hold | Swing | ||||
Paulsgrove[]
| Party | Candidate | Votes | % | ±% | |
|---|---|---|---|---|---|
| Labour | David Horne | 1,012 | 51.0 | ||
| Conservative | Luke Stubbs | 659 | 33.2 | ||
| Liberal Democrats | Michael Price | 211 | 10.6 | ||
| Green | Brian Bundy | 103 | 5.2 | ||
| Majority | 353 | 17.8 | |||
| Turnout | 1,985 | 19.7 | |||
| Labour hold | Swing | ||||
St Jude[]
| Party | Candidate | Votes | % | ±% | |
|---|---|---|---|---|---|
| Liberal Democrats | David Butler | 1,106 | 45.3 | ||
| Conservative | Malcolm Chewter | 1,033 | 42.3 | ||
| Labour | Matthew Gummerson | 304 | 12.4 | ||
| Majority | 73 | 3.0 | |||
| Turnout | 2,443 | 25.9 | |||
| Liberal Democrats gain from Conservative | Swing | ||||
St Thomas[]
| Party | Candidate | Votes | % | ±% | |
|---|---|---|---|---|---|
| Liberal Democrats | Leslie Stevens | 1,487 | 50.9 | ||
| Conservative | Elaine Shimbart | 1,033 | 35.4 | ||
| Labour | Alwin Oliver | 328 | 11.2 | ||
| Socialist Alliance | Paul Thatcher | 72 | 2.5 | ||
| Majority | 454 | 15.5 | |||
| Turnout | 2,920 | 28.3 | |||
| Liberal Democrats gain from Conservative | Swing | ||||
References[]
- 2003 Portsmouth election result
- Full results
- Ward turnouts Archived 27 September 2011 at the UK Government Web Archive
| Preceded by 2002 Portsmouth City Council election |
Portsmouth City Council elections | Succeeded by 2004 Portsmouth City Council election |
Categories:
- Portsmouth City Council elections
- 2003 English local elections
- 2000s in Hampshire