The 2003 Corby Borough Council election took place on 1 May 2003 to elect members of Corby Borough Council in Northamptonshire , England. The Labour Party retained overall control of the council, which it had held continuously since 1979.
Results Summary [ ] The overall results, using average ward votes for the total number of votes cast, were as follows:
Corby Borough Council Elections 2003: Summary Results
Party
Candidates
Votes
% Votes
Seats
% Seats
Change
Labour
29
7,118
40.3
18
62.1
-9
Conservative
18
6,397
36.2
9
31.0
+8
Liberal Democrats
10
3,189
18.0
2
+1
Independent
3
967
5.5
0
6.9
0
Total
60
16,740
29
Electorate
Turnout
(Vote counts shown are ward averages)
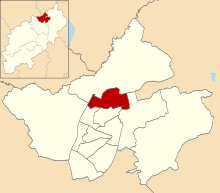
Ward-by-Ward Results [ ] Central Ward (3 seats) [ ]
Location of Central ward in Corby
Ward Summary
Party
Votes
% Votes
Seats
Change
Conservative
639
37.7
1
+1
Labour
612
36.1
2
-1
Liberal Democrats
444
26.2
0
0
Total Votes Cast
1,695
Electorate
Turnout
(Vote count shown is ward average)
Danesholme Ward (3 seats) [ ]
Location of Danesholme ward
Ward Summary
Party
Votes
% Votes
Seats
Change
Conservative
705
37.1
2
+2
Labour
597
31.5
0
-3
Liberal Democrats
596
31.4
1
+1
Total Votes Cast
1,898
Electorate
Turnout
(Vote count shown is ward average)
East Ward (2 seats) [ ]
Ward Summary
Party
Votes
% Votes
Seats
Change
Labour
567
68.1
2
0
Conservative
265
31.9
0
0
Total Votes Cast
832
Electorate
Turnout
(Vote count shown is ward average)
Hazlewood Ward (3 seats) [ ]
Location of Hazlewood ward
Ward Summary
Party
Votes
% Votes
Seats
Change
Labour
781
46.1
3
0
Conservative
474
27.9
0
0
Liberal Democrats
440
26.0
0
0
Total Votes Cast
1,695
Electorate
Turnout
(Vote count shown is ward average)
Hillside Ward (1 seat) [ ]
Location of Hillside ward
Ward Summary
Party
Votes
% Votes
Seats
Change
Labour
229
37.4
1
0
Liberal Democrats
213
34.7
0
0
Conservative
171
27.9
0
0
Total Votes Cast
613
Electorate
Turnout
(Vote count shown is ward average)
Kingswood Ward (3 seats) [ ]
Location of Kingswood ward
Ward Summary
Party
Votes
% Votes
Seats
Change
Labour
671
42.2
3
0
Conservative
502
31.6
0
0
Liberal Democrats
416
26.2
0
0
Total Votes Cast
743
Electorate
2,534
Turnout
29.3%
(Vote count shown is ward average)
Lloyds Ward (3 seats) [ ]
Ward Summary
Party
Votes
% Votes
Seats
Change
Labour
956
53.2
2
-1
Conservative
841
46.8
1
+1
Total Votes Cast
1,796
Electorate
Turnout
(Vote count shown is ward average)
Lodge Park (3 seats) [ ]
Location of Lodge Park ward
Ward Summary
Party
Votes
% Votes
Seats
Change
Conservative
892
41.7
1
+1
Labour
665
31.1
2
-1
Liberal Democrats
581
27.2
0
0
Total Votes Cast
2,138
Electorate
Turnout
(Vote count shown is ward average)
Rural East Ward (2 seats) [ ]
Location of Rural East ward
Ward Summary
Party
Votes
% Votes
Seats
Change
Conservative
675
60.3
2
+1
Independent
232
20.7
0
0
Labour
213
19.0
0
-1
Total Votes Cast
1,120
Electorate
Turnout
(Vote count shown is ward average)
Rural North Ward (1 seats) [ ]
Location of Rural North ward
Ward Summary
Party
Votes
% Votes
Seats
Change
Liberal Democrats
265
42.3
1
+1
Conservative
250
39.9
0
0
Labour
111
17.7
0
-1
Total Votes Cast
626
Electorate
Turnout
(Vote count shown is ward average)
Rural West Ward (1 seat) [ ]
Location of Rural West ward
Ward Summary
Party
Votes
% Votes
Seats
Change
Conservative
338
54.8
1
+1
Liberal Democrats
143
23.2
0
-1
Labour
136
22.0
0
0
Total Votes Cast
617
Electorate
Turnout
(Vote count shown is ward average)
(Background: Bob Rutt defected from the Liberal Democrats after the 1999 Borough Council elections)
Shire Lodge (2 seats) [ ]
Location of Shire Lodge ward
Ward Summary
Party
Votes
% Votes
Seats
Change
Labour
478
38.8
1
-1
Conservative
442
35.9
1
+1
Independent
311
25.3
0
0
Total Votes Cast
1,231
Electorate
Turnout
(Vote count shown is ward average)
West Ward (2 seats) [ ]
Ward Summary
Party
Votes
% Votes
Seats
Change
Labour
469
52.5
2
0
Independent
424
47.5
0
0
Total Votes Cast
893
Electorate
Turnout
(Vote count shown is ward average)
See also [ ] References [ ]
Metropolitan boroughs Unitary authorities District councils (England)Scottish councils National Assembly elections