Corby Borough Council elections
Corby Borough Council was elected every four years.
Political control[]
| Party in control | Years |
|---|---|
| Labour | 1973 - 1976 |
| Conservative | 1976 - 1979 |
| Labour | 1979 - 2021 |
Council elections[]
- 1973 Corby District Council election
- 1976 Corby District Council election (New ward boundaries)[1]
- 1979 Corby District Council election
- 1983 Corby District Council election
- 1987 Corby District Council election
- 1991 Corby District Council election
- 1995 Corby Borough Council election
- 1999 Corby Borough Council election (New ward boundaries)[2]
- 2003 Corby Borough Council election
- 2007 Corby Borough Council election (New ward boundaries)[3]
- 2011 Corby Borough Council election
- 2015 Corby Borough Council election (New ward boundaries)[4]
The scheduled 2019 elections were cancelled due to the creation of the new North Northamptonshire unitary authority in 2021.
Borough result maps[]

1976 results map
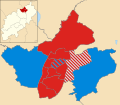
1979 results map

1983 results map

1987 results map
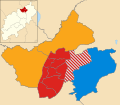
1991 results map
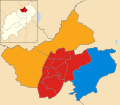
1995 results map
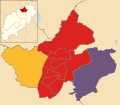
1999 results map
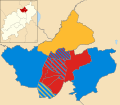
2003 results map

2007 results map
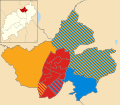
2011 results map
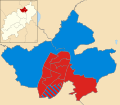
2015 results map
By-election results[]
| Party | Candidate | Votes | % | ±% | |
|---|---|---|---|---|---|
| Conservative | 512 | 50.4 | |||
| Labour | 369 | 36.4 | -3.0 | ||
| Liberal Democrats | 134 | 13.2 | |||
| Majority | 143 | 14.0 | |||
| Turnout | 1,015 | 51.5 | |||
| Conservative hold | Swing | ||||
| Party | Candidate | Votes | % | ±% | |
|---|---|---|---|---|---|
| Labour | 1,345 | 46.0 | -3.0 | ||
| Conservative | 735 | 25.1 | +1.1 | ||
| Liberal Democrats | 502 | 17.2 | -9.7 | ||
| Independent | 342 | 11.7 | +11.7 | ||
| Majority | 610 | 20.9 | |||
| Turnout | 2,924 | 65.5 | |||
| Labour hold | Swing | ||||
| Party | Candidate | Votes | % | ±% | |
|---|---|---|---|---|---|
| Labour | 542 | 72.9 | -4.0 | ||
| Conservative | 201 | 27.1 | +4.0 | ||
| Majority | 341 | 45.8 | |||
| Turnout | 743 | ||||
| Labour hold | Swing | ||||
| Party | Candidate | Votes | % | ±% | |
|---|---|---|---|---|---|
| Conservative | 471 | 38.7 | +9.1 | ||
| Labour | 380 | 31.2 | -39.2 | ||
| Independent | 272 | 22.4 | +22.4 | ||
| Socialist Labour | 94 | 7.7 | +7.7 | ||
| Majority | 91 | 7.5 | |||
| Turnout | 1,217 | 29.1 | |||
| Conservative gain from Labour | Swing | ||||
| Party | Candidate | Votes | % | ±% | |
|---|---|---|---|---|---|
| Conservative | Becky Miller-Barton | 405 | 49.9 | +6.6 | |
| Labour | Madeline Whiteman | 267 | 32.9 | -0.5 | |
| Liberal Democrats | Scott Ponton | 140 | 17.2 | +3.0 | |
| Majority | 138 | 17.0 | |||
| Turnout | 812 | 18.7 | |||
| Conservative hold | Swing | ||||
References[]
- ^ legislation.gov.uk - The District of Corby (Electoral Arrangements) Order 1975. Retrieved on 19 November 2015.
- ^ legislation.gov.uk - The Borough of Corby (Electoral Changes) Order 1998. Retrieved on 4 October 2015.
- ^ legislation.gov.uk - The Borough of Corby (Electoral Changes) Order 2006. Retrieved on 3 November 2015.
- ^ legislation.gov.uk - The Corby (Electoral Changes) Order 2014. Retrieved on 3 November 2015.
External links[]
Categories:
- Corby Borough Council elections
- Council elections in Northamptonshire
- Corby
- District council elections in England


