East Ham South (UK Parliament constituency)
| East Ham South | |
|---|---|
| Former Borough constituency for the House of Commons | |
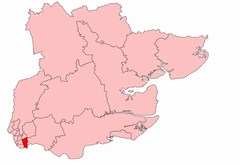 East Ham South within Essex from 1918 to 1950 | |
| County | 1918–1965: Essex 1965–1974: Greater London |
| 1918–1974 | |
| Number of members | One |
| Replaced by | Newham North East and Newham South |
| Created from | Romford |
East Ham South was a parliamentary constituency centred on the East Ham district of London, which was in Essex until 1965. It returned one Member of Parliament (MP) to the House of Commons of the Parliament of the United Kingdom, elected by the first past the post voting system.
History[]
The constituency was created by the Representation of the People Act 1918 for the 1918 general election. It was abolished for the February 1974 general election.
Boundaries[]
The seat was established in 1918, as a division of the County Borough of East Ham in the south western part of the historic county of Essex. It comprised the Beckton and North Woolwich, Central East and Central West wards.
By the time of the next major redistribution of parliamentary seats, which took effect in 1950, East Ham had been re-warded. The constituency then comprised Castle, Central, Greatfield, South and Wall End wards.
In 1965 East Ham was joined with other districts to form the London Borough of Newham in Greater London. It is part of east London.
In the 1974 redistribution the constituency was abolished and its area included in the new Newham North East seat.
Members of Parliament[]
| Election | Member | Party | |
|---|---|---|---|
| 1918 | Clement Edwards | Coalition National Democratic | |
| 1922 | Alfred Barnes | Labour | |
| 1931 | Malcolm Campbell-Johnston | Conservative | |
| 1935 | Alfred Barnes | Labour Co-operative | |
| 1955 | Albert Oram | Labour Co-operative | |
| Feb 1974 | constituency abolished | ||
Elections[]
Elections in the 1910s[]

| Party | Candidate | Votes | % | ±% | |
|---|---|---|---|---|---|
| C | National Democratic | Clement Edwards | 7,972 | 42.8 | |
| Unionist | Robert Frederick Frank Hamlett | 5,661 | 30.3 | ||
| Labour | Arthur Henderson | 5,024 | 26.9 | ||
| Majority | 2,311 | 12.5 | |||
| Turnout | 18,657 | 57.5 | |||
| National Democratic win | |||||
| C indicates candidate endorsed by the coalition government. | |||||
Elections in the 1920s[]

| Party | Candidate | Votes | % | ±% | |
|---|---|---|---|---|---|
| Labour | Alfred Barnes | 10,566 | 48.1 | +21.2 | |
| Liberal | Edward Smallwood | 6,567 | 30.0 | New | |
| National Liberal | Clement Edwards | 4,793 | 21.9 | New | |
| Majority | 3,999 | 18.1 | N/A | ||
| Turnout | 21,926 | 66.3 | +8.8 | ||
| Registered electors | 33,070 | ||||
| Labour gain from National Democratic | Swing | +21.1 | |||
| Party | Candidate | Votes | % | ±% | |
|---|---|---|---|---|---|
| Labour | Alfred Barnes | 11,402 | 49.2 | +1.1 | |
| Liberal | Edward Smallwood | 8,772 | 37.8 | +7.8 | |
| Unionist | Herbert Joseph Ward | 3,011 | 13.0 | New | |
| Majority | 2,630 | 11.4 | −6.7 | ||
| Turnout | 23,185 | 68.5 | +2.2 | ||
| Registered electors | 33,837 | ||||
| Labour hold | Swing | −3.4 | |||
| Party | Candidate | Votes | % | ±% | |
|---|---|---|---|---|---|
| Labour | Alfred Barnes | 13,644 | 51.9 | +2.7 | |
| Liberal | Edward Maynard Coningsby Denney | 12,656 | 48.1 | +10.3 | |
| Majority | 988 | 3.8 | −7.6 | ||
| Turnout | 26,300 | 75.9 | +7.4 | ||
| Registered electors | 34,651 | ||||
| Labour hold | Swing | −3.8 | |||
| Party | Candidate | Votes | % | ±% | |
|---|---|---|---|---|---|
| Labour | Alfred Barnes | 18,956 | 54.3 | +2.4 | |
| Unionist | Hubert Duggan | 8,854 | 25.4 | New | |
| Liberal | Edward Maynard Coningsby Denney | 7,085 | 20.3 | −27.8 | |
| Majority | 10,102 | 28.9 | +25.1 | ||
| Turnout | 34,895 | 73.8 | −2.1 | ||
| Registered electors | 47,261 | ||||
| Labour hold | Swing | +15.1 | |||
Elections in the 1930s[]
| Party | Candidate | Votes | % | ±% | |
|---|---|---|---|---|---|
| Conservative | Malcolm Campbell-Johnston | 18,300 | 53.8 | +28.4 | |
| Labour | Alfred Barnes | 15,737 | 46.2 | -8.1 | |
| Majority | 2,563 | 7.6 | N/A | ||
| Turnout | 34,037 | 70.3 | -3.5 | ||
| Conservative gain from Labour | Swing | +18.2 | |||
| Party | Candidate | Votes | % | ±% | |
|---|---|---|---|---|---|
| Labour | Alfred Barnes | 18,949 | 59.3 | +13.1 | |
| Conservative | Malcolm Campbell-Johnston | 12,993 | 40.7 | -13.1 | |
| Majority | 5,956 | 18.6 | New | ||
| Turnout | 31,942 | 66.6 | -3.7 | ||
| Labour gain from Conservative | Swing | +13.1 | |||
Elections in the 1940s[]
| Party | Candidate | Votes | % | ±% | |
|---|---|---|---|---|---|
| Labour | Alfred Barnes | 19,168 | 74.0 | +14.7 | |
| Conservative | MG Munthe | 6,734 | 26.0 | -14.7 | |
| Majority | 12,434 | 48.0 | +29.4 | ||
| Turnout | 25,902 | 69.9 | +3.3 | ||
| Labour hold | Swing | +14.7 | |||
Elections in the 1950s[]
| Party | Candidate | Votes | % | ±% | |
|---|---|---|---|---|---|
| Labour | Alfred Barnes | 23,002 | 62.1 | -11.9 | |
| Conservative | C. E. Jordan | 10,956 | 29.6 | +3.6 | |
| Liberal | Cecil Arthur Borrott | 2,424 | 6.5 | New | |
| Communist | E. C. W. Thomas | 401 | 1.1 | New | |
| Socialist (GB) | Harry Young | 256 | 0.7 | New | |
| Majority | 12,046 | 32.5 | -15.5 | ||
| Turnout | 37,039 | 84.4 | +14.5 | ||
| Labour hold | Swing | ||||
| Party | Candidate | Votes | % | ±% | |
|---|---|---|---|---|---|
| Labour | Alfred Barnes | 23,704 | 64.9 | +2.8 | |
| Conservative | John Barter | 12,813 | 35.1 | +5.5 | |
| Majority | 10,891 | 29.8 | -2.7 | ||
| Turnout | 36,517 | 82.5 | -1.9 | ||
| Labour hold | Swing | ||||
| Party | Candidate | Votes | % | ±% | |
|---|---|---|---|---|---|
| Labour | Albert Oram | 19,808 | 64.1 | -0.8 | |
| Conservative | Anthony J Pickford | 11,109 | 35.9 | +0.8 | |
| Majority | 8,699 | 28.2 | -1.6 | ||
| Turnout | 30,917 | 73.1 | -9.4 | ||
| Labour hold | Swing | -0.8 | |||
| Party | Candidate | Votes | % | ±% | |
|---|---|---|---|---|---|
| Labour | Albert Oram | 18,230 | 61.5 | -2.6 | |
| Conservative | Reginald J Watts | 11,422 | 38.5 | +2.6 | |
| Majority | 6,808 | 23.0 | -5.2 | ||
| Turnout | 29,652 | 74.6 | +1.5 | ||
| Labour hold | Swing | ||||
Elections in the 1960s[]
| Party | Candidate | Votes | % | ±% | |
|---|---|---|---|---|---|
| Labour | Albert Oram | 17,069 | 66.0 | +4.5 | |
| Conservative | Reginald J Watts | 8,797 | 34.0 | -4.5 | |
| Majority | 8,272 | 32.0 | +9.0 | ||
| Turnout | 25,866 | 67.9 | -6.7 | ||
| Labour hold | Swing | ||||
| Party | Candidate | Votes | % | ±% | |
|---|---|---|---|---|---|
| Labour | Albert Oram | 17,543 | 69.9 | +3.9 | |
| Conservative | Ivor Stanbrook | 7,540 | 30.1 | -3.9 | |
| Majority | 10,003 | 39.8 | +7.8 | ||
| Turnout | 25,083 | 65.7 | -2.2 | ||
| Labour hold | Swing | +3.9 | |||
Elections in the 1970s[]
| Party | Candidate | Votes | % | ±% | |
|---|---|---|---|---|---|
| Labour | Albert Oram | 13,638 | 61.9 | -8.0 | |
| Conservative | Christopher Jackson | 8,402 | 38.1 | +8.0 | |
| Majority | 5,236 | 23.8 | -16.0 | ||
| Turnout | 22,040 | 55.1 | -10.6 | ||
| Labour hold | Swing | -8.0 | |||
References[]
- ^ British Parliamentary Election Results 1918-1949, FWS Craig
- ^ British Parliamentary Election Results 1918-1949, FWS Craig
- ^ British Parliamentary Election Results 1918-1949, FWS Craig
- ^ British Parliamentary Election Results 1918-1949, FWS Craig
- ^ British Parliamentary Election Results 1918-1949, FWS Craig
- ^ British Parliamentary Election Results 1918-1949, FWS Craig
- ^ British Parliamentary Election Results 1918-1949, FWS Craig
- ^ British Parliamentary Election Results 1918-1949, FWS Craig
- ^ British parliamentary election results, 1950-1973 by FWS Craig
- ^ British parliamentary election results, 1950-1973 by FWS Craig
- ^ British parliamentary election results, 1950-1973 by FWS Craig
- ^ F W S Craig, British Parliamentary Election Results 1950-1973; Political Reference Publications, Glasgow 1973
- ^ F W S Craig, British Parliamentary Election Results 1950-1973; Political Reference Publications, Glasgow 1973
- ^ British parliamentary election results, 1950-1973 by FWS Craig
- ^ British parliamentary election results, 1950-1973 by FWS Craig
- Craig, F. W. S. (1983) [1969]. British parliamentary election results 1918-1949 (3rd ed.). Chichester: Parliamentary Research Services. ISBN 0-900178-06-X.
- Leigh Rayment's Historical List of MPs – Constituencies beginning with "E" (part 1)
- Parliamentary constituencies in London (historic)
- Constituencies of the Parliament of the United Kingdom established in 1918
- Constituencies of the Parliament of the United Kingdom disestablished in 1974
- Politics of the London Borough of Newham
- History of the London Borough of Newham
- East Ham