Bromley London Borough Council elections

Bromley Council is elected every four years.
Political control[]
Since the first election to the council in 1964 political control of the council has been held by the following parties:
| Election | Overall Control | Conservative | Labour | Lib Dem | UKIP | Ind. |
|---|---|---|---|---|---|---|
| 1964 | Conservative | 28 | 15 | 7 | - | - |
| 1968 | Conservative | 52 | 5 | 3 | - | - |
| 1971 | Conservative | 41 | 15 | 4 | - | - |
| 1974 | Conservative | 44 | 14 | 2 | - | - |
| 1978 | Conservative | 48 | 12 | - | - | - |
| 1982 | Conservative | 52 | 5 | 3 | - | - |
| 1986 | Conservative | 44 | 10 | 6 | - | - |
| 1990 | Conservative | 43 | 11 | 6 | - | - |
| 1994 | Conservative | 32 | 7 | 21 | - | - |
| 1998 | No overall control | 28 | 7 | 25 | - | - |
| 2002 | Conservative | 41 | 6 | 13 | - | - |
| 2006 | Conservative | 49 | 4 | 7 | - | - |
| 2010 | Conservative | 53 | 3 | 4 | - | - |
| 2014 | Conservative | 51 | 7 | - | 2 | - |
| 2018 | Conservative | 50 | 8 | - | - | 2 |
Council elections[]
- 1964 Bromley London Borough Council election
- 1968 Bromley London Borough Council election
- 1971 Bromley London Borough Council election (boundary changes took place but the number of seats remained the same)[1][n 1]
- 1974 Bromley London Borough Council election
- 1978 Bromley London Borough Council election (boundary changes took place but the number of seats remained the same)[2]
- 1982 Bromley London Borough Council election
- 1986 Bromley London Borough Council election
- 1990 Bromley London Borough Council election
- 1994 Bromley London Borough Council election (boundary changes took place but the number of seats remained the same)[n 2][n 3][n 4][n 5][n 6]
- 1998 Bromley London Borough Council election
- 2002 Bromley London Borough Council election (boundary changes took place but the number of seats remained the same)[3]
- 2006 Bromley London Borough Council election
- 2010 Bromley London Borough Council election
- 2014 Bromley London Borough Council election
- 2018 Bromley London Borough Council election
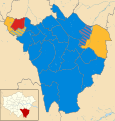
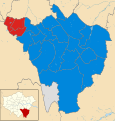
Borough result maps[]

2002 results map
2006 results map

2010 results map

2014 results map
2018 results map


By-election results[]
1964-1968[]
There were no by-elections.[4]
1968-1971[]
| Party | Candidate | Votes | % | ±% | |
|---|---|---|---|---|---|
| Conservative | J. Smith | 1,977 | |||
| Liberal | W. R. Edwards | 250 | |||
| Labour | Mrs E. Leys | 183 | |||
| Turnout | 22.7 | ||||
| Party | Candidate | Votes | % | ±% | |
|---|---|---|---|---|---|
| Conservative | K. J. Harding | 3,165 | |||
| Liberal | K. H. Lock | 2,010 | |||
| Labour | J. R. Constable | 188 | |||
| Turnout | 41.3 | ||||
| Party | Candidate | Votes | % | ±% | |
|---|---|---|---|---|---|
| Conservative | Bernard E. G. Davis | 1,130 | |||
| Liberal | J. Bratt | 150 | |||
| Labour | Christopher Richard Gaster | 130 | |||
| Turnout | 17.9 | ||||
| Party | Candidate | Votes | % | ±% | |
|---|---|---|---|---|---|
| Conservative | Mrs Jean Tatham | 1,634 | |||
| Liberal | S. D. Ellingworth | 1,579 | |||
| Labour | G. Fielding | 109 | |||
| Turnout | 49.9 | ||||
| Party | Candidate | Votes | % | ±% | |
|---|---|---|---|---|---|
| Liberal | Roy Edey | 1,292 | |||
| Conservative | Miss S. M. N. Gready | 869 | |||
| Labour | S. T. Lack | 371 | |||
| Turnout | 49.9 | ||||
| Party | Candidate | Votes | % | ±% | |
|---|---|---|---|---|---|
| Conservative | J. E. Swatton | 1,185 | |||
| Liberal | I. Phillips | 382 | |||
| Labour | Christopher Richard Gaster | 186 | |||
| Turnout | 29.0 | ||||
| Party | Candidate | Votes | % | ±% | |
|---|---|---|---|---|---|
| Labour | E. C. H. Smith | 1,367 | |||
| Conservative | A. E. Stayte | 665 | |||
| Liberal | Miss J. Fudonger | 283 | |||
| Turnout | 20.4 | ||||
| Party | Candidate | Votes | % | ±% | |
|---|---|---|---|---|---|
| Labour | D. W. Edwards | 1,511 | |||
| Conservative | A. E. Stayte | 507 | |||
| Liberal | J. J. Hart | 166 | |||
| Turnout | 17.5 | ||||
| Party | Candidate | Votes | % | ±% | |
|---|---|---|---|---|---|
| Labour | John Spellar | 1,180 | |||
| Liberal | M. Edwardes-Evans | 988 | |||
| Conservative | G. S. Edwards | 618 | |||
| Turnout | 28.2 | ||||
1971-1974[]
| Party | Candidate | Votes | % | ±% | |
|---|---|---|---|---|---|
| Labour | A. J. Mansfield | 1,156 | |||
| Conservative | R. C. Carter | 504 | |||
| Liberal | William Huckin | 488 | |||
| Turnout | 27.6 | ||||
| Party | Candidate | Votes | % | ±% | |
|---|---|---|---|---|---|
| Labour | Mrs M. L. Wilson | 1,809 | |||
| Conservative | A. E. Stayte | 417 | |||
| Liberal | Mrs A. M. Parfitt | 249 | |||
| Turnout | 19.0 | ||||
| Party | Candidate | Votes | % | ±% | |
|---|---|---|---|---|---|
| Conservative | L. Sellers | 1,597 | |||
| Labour | Mrs J. Wood | 535 | |||
| Liberal | Paul D.A. Nash | 188 | |||
| Turnout | 20.7 | ||||
| Party | Candidate | Votes | % | ±% | |
|---|---|---|---|---|---|
| Conservative | D. E. Johnson | 1,400 | |||
| Liberal | Mrs F. B. Kirby | 1,369 | |||
| Labour | Miss M. J. E. Healy | 220 | |||
| Turnout | 38.6 | ||||
| Party | Candidate | Votes | % | ±% | |
|---|---|---|---|---|---|
| Labour | Peter J. Tozer | 2,473 | |||
| Conservative | J. A. Collins | 1,013 | |||
| Liberal | Mrs Kathleen E.C. Tarbolton | 820 | |||
| Turnout | 38.5 | ||||
| Party | Candidate | Votes | % | ±% | |
|---|---|---|---|---|---|
| Conservative | D. S. Reid | 1,020 | |||
| Labour | Gordon Thomas Yates | 799 | |||
| Liberal | Mrs M. M. Coulson | 682 | |||
| Turnout | 24.2 | ||||
| Party | Candidate | Votes | % | ±% | |
|---|---|---|---|---|---|
| Conservative | P. C. Read | 1,052 | |||
| Liberal | Peter A. Dodsworth | 956 | |||
| Labour | R. Armstrong | 140 | |||
| Turnout | 28.6 | ||||
| Party | Candidate | Votes | % | ±% | |
|---|---|---|---|---|---|
| Conservative | B. G. Cope | 1,218 | |||
| Liberal | J. V. Cope | 635 | |||
| Labour | John R. Holbrook | 317 | |||
| Turnout | 27.4 | ||||
1974-1978[]
| Party | Candidate | Votes | % | ±% | |
|---|---|---|---|---|---|
| Conservative | Jennifer M. Hillier | 2,067 | |||
| Liberal | Keith A. M. Challis | 949 | |||
| Labour | Philip R. Edwards | 368 | |||
| Turnout | 27.9 | ||||
| Party | Candidate | Votes | % | ±% | |
|---|---|---|---|---|---|
| Conservative | Alan S. Cornish | 2,272 | |||
| Liberal | Edward Babbs | 1,555 | |||
| Labour | Antoni M. Ziolkowski | 392 | |||
| Turnout | 36.3 | ||||
| Party | Candidate | Votes | % | ±% | |
|---|---|---|---|---|---|
| Conservative | Philip G. Jones | 1,898 | |||
| Liberal | Brian H. Taylor | 1,713 | |||
| Labour | Peter W. Rance | 377 | |||
| Turnout | 35.3 | ||||
| Party | Candidate | Votes | % | ±% | |
|---|---|---|---|---|---|
| Conservative | John A. M. Lewis | 894 | |||
| Labour | Janet I. Ambrose | 741 | |||
| Liberal | Adrian G. Chapman | 298 | |||
| Turnout | 31.9 | ||||
| Party | Candidate | Votes | % | ±% | |
|---|---|---|---|---|---|
| Conservative | John A. Stewart | 1,830 | |||
| Liberal | Ian Phillips | 291 | |||
| Labour | Jan Pollert | 81 | |||
| Turnout | 26.3 | ||||
| Party | Candidate | Votes | % | ±% | |
|---|---|---|---|---|---|
| Conservative | Michael J. Hughes | 1,307 | |||
| Liberal | George H. Dunk | 596 | |||
| Labour | Roy E. Hodsdon | 529 | |||
| Turnout | 35.0 | ||||
| Party | Candidate | Votes | % | ±% | |
|---|---|---|---|---|---|
| Conservative | 828 | ||||
| Liberal | Derek J. Goldsmith | 551 | |||
| Labour | Keith A. Galley | 93 | |||
| Turnout | 52.0 | ||||
| Party | Candidate | Votes | % | ±% | |
|---|---|---|---|---|---|
| Labour | Derek A. Wood | 1,886 | |||
| Conservative | Albert E. Stayte | 773 | |||
| Liberal | Nicholas J. Rowden | 373 | |||
| Turnout | 24.4 | ||||
| Party | Candidate | Votes | % | ±% | |
|---|---|---|---|---|---|
| Conservative | Peter G. Nash | 2,823 | |||
| Liberal | Keith A. M. Challis | 1,804 | |||
| Labour | Philip R. Edwards | 392 | |||
| Turnout | 40.5 | ||||
| Party | Candidate | Votes | % | ±% | |
|---|---|---|---|---|---|
| Conservative | Leslie G. Whitman | 1,664 | |||
| Liberal | Alan G. Sewell | 538 | |||
| Labour | Richard J. Cox | 303 | |||
| Turnout | 31.8 | ||||
| Party | Candidate | Votes | % | ±% | |
|---|---|---|---|---|---|
| Conservative | Brian R. Reading | 2,462 | |||
| Liberal | Phillip F. Khan-Panni | 292 | |||
| Labour | Pauline M. Jones | 212 | |||
| Turnout | 34.7 | ||||
1978-1982[]
1982-1986[]
1986-1990[]
1990-1994[]
| Party | Candidate | Votes | % | ±% | |
|---|---|---|---|---|---|
| Conservative | Carole M. Hubbard | 1,810 | 56.7 | -8.3 | |
| Liberal Democrats | Jennifer M. Fitch | 1,156 | 36.2 | +15.4 | |
| Labour | Susan O'Dwyer | 154 | 4.8 | -9.4 | |
| SDP | Richard J. Cox | 48 | 1.5 | n/a | |
| Liberal | Carmel Martin | 23 | 0.7 | n/a | |
| Majority | 654 | 20.5 | -23.7 | ||
| Turnout | 45.3 | -3.9 | |||
| Conservative hold | Swing | -11.8 | |||
The by-election was called following the resignation of Cllr. Montague I. Blazey.
| Party | Candidate | Votes | % | ±% | |
|---|---|---|---|---|---|
| Liberal Democrats | Graem Peters | 3,931 | 69.2 | +29.9 | |
| Conservative | Anthony N. Youd | 1,291 | 22.7 | -26.9 | |
| Labour | Charles W. Hailes | 370 | 6.5 | -4.6 | |
| Green | Nicola C. Ellingham | 88 | 1.5 | n/a | |
| Majority | 2,640 | 46.5 | 56.8 | ||
| Turnout | 48.3 | -6.4 | |||
| Liberal Democrats gain from Conservative | Swing | +28.4 | |||
The by-election was called following the resignation of Cllr. Reginald G. Adams.
1994-1998[]
| Party | Candidate | Votes | % | ±% | |
|---|---|---|---|---|---|
| Conservative | Roderick A. Reed | 1,544 | |||
| Liberal Democrats | Edward Hilary Whitaker | 910 | |||
| Labour | Deborah Russell | 330 | |||
| Independent | Colin C. Cole | 55 | |||
| Liberal | George L. Whitehorn | 15 | |||
| Turnout | |||||
| Conservative hold | Swing | ||||
The by-election was called following the resignation of Cllr. Stephen R. Oxenbridge.
| Party | Candidate | Votes | % | ±% | |
|---|---|---|---|---|---|
| Conservative | Gordon William Jenkins | 2,263 | |||
| Liberal Democrats | David Malcolm Dear | 1,929 | |||
| Labour | Kelly J. Galvin | 549 | |||
| Liberal | Ian Richmond | 80 | |||
| Turnout | |||||
| Conservative hold | Swing | ||||
The by-election was called following the resignation of Cllr. David M. Dear.
1998-2002[]
| Party | Candidate | Votes | % | ±% | |
|---|---|---|---|---|---|
| Conservative | John G. Gallop | 1,828 | 57.4 | -2.0 | |
| Liberal Democrats | Derek Gambell | 1,110 | 34.9 | +10.6 | |
| Labour | Alfred E. Parish | 181 | 5.7 | -10.6 | |
| National Front | Kevin Lowne | 40 | 1.3 | +1.3 | |
| Liberal | Elizabeth A. Steele | 25 | 0.8 | +0.8 | |
| Majority | 718 | 22.5 | |||
| Turnout | 3,184 | 30.2 | |||
| Conservative hold | Swing | ||||
The by-election was called following the death of Cllr. Sheila A. Humphreys.
| Party | Candidate | Votes | % | ±% | |
|---|---|---|---|---|---|
| Conservative | Stephen L. Carr | 1,754 | 46.6 | ||
| Liberal Democrats | Lennard D. Woods | 1,683 | 44.7 | ||
| Labour | George F. Johnstone | 195 | 5.2 | ||
| Independent | Gary Badgett | 81 | 2.2 | ||
| Green_Party_of_England_and_Wales | Adrian G. Appley | 49 | 1.3 | ||
| Majority | 71 | 1.9 | |||
| Turnout | 3,762 | 31.1 | |||
| Conservative gain from Liberal Democrats | Swing | ||||
The by-election was called following the resignation of Cllr. Paul J. H. Booth.
| Party | Candidate | Votes | % | ±% | |
|---|---|---|---|---|---|
| Conservative | Timothy C. Stevens | 1,460 | 51.9 | -8.6 | |
| Liberal Democrats | Robert J. Evans | 1,195 | 42.4 | +22.5 | |
| Labour | Christopher J. Price | 81 | 2.9 | -7.5 | |
| UKIP | Robert M. Bryant | 43 | 1.5 | -7.8 | |
| Green_Party_of_England_and_Wales | Ann C. Garrett | 37 | 1.3 | +1.3 | |
| Majority | 265 | 9.5 | |||
| Turnout | 2,816 | 39.5 | |||
| Conservative hold | Swing | ||||
The by-election was called following the death of Cllr. Eric N. Goodman.
| Party | Candidate | Votes | % | ±% | |
|---|---|---|---|---|---|
| Conservative | Julian P. G. Grainger | 2,480 | 52.9 | +10.8 | |
| Liberal Democrats | Michael Oldman | 2,122 | 45.2 | -3.3 | |
| Labour | Peter J. Lisle | 88 | 1.9 | -7.5 | |
| Majority | 358 | 7.7 | |||
| Turnout | 4,690 | 40.1 | |||
| Conservative gain from Liberal Democrats | Swing | ||||
The by-election was called following the resignation of Cllr. Graem Peters.
| Party | Candidate | Votes | % | ±% | |
|---|---|---|---|---|---|
| Conservative | Charles J. Rideout | 746 | 49.2 | +11.9 | |
| Labour | Elizabeth R. Johnstone | 689 | 45.5 | -4.8 | |
| Liberal Democrats | Derek Gambell | 80 | 5.3 | -7.1 | |
| Majority | 57 | 3.7 | |||
| Turnout | 1,515 | 24.6 | |||
| Conservative gain from Labour | Swing | ||||
The by-election was called following the resignation of Cllr. Robert J. Yeldham.
2002-2006[]
There were no by-elections.[8]
2006-2010[]
| Party | Candidate | Votes | % | ±% | |
|---|---|---|---|---|---|
| Liberal Democrats | Tom Papworth | 1,051 | 49.7 | +2.5 | |
| Labour | Kevin C. Brooks | 537 | 25.4 | +1.5 | |
| Conservative | Jason M. Hadden | 398 | 18.8 | +3.5 | |
| Green | Karen A. Moran | 129 | 6.1 | -7.5 | |
| Majority | 514 | 24.3 | |||
| Turnout | 2,115 | 24.7 | |||
| Liberal Democrats hold | Swing | ||||
The by-election was called following the death of Cllr. Christopher R. Gaster.
2010-2014[]
| Party | Candidate | Votes | % | ±% | |
|---|---|---|---|---|---|
| Conservative | David Jefferys | 1,480 | 59.4 | +2.9 | |
| Liberal Democrats | Anuja Prashar | 490 | 19.6 | -8.1 | |
| Labour | Gareth Wyn Davies | 256 | 10.2 | -2.6 | |
| UKIP | Emmett Jenner | 153 | 6.1 | N/A | |
| Green | Anna Martin | 75 | 3.0 | N/A | |
| BNP | Michael Lionel Payne | 35 | 1.4 | -5.8 | |
| Majority | 990 | ||||
| Turnout | 2,489 | ||||
| Conservative hold | Swing | ||||
The by-election was called following the resignation of Cllr. George R. Taylor.
| Party | Candidate | Votes | % | ±% | |
|---|---|---|---|---|---|
| Conservative | Ms. Nicky Dykes | 2484 | |||
| Liberal Democrats | Sam Webber | 1137 | |||
| Labour | Ms. Angela Stack | 1051 | |||
| Green | Ms. Ann C. Garrett | 404 | |||
| UKIP | Owen Brolly | 397 | |||
| Turnout | 42.8% | ||||
| Conservative hold | Swing | ||||
The by-election was called following the resignation of Cllr. Ms. Diana L. Macmull.
2014-2018[]
2018 - 2022
Crystal Palace Byelection on 6 May 2021:
Tom Capon - The Conservative Party - 783 votes Suraj Rajesh Gandecha - Liberal Democrats - 370 votes Maria Costas Psaras - Green Party - 820 votes Ryan David Thomson - Labour Party - 2,235 - votes
Ryan David Thomson is elected to represent the Crystal Palace Ward. The turnout was 42%
| Party | Candidate | Votes | % | ±% | |
|---|---|---|---|---|---|
| Conservative | Christine Harris | 1626 | 45.2 | +0.8 | |
| Labour | Marie Bardsley | 1046 | 29.1 | +1.7 | |
| Liberal Democrats | Julie Ireland | 633 | 17.6 | +2.7 | |
| UKIP | Graham Reakes | 219 | 6.1 | +2.4 | |
| Green | Paul Enock | 73 | 2.0 | -7.6 | |
| Turnout | 3597 | 29.17 | |||
| Conservative hold | Swing | ||||
The by-election was called following the resignation of Cllr. Dave Wibberley
External links[]
References[]
- ^ The Greater London, Kent and Surrey Order, 1968
- ^ The Bromley and Greenwich (London Borough Boundaries) Order 1993
- ^ The Bromley and Lewisham (London Borough Boundaries) Order 1993
- ^ The Bromley, Croydon, Lambeth, Lewisham and Southwark (London Borough Boundaries) Order 1993
- ^ The Greater London and Surrey (County and London Borough Boundaries) Order 1993
- ^ The Greater London, Kent and Surrey (County Boundaries) Order 1993
- ^ a b c d e f g h i j "London Borough Council Elections 13 May 1971" (PDF). London Datastore. Greater London Council. Retrieved 3 March 2015.
- ^ a b c d e f g h i j k l "London Borough Council Elections 4 May 1978" (PDF). London Datastore. Greater London Council. Retrieved 25 February 2015.
- ^ a b c d e f "London Borough Council Elections 2 May 2002" (PDF). London Datastore. Greater London Authority. Retrieved 25 February 2015.
- ^ "London Borough Council Elections 9 May 1968" (PDF). London Datastore. Greater London Council. Retrieved 24 February 2015.
- ^ a b c d e f g h "London Borough Council Elections 2 May 1974" (PDF). London Datastore. Greater London Council. Retrieved 25 February 2015.
- ^ a b "London Borough Council By-elections May 1990 to May 1994" (PDF). London Datastore. London Research Centre. Retrieved 8 March 2015.
- ^ a b "London Borough Council Elections 7 May 1998 including the Greater London Authority Referendum results" (PDF). London Datastore. London Research Centre. Retrieved 8 March 2015.
- ^ "London Borough Council Elections 4 May 2006" (PDF). London Datastore. Greater London Authority. Retrieved 7 March 2015.
- ^ "London Borough Council Elections 6 May 2010" (PDF). London Datastore. Greater London Authority. Retrieved 7 March 2015.
- ^ "Archived copy". Archived from the original on 2012-04-04. Retrieved 2011-10-20.
{{cite web}}: CS1 maint: archived copy as title (link) - ^ local_council_by-election_in_bromley_town_ward
- ^ "London Borough Council Elections 22 May 2014" (PDF). London Datastore. Greater London Authority. Retrieved 26 February 2015.
- ^ "Kelsey and Eden Park ward by-election 2018". Bromley Council. Bromley Council. Archived from the original on 12 November 2018. Retrieved 10 November 2018.
- ^ "Kelsey and Eden Park by-election results". Bromley Council. Bromley Council. Retrieved 30 November 2018.
- Council elections in the London Borough of Bromley