2006 London local elections
| |||||||||||||||||||||||||||||||||||||||||
All 1,861 on all 32 London boroughs | |||||||||||||||||||||||||||||||||||||||||
|---|---|---|---|---|---|---|---|---|---|---|---|---|---|---|---|---|---|---|---|---|---|---|---|---|---|---|---|---|---|---|---|---|---|---|---|---|---|---|---|---|---|
| Turnout | 38.9% ( | ||||||||||||||||||||||||||||||||||||||||
| |||||||||||||||||||||||||||||||||||||||||
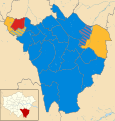
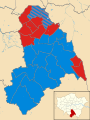
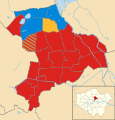
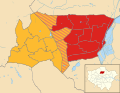
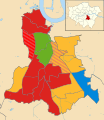
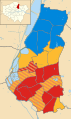
 Results by Borough in 2006. | |||||||||||||||||||||||||||||||||||||||||


Local government elections took place in London, and some other parts of the United Kingdom on Thursday 4 May 2006. Polling stations were open between 7am and 10pm.
All London borough council seats were up for election. Mayoral contests were held in the London Boroughs of Hackney, Lewisham, and Newham.
The London Conservatives slightly increased their vote share, made 131 council seat gains and won control of 6 new councils, while London Labour saw its vote share decline by 6% and lost 8 councils and 182 seats. The 2006 result was one of Labour's worst local election results in London, with its share of the vote (27.9%), its number of council seats (684) and number of councils (7) all at their lowest levels since 1968. Conversely, the Conservatives won the most seats, the most councils and the most votes in London for the first time since 1982.
The Labour decline was also accompanied by a rise in the number of minor party councillors, mostly concentrated in specific local authorities. Respect won 15 council seats, the British National Party won 14 and the London Green Party won 12. The Christian Peoples Alliance and the Socialist Party also won two seats each. In total, the election saw 76 minor party or independent councillors elected in London, a figure which remains the highest on record.
Altogether, minor parties and independents won 17% of the vote, the highest ever vote share for 'other' parties until the local elections of 2014.
Results summary[]
| Party[1][2] | Votes won | % votes | Change | Seats | % seats | Change | Councils | Change | |
|---|---|---|---|---|---|---|---|---|---|
| Conservative | 746,177 | 34.9 | +0.8 | 785 | 42.2 | +133 | 14 | +6 | |
| Labour | 596,570 | 27.9 | -6.0 | 684 | 36.8 | -182 | 7 | -8 | |
| Liberal Democrats | 443,772 | 20.7 | +0.1 | 316 | 17.0 | +9 | 3 | ±0 | |
| Green | 169,160 | 7.9 | +2.4 | 12 | 0.6 | +11 | 0 | ±0 | |
| Respect | 38,662 | 1.8 | n/a | 15 | 0.8 | +15 | 0 | ±0 | |
| BNP | 21,625 | 1.0 | +0.6 | 14 | 0.8 | +14 | 0 | ±0 | |
| Others | 123,713 | 5.8 | +0.4 | 35 | 1.9 | +2 | 0 | ±0 | |
| No overall control | n/a | n/a | n/a | n/a | n/a | n/a | 8 | +2 | |
- Turnout: 2,284,882 voters cast ballots, a turnout of 38.9% (+7.1%).[3]
Council results[]
| Council | Previous control | Result | Details | ||
|---|---|---|---|---|---|
| Barking and Dagenham | Labour | Labour | Details | ||
| Barnet | Conservative | Conservative | Details | ||
| Bexley | Labour | Conservative | |||
| Brent | Labour | No overall control | Details | ||
| Bromley | Conservative | Conservative | Details | ||
| Camden | Labour | No overall control | Details | ||
| Croydon | Labour | Conservative | Details | ||
| Ealing | Labour | Conservative | |||
| Enfield | Conservative | Conservative | Details | ||
| Greenwich | Labour | Labour | Details | ||
| Hackney | Labour | Labour | Details | ||
| Hammersmith and Fulham | Labour | Conservative | Details | ||
| Haringey | Labour | Labour | Details | ||
| Harrow | No overall control | Conservative | |||
| Havering | No overall control | Conservative | Details | ||
| Hillingdon | No overall control | Conservative | |||
| Hounslow | Labour | No overall control | |||
| Islington | Liberal Democrats | No overall control | Details | ||
| Kensington and Chelsea | Conservative | Conservative | Details | ||
| Kingston upon Thames | Liberal Democrats | Liberal Democrats | Details | ||
| Lambeth | No overall control | Labour | Details | ||
| Lewisham | Labour | No overall control | Details | ||
| Merton | Labour | No overall control | Details | ||
| Newham | Labour | Labour | Details | ||
| Redbridge | Conservative | Conservative | Details | ||
| Richmond upon Thames | Conservative | Liberal Democrats | Details | ||
| Southwark | No overall control | No overall control | Details | ||
| Sutton | Liberal Democrats | Liberal Democrats | |||
| Tower Hamlets | Labour | Labour | Details | ||
| Waltham Forest | No overall control | No overall control | Details | ||
| Wandsworth | Conservative | Conservative | Details | ||
| Westminster | Conservative | Conservative | |||
Overall councillor numbers[]
The largest party in terms of councils and councillors became the Conservative Party after this election, with losses by the Labour Party and a small increase in share of the vote to the Liberal Democrats. Smaller national parties made significant gains, with the British National Party and Respect having the second-largest number of councillors in the London Borough of Barking and Dagenham and Tower Hamlets (respectively). The Green Party also saw its gains concentrated on one area to achieve the third most councillors in the London Borough of Lewisham. Scattered across boroughs, unaffiliated residents groups won 24 council seats.[4]
| London local elections 2006
Councillor statistics | |||
|---|---|---|---|
| Party | Seats | Gain/loss | |
| Conservative | 785 | +132 | |
| Labour | 685 | -181 | |
| Liberal Democrats | 317 | +8 | |
| Respect | 15 | +12 | |
| BNP | 14 | +14 | |
| Green | 12 | +10 | |
| CPA | 3 | +2 | |
| Socialist Alternative | 2 | 0 | |
| Local | 24 | ||
| Independent | 5 | ||
Mayoral results[]
In three London boroughs the executive function of the council is a directly elected mayor. The mayoral elections take place at the same time as councillor elections in those boroughs.
| Mayoralty | 2002 | 2006 | ||
|---|---|---|---|---|
| Hackney | Jules Pipe (Labour) | Jules Pipe (Labour) | ||
| Lewisham | Sir Steve Bullock (Labour) | Sir Steve Bullock (Labour) | ||
| Newham | Robin Wales (Labour) | Robin Wales (Labour) | ||
Ward result maps[]
London-wide[]
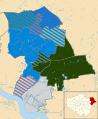
The map below shows the results for each ward across the whole of Greater London.

By borough[]

Barking and Dagenham 2006 results map

Barnet 2006 results map

Bexley 2006 results map

Brent 2006 results map
Bromley 2006 results map

Camden 2006 results map
Croydon 2006 results map

Ealing 2006 results map

Enfield 2006 results map

Greenwich 2006 results map
Hackney 2006 results map

Hammersmith and Fulham 2006 results map
Haringey 2006 results map

Harrow 2006 results map
Havering 2006 results map
Hillingdon 2006 results map

Hounslow 2006 results map
Islington 2006 results map

Kensington and Chelsea 2006 results map

Kingston upon Thames 2006 results map

Lambeth 2006 results map
Lewisham 2006 results map
Merton 2006 results map
Newham 2006 results map

Redbridge 2006 results map
Richmond upon Thames 2006 results map

Southwark 2006 results map

Sutton 2006 results map

Tower Hamlets 2006 results map
Waltham Forest 2006 results map

Wandsworth 2006 results map

Westminster 2006 results map


References[]
- ^ "Year Tables". 19 December 2015.
- ^ "Local Elections 2006". www.andrewteale.me.uk.
- ^ "London Borough Council Elections 4 May 2006" (PDF). files.datapress.com. March 2007. Archived from the original (PDF) on 11 February 2018.
- ^ Minors, Michael; Grenham, Dennis, eds. (March 2007). "London Borough Council Elections: 4 May 2006" (PDF). data.london.gov.uk. Greater London Authority. ISBN 978 1 85261 232 0. Retrieved 8 September 2019.
- "English elections list". electoralcommission.org.uk. 2006. Archived from the original on 23 March 2008. Retrieved 8 September 2019.
- Wintour, Patrick; Muir, Hugh (17 February 2006). "Party leaders put to the test with a capital campaign". The Guardian. Retrieved 8 September 2019.
| General elections |
|
|---|---|
| Local elections |
|
| European elections |
|
| Referendums |
|
- 2006 London Borough council elections
- May 2006 events in the United Kingdom
- London Borough council elections by year