1978 London local elections
| |||||||||||||||||||||||||||||||||||||||||||||
All 1,908 on all 32 London boroughs | |||||||||||||||||||||||||||||||||||||||||||||
|---|---|---|---|---|---|---|---|---|---|---|---|---|---|---|---|---|---|---|---|---|---|---|---|---|---|---|---|---|---|---|---|---|---|---|---|---|---|---|---|---|---|---|---|---|---|
| Turnout | 42.9% ( | ||||||||||||||||||||||||||||||||||||||||||||
| |||||||||||||||||||||||||||||||||||||||||||||
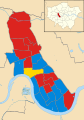
 Results by Borough in 1978. | |||||||||||||||||||||||||||||||||||||||||||||


Local government elections took place in London, and some other parts of the United Kingdom on Thursday 4 May 1978. Ward changes took place in every borough (except Enfield) which increased the total number of councillors by 41 from 1,867 to 1,908.
All London borough council seats were up for election. The previous Borough elections in London were in 1974.[1]
Results summary[]
| Party[2] | Votes won | % votes | Change | Seats | % seats | Change | Councils | Change | |
|---|---|---|---|---|---|---|---|---|---|
| Conservative | 1,037,894 | 48.7 | +7.9 | 960 | 50.3 | +247 | 17 | +4 | |
| Labour | 833,526 | 39.1 | -2.8 | 882 | 46.2 | -208 | 14 | -4 | |
| Liberal | 150,298 | 7.1 | -6.0 | 30 | 1.6 | +3 | 0 | ±0 | |
| Others | 108,144 | 5.1 | +0.9 | 36 | 1.9 | -1 | 0 | ±0 | |
| No overall control | n/a | n/a | ±0 | n/a | n/a | n/a | 1 | ±0 | |
- Turnout: 2,213,900 voters cast ballots, a turnout of 42.9% (+6.6%).[3]
Council results[]
| Council | Previous control | Result | Details | ||
|---|---|---|---|---|---|
| Barking | Labour | Labour | Details | ||
| Barnet | Conservative | Conservative | Details | ||
| Bexley | Conservative | Conservative | Details | ||
| Brent | Labour | Labour | Details | ||
| Bromley | Conservative | Conservative | Details | ||
| Camden | Labour | Labour | Details | ||
| Croydon | Conservative | Conservative | Details | ||
| Ealing | Labour | Conservative | Details | ||
| Enfield | Conservative | Conservative | Details | ||
| Greenwich | Labour | Labour | Details | ||
| Hackney | Labour | Labour | Details | ||
| Hammersmith | Labour | No overall control | Details | ||
| Haringey | Labour | Labour | Details | ||
| Harrow | Conservative | Conservative | Details | ||
| Havering | No overall control | Conservative | Details | ||
| Hillingdon | Labour | Conservative | Details | ||
| Hounslow | Labour | Labour | Details | ||
| Islington | Labour | Labour | Details | ||
| Kensington and Chelsea | Conservative | Conservative | Details | ||
| Kingston upon Thames | Conservative | Conservative | Details | ||
| Lambeth | Labour | Labour | Details | ||
| Lewisham | Labour | Labour | Details | ||
| Merton | Conservative | Conservative | Details | ||
| Newham | Labour | Labour | Details | ||
| Redbridge | Conservative | Conservative | Details | ||
| Richmond upon Thames | Conservative | Conservative | Details | ||
| Southwark | Labour | Labour | Details | ||
| Sutton | Conservative | Conservative | Details | ||
| Tower Hamlets | Labour | Labour | Details | ||
| Waltham Forest | Labour | Labour | Details | ||
| Wandsworth | Labour | Conservative | Details | ||
| Westminster | Conservative | Conservative | Details | ||
Overall councillor numbers[]
| London local elections 1978
Councillor statistics | |||
|---|---|---|---|
| Party | Seats | Gain/loss | |
| Conservative | 960 | +247 | |
| Labour | 882 | -208 | |
| Liberal | 30 | +3 | |
| Others | 36 | -1 | |
Borough result maps[]

Barnet 1978 results map

Camden 1978 results map
Hammersmith 1978 results map


References[]
- ^ Minors, Michael; Grenham, Dennis. "London Borough Council Elections 7 May 1998 including the Greater London Authority Referendum results" (PDF). Demographic and Statistical Studies. London Research Centre. Retrieved 29 May 2014.
- ^ "Year Tables". electionscentre.co.uk. 19 December 2015. Archived from the original on 18 June 2016.
- ^ "London Borough Council Elections 4 May 1978" (PDF). londondatastore-upload.s3.amazonaws.com. 1978. Archived (PDF) from the original on 2 April 2015.
| General elections |
|
|---|---|
| Local elections |
|
| European elections | |
| Referendums |
|
Categories:
- 1978 London Borough council elections
- May 1978 events in the United Kingdom
- London Borough council elections by year