2002 London local elections
| |||||||||||||||||||||||||||||||||||||||||
All 1,861 on all 32 London boroughs | |||||||||||||||||||||||||||||||||||||||||
|---|---|---|---|---|---|---|---|---|---|---|---|---|---|---|---|---|---|---|---|---|---|---|---|---|---|---|---|---|---|---|---|---|---|---|---|---|---|---|---|---|---|
| Turnout | 31.8% ( | ||||||||||||||||||||||||||||||||||||||||
| |||||||||||||||||||||||||||||||||||||||||
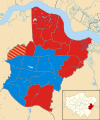
 Results by Borough in 2002. | |||||||||||||||||||||||||||||||||||||||||


Local government elections took place in London, and some other parts of the United Kingdom on Thursday 2 May 2002. Ward changes took place in every borough, following a series of reviews and 32 statutory instruments which reduced the total number of councillors by 56 from 1,917 to 1,861.
All London borough council seats were up for election. The London Conservatives narrowly won the popular vote across the city by a margin of 871 votes, increased their number of councillors by 115 and won control of 4 more councils. However, London Labour won a plurality of council seats (866) and councils (15), though this was a decline from the 1,050 councillors and 18 councils they had won in 1998. It was the first time ever that a political party had won the most seats and councils in a London borough election whilst losing the London-wide popular vote.
In Hackney there was also a mayoral referendum vote.
Results summary[]
| Party[1] | Votes won | % votes | Change | Seats | % seats | Change | Councils | Change | |
|---|---|---|---|---|---|---|---|---|---|
| Conservative | 587,161 | 34.1 | +2.1 | 654 | 35.1 | +116 | 8 | +4 | |
| Labour | 586,290 | 34.1 | -6.6 | 866 | 46.5 | -184 | 15 | -3 | |
| Liberal Democrats | 353,833 | 20.6 | -0.2 | 307 | 16.5 | +6 | 3 | +1 | |
| Green | 95,394 | 5.5 | +2.6 | 1 | 0.1 | -1 | 0 | ±0 | |
| Others | 97,938 | 5.7 | +2.1 | 33 | 1.8 | +7 | 0 | ±0 | |
| No overall control | n/a | n/a | n/a | n/a | n/a | n/a | 6 | -2 | |
- Turnout: 1,653,654 voters cast ballots, a turnout of 31.8% (-3.0%).[2]
Council results[]
| Council | Previous control | Result | Details | ||
|---|---|---|---|---|---|
| Barking and Dagenham | Labour | Labour | Details | ||
| Barnet | No overall control | Conservative | Details | ||
| Bexley | Conservative | Labour | |||
| Brent | Labour | Labour | Details | ||
| Bromley | No overall control | Conservative | Details | ||
| Camden | Labour | Labour | Details | ||
| Croydon | Labour | Labour | Details | ||
| Ealing | Labour | Labour | |||
| Enfield | Labour | Conservative | Details | ||
| Greenwich | Labour | Labour | Details | ||
| Hackney | No overall control | Labour | |||
| Hammersmith and Fulham | Labour | Labour | Details | ||
| Haringey | Labour | Labour | |||
| Harrow | Labour | No overall control | |||
| Havering | No overall control | No overall control | Details | ||
| Hillingdon | No overall control | No overall control | |||
| Hounslow | Labour | Labour | |||
| Islington | No overall control | Liberal Democrats | Details | ||
| Kensington and Chelsea | Conservative | Conservative | Details | ||
| Kingston upon Thames | No overall control | Liberal Democrats | Details | ||
| Lambeth | Labour | No overall control | Details | ||
| Lewisham | Labour | Labour | Details | ||
| Merton | Labour | Labour | Details | ||
| Newham | Labour | Labour | Details | ||
| Redbridge | No overall control | Conservative | |||
| Richmond upon Thames | Liberal Democrats | Conservative | |||
| Southwark | Labour | No overall control | Details | ||
| Sutton | Liberal Democrats | Liberal Democrats | |||
| Tower Hamlets | Labour | Labour | Details | ||
| Waltham Forest | Labour | No overall control | Details | ||
| Wandsworth | Conservative | Conservative | Details | ||
| Westminster | Conservative | Conservative | |||
Overall councillor numbers[]
| London local elections 2002[2][3]
Councillor statistics | |||
|---|---|---|---|
| Party | Seats | Gain/loss | |
| Labour | 866 | -184 | |
| Conservative | 654 | +115 | |
| Liberal Democrats | 307 | +6 | |
| Havering Residents Association | 12 | ||
| Chadwell Heath Residents Association | 4 | ||
| Merton Park Ward Residents Association | 3 | ||
| Rainham & Wennington Independent Residents Group | 3 | ||
| South Hornchurch Independent Residents Group | 3 | ||
| Community Group | 3 | ||
| A future for Brentford FC in your Community | 1 | ||
| CPA | 1 | ||
| Green | 1 | ||
| Local Education Action by Parents | 1 | ||
| Socialist Alternative | 1 | ||
Ward result maps[]
London-wide[]
The map below shows the results for each ward across the whole of Greater London.

By borough[]

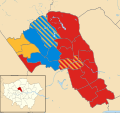
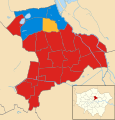
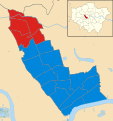
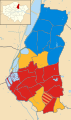
Barking and Dagenham 2002 results map

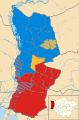
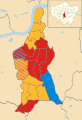
Barnet 2002 results map
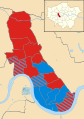
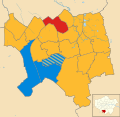
Bexley 2002 results map

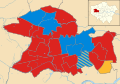
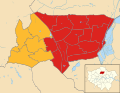
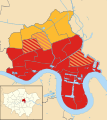
Brent 2002 results map

Bromley 2002 results map
Camden 2002 results map

Croydon 2002 results map
Ealing 2002 results map

Enfield 2002 results map

Greenwich 2002 results map
Hackney 2002 results map
Hammersmith and Fulham 2002 results map
Haringey 2002 results map

Harrow 2002 results map

Havering 2002 results map
Hillingdon 2002 results map

Hounslow 2002 results map

Islington 2002 results map
Kensington and Chelsea 2002 results map

Kingston upon Thames 2002 results map
Lambeth 2002 results map

Lewisham 2002 results map

Merton 2002 results map

Newham 2002 results map

Redbridge 2002 results map

Richmond upon Thames 2002 results map

Southwark 2002 results map
Sutton 2002 results map
Tower Hamlets 2002 results map
Waltham Forest 2002 results map

Wandsworth 2002 results map

Westminster 2002 results map


References[]
- ^ "Year Tables". electionscentre.co.uk. 19 December 2015. Archived from the original on 18 June 2016.
- ^ a b Minors, Michael; Grenham, Dennis. "London Borough Council Elections 2 May 2002" (PDF). files.datapress.com. Greater London Authority. Archived from the original (PDF) on 20 December 2016.
- ^ "2002 results". London Councils. Archived from the original on 19 March 2015. Retrieved 7 March 2015.
| General elections |
|
|---|---|
| Local elections |
|
| European elections | |
| Referendums |
|
- 2002 London Borough council elections
- May 2002 events in the United Kingdom
- London Borough council elections by year