Catubig
Catubig | |
|---|---|
| Municipality of Catubig | |
 Seal | |
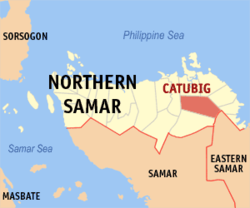 Map of Northern Samar with Catubig highlighted | |
OpenStreetMap  | |
 Catubig Location within the Philippines | |
| Coordinates: 12°24′N 125°03′E / 12.4°N 125.05°ECoordinates: 12°24′N 125°03′E / 12.4°N 125.05°E | |
| Country | |
| Region | Eastern Visayas |
| Province | Northern Samar |
| District | 2nd district |
| Barangays | 47 (see Barangays) |
| Government | |
| • Type | Sangguniang Bayan |
| • Mayor | Galahad O. Vicencio |
| • Vice Mayor | Dionisio Dexter D. Galit |
| • Representative | Jose L. Ong Jr. |
| • Councilors | List |
| • Electorate | 24,976 voters (2019) |
| Area | |
| • Total | 214.99 km2 (83.01 sq mi) |
| Elevation | 47 m (154 ft) |
| Highest elevation | 231 m (758 ft) |
| Lowest elevation | −1 m (−3 ft) |
| Population (2020 census) [3] | |
| • Total | 32,174 |
| • Density | 150/km2 (390/sq mi) |
| • Households | 6,442 |
| Demonym(s) | Catubignon |
| Economy | |
| • Income class | 3rd municipal income class |
| • Poverty incidence | 49.34% (2015)[4] |
| • Revenue | ₱174,253,202.77 (2020) |
| • Assets | ₱511,236,725.56 (2020) |
| • Expenditure | ₱130,345,370.88 (2020) |
| • Liabilities | ₱87,003,745.49 (2020) |
| Service provider | |
| • Electricity | Northern Samar Electric Cooperative (NORSAMELCO) |
| Time zone | UTC+8 (PST) |
| ZIP code | 6418 |
| PSGC | |
| IDD : area code | +63 (0)55 |
| Native languages | Waray Tagalog |
| Website | www |
Catubig, officially the Municipality of Catubig (Waray: Bungto han Catubig; Tagalog: Bayan ng Catubig), is a 3rd class municipality in the province of Northern Samar, Philippines. According to the 2020 census, it has a population of 32,174 people. [3]
History[]
Catubig was mentioned by historian William Henry Scott in his article "Bingi of Lawan" of the Lakanate of Lawan which one of the chieftain was Datu Iberein. The Scott article wrote in the Bingi of Lawan epic: "There lived in this place a chief called Karagrag, who was its lord and ruler. He was married to a lady of his rank called Bingi, a name which had been bestowed on her because of her chastity, as we shall see. I was not able to find out if she came from the same town; most probably she was from upstream on the Catubig River, where she was the daughter of the chief there."[5]
This section needs expansion. You can help by . (October 2012) |
Another tale was mentioned that the name Catubig was also a product of a 'word compact' between Americans and Filipinos. It was stated that an American surveyors saw a cat sunbathing by rolling along the grassy edge of the brook. They then approached a young lady who was doing her laundry and asked, “What is that, cat?” The lass, hardly seeing the cat which was in higher elevation, and not knowing what the foreigners were asking about simply responded, “Tubig,” meaning the water of the brook.
During the Philippine–American War, Catubig was the scene of a battle between the warays and the Americans known as the Siege of Catubig. The Siege of Catubig was fought for four days beginning April 15, 1900.
Barangays[]
Catubig is politically subdivided into 47 barangays.
- Anongo
- Barangay 1 (Poblacion)
- Barangay 2 (Poblacion)
- Barangay 3 (Poblacion)
- Barangay 4 (Poblacion)
- Barangay 5 (Poblacion)
- Barangay 6 (Poblacion)
- Barangay 7 (Poblacion)
- Barangay 8 (Poblacion)
- Bonifacio
- Boring
- Cagbugna
- Cagmanaba
- Cagogobngan
- Calingnan
- Canuctan
- Claro M. Recto (Lobedico)
- D. Mercader (Bongog)
- Guibwangan
- Hinagonoyan
- Hiparayan
- Hitapi-an
- Inoburan
- Irawahan
- Lenoyahan
- Libon
- Magongon
- Magtuad
- Manering
- Nabulo
- Nagoocan
- Nahulid
- Opong
- Osang
- Osmeña
- P. Rebadulla
- Roxas
- Sagudsuron
- San Antonio
- San Francisco
- San Jose (Hebobollao)
- San Vicente
- Santa Fe
- Sulitan
- Tangbo
- Tungodnon
- Vienna Maria
Demographics[]
| Year | Pop. | ±% p.a. |
|---|---|---|
| 1903 | 9,563 | — |
| 1918 | 12,947 | +2.04% |
| 1939 | 18,736 | +1.78% |
| 1948 | 23,456 | +2.53% |
| 1960 | 15,553 | −3.37% |
| 1970 | 18,974 | +2.01% |
| 1975 | 21,063 | +2.12% |
| 1980 | 21,212 | +0.14% |
| 1990 | 22,057 | +0.39% |
| 1995 | 25,190 | +2.52% |
| 2000 | 26,917 | +1.43% |
| 2007 | 29,433 | +1.24% |
| 2010 | 31,723 | +2.76% |
| 2015 | 33,025 | +0.77% |
| 2020 | 32,174 | −0.51% |
| Source: Philippine Statistics Authority [6] [7] [8][9] | ||
Climate[]
| Climate data for Catubig, Northern Samar | |||||||||||||
|---|---|---|---|---|---|---|---|---|---|---|---|---|---|
| Month | Jan | Feb | Mar | Apr | May | Jun | Jul | Aug | Sep | Oct | Nov | Dec | Year |
| Average high °C (°F) | 27 (81) |
27 (81) |
28 (82) |
29 (84) |
30 (86) |
30 (86) |
30 (86) |
30 (86) |
29 (84) |
29 (84) |
28 (82) |
27 (81) |
29 (84) |
| Average low °C (°F) | 23 (73) |
22 (72) |
22 (72) |
23 (73) |
24 (75) |
24 (75) |
24 (75) |
24 (75) |
24 (75) |
24 (75) |
24 (75) |
23 (73) |
23 (74) |
| Average precipitation mm (inches) | 105 (4.1) |
67 (2.6) |
65 (2.6) |
53 (2.1) |
86 (3.4) |
129 (5.1) |
135 (5.3) |
113 (4.4) |
131 (5.2) |
163 (6.4) |
167 (6.6) |
162 (6.4) |
1,376 (54.2) |
| Average rainy days | 17.6 | 13.2 | 15.5 | 14.9 | 19.6 | 24.3 | 26.6 | 25.4 | 24.9 | 25.4 | 22.9 | 20.9 | 251.2 |
| Source: Meteoblue (modeled/calculated data, not measured locally) [10] | |||||||||||||
Economy[]
| Poverty Incidence of Catubig | |
| Source: Philippine Statistics Authority[11][12][13][14][15][16] | |
Landmarks[]
- Hanging Bridge of Catubig
- St. Joseph Parish Church
- Battle of Catubig Shrine
References[]
- ^ Municipality of Catubig | (DILG)
- ^ "2015 Census of Population, Report No. 3 – Population, Land Area, and Population Density" (PDF). Philippine Statistics Authority. Quezon City, Philippines. August 2016. ISSN 0117-1453. Archived (PDF) from the original on May 25, 2021. Retrieved July 16, 2021.
- ^ a b Census of Population (2020). "Region VIII (Eastern Visayas)". Total Population by Province, City, Municipality and Barangay. PSA. Retrieved 8 July 2021.
- ^ https://psa.gov.ph/sites/default/files/City%20and%20Municipal-level%20Small%20Area%20Poverty%20Estimates_%202009%2C%202012%20and%202015_0.xlsx; publication date: 10 July 2019; publisher: Philippine Statistics Authority.
- ^ Scott, William Henry (1985). Cracks in the parchment curtain and other essays in Philippine history. New Day Publishers. p. 93. ISBN 978-971-10-0073-8.
- ^ Census of Population (2015). "Region VIII (Eastern Visayas)". Total Population by Province, City, Municipality and Barangay. PSA. Retrieved 20 June 2016.
- ^ Census of Population and Housing (2010). "Region VIII (Eastern Visayas)". Total Population by Province, City, Municipality and Barangay. NSO. Retrieved 29 June 2016.
- ^ Censuses of Population (1903–2007). "Region VIII (Eastern Visayas)". Table 1. Population Enumerated in Various Censuses by Province/Highly Urbanized City: 1903 to 2007. NSO.
- ^ "Province of Northern Samar". Municipality Population Data. Local Water Utilities Administration Research Division. Retrieved 17 December 2016.
- ^ "Catubig, Northern Samar : Average Temperatures and Rainfall". Meteoblue. Retrieved 6 January 2019.
- ^ "Poverty incidence (PI):". Philippine Statistics Authority. Retrieved 28 December 2020.
- ^ https://psa.gov.ph/sites/default/files/NSCB_LocalPovertyPhilippines_0.pdf; publication date: 29 November 2005; publisher: Philippine Statistics Authority.
- ^ https://psa.gov.ph/sites/default/files/2003%20SAE%20of%20poverty%20%28Full%20Report%29_1.pdf; publication date: 23 March 2009; publisher: Philippine Statistics Authority.
- ^ https://psa.gov.ph/sites/default/files/2006%20and%202009%20City%20and%20Municipal%20Level%20Poverty%20Estimates_0_1.pdf; publication date: 3 August 2012; publisher: Philippine Statistics Authority.
- ^ https://psa.gov.ph/sites/default/files/2012%20Municipal%20and%20City%20Level%20Poverty%20Estima7tes%20Publication%20%281%29.pdf; publication date: 31 May 2016; publisher: Philippine Statistics Authority.
- ^ https://psa.gov.ph/sites/default/files/City%20and%20Municipal-level%20Small%20Area%20Poverty%20Estimates_%202009%2C%202012%20and%202015_0.xlsx; publication date: 10 July 2019; publisher: Philippine Statistics Authority.
External links[]
- Catubig Profile at PhilAtlas.com
- Philippine Standard Geographic Code
- Philippine Census Information
- Local Governance Performance Management System
- The Battle of Catubig
Places adjacent to Catubig | ||||||||||||||||
|---|---|---|---|---|---|---|---|---|---|---|---|---|---|---|---|---|
| ||||||||||||||||
- Municipalities of Northern Samar