Cerniaz
Cerniaz | |
|---|---|
 Coat of arms | |
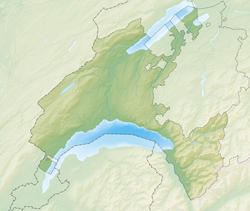
show Location of Cerniaz | |
 Cerniaz | |
| Coordinates: 46°44′N 6°54′E / 46.733°N 6.900°ECoordinates: 46°44′N 6°54′E / 46.733°N 6.900°E | |
| Country | Switzerland |
| Canton | Vaud |
| District | Broye-Vully |
| Area | |
| • Total | 1.77 km2 (0.68 sq mi) |
| Elevation | 687 m (2,254 ft) |
| Population (2009) | |
| • Total | 42 |
| • Density | 24/km2 (61/sq mi) |
| Time zone | UTC+01:00 (Central European Time) |
| • Summer (DST) | UTC+02:00 (Central European Summer Time) |
| Postal code(s) | 1682 |
| SFOS number | 5811 |
| Surrounded by | Henniez, Seigneux, Villars-Bramard, Villarzel |
| Website | Profile (in French), SFSO statistics |


Cerniaz is a former municipality in the district of Broye-Vully in the canton of Vaud in Switzerland.
The municipalities of Cerniaz, Combremont-le-Grand, Combremont-le-Petit, Granges-près-Marnand, Marnand, Sassel, Seigneux and Villars-Bramard merged on 1 July 2011 into the new municipality of Valbroye.[1]
History[]
Cerniaz is first mentioned in 1444 as Sernia.[2]
Geography[]
Cerniaz has an area, as of 2009, of 1.8 square kilometers (0.69 sq mi). Of this area, 1.38 km2 (0.53 sq mi) or 76.7% is used for agricultural purposes, while 0.38 km2 (0.15 sq mi) or 21.1% is forested. Of the rest of the land, 0.07 km2 (17 acres) or 3.9% is settled (buildings or roads).[3]
Of the built up area, housing and buildings made up 2.2% and transportation infrastructure made up 1.7%. Out of the forested land, 19.4% of the total land area is heavily forested and 1.7% is covered with orchards or small clusters of trees. Of the agricultural land, 63.3% is used for growing crops and 11.7% is pastures, while 1.7% is used for orchards or vine crops.[3]
The municipality was part of the Payerne District until it was dissolved on 31 August 2006, and Cerniaz became part of the new district of Broye-Vully.[4]
The former municipality is located on a plateau above the Broye valley and near the border with the Canton of Fribourg. It consists of the village of Cerniaz and the hamlet of La Morettaz.
Coat of arms[]
The blazon of the municipal coat of arms is Gules, three trunks bendwise eradicated Argent.[5]
Demographics[]
Cerniaz has a population (as of 2009) of 42, all Swiss citizens.[6] Over the last 10 years (1999–2009 ) the population has changed at a rate of -36.4%. It has changed at a rate of -30.3% due to migration and at a rate of -6.1% due to births and deaths.[6]
Most of the population (as of 2000) speaks French (62 or 98.4%) with the rest speaking German.[7]
Of the population in the municipality 28 or about 44.4% were born in Cerniaz and lived there in 2000. There were 20 or 31.7% who were born in the same canton, while 14 or 22.2% were born somewhere else in Switzerland, and 1 or 1.6% were born outside of Switzerland.[7]
In 2008 there was 1 live birth to Swiss citizens. Ignoring immigration and emigration, the population of Swiss citizens increased by 1 while the foreign population remained the same. The total Swiss population change in 2008 (from all sources, including moves across municipal borders) was a decrease of 8 and the non-Swiss population remained the same. This represents a population growth rate of -14.8%.[8]
The age distribution, as of 2009, in Cerniaz is; 3 children or 7.1% of the population are between 0 and 9 years old and 5 teenagers or 11.9% are between 10 and 19. Of the adult population, 3 people or 7.1% of the population are between 20 and 29 years old. 6 people or 14.3% are between 30 and 39, 5 people or 11.9% are between 40 and 49, and 4 people or 9.5% are between 50 and 59. The senior population distribution is 7 people or 16.7% of the population are between 60 and 69 years old, 8 people or 19.0% are between 70 and 79,there is 1 person who is between 80 and 89.[9]
As of 2000, there were 25 people who were single and never married in the municipality. There were 26 married individuals, 7 widows or widowers and 5 individuals who are divorced.[7]
As of 2000 the average number of residents per living room was 0.52 which is fewer people per room than the cantonal average of 0.61 per room.[6] In this case, a room is defined as space of a housing unit of at least 4 m2 (43 sq ft) as normal bedrooms, dining rooms, living rooms, kitchens and habitable cellars and attics.[10] About 60% of the total households were owner occupied, or in other words did not pay rent (though they may have a mortgage or a rent-to-own agreement).[11]
As of 2000, there were 27 private households in the municipality, and an average of 2.3 persons per household.[6] There were 7 households that consist of only one person and 2 households with five or more people. Out of a total of 27 households that answered this question, 25.9% were households made up of just one person. Of the rest of the households, there are 10 married couples without children, 8 married couples with children. There were 2 households that were made up of unrelated people.[7]
In 2000 there were 12 single family homes (or 50.0% of the total) out of a total of 24 inhabited buildings. There was 1 multi-family building (4.2%) and 11 multi-purpose buildings that were mostly used for housing (45.8%). Of the single family homes 8 were built before 1919, while none were built between 1990 and 2000. The multi-family home was built between 1981 and 1990.[12]
In 2000 there were 26 apartments in the municipality. The most common apartment size was 5 rooms of which there were 9. There were 1 single room apartments and 15 apartments with five or more rooms. Of these apartments, a total of 25 apartments (96.2% of the total) were permanently occupied, while 1 apartment (3.8%) was seasonally occupied.[12] As of 2009, the construction rate of new housing units was 0 new units per 1000 residents.[6] The vacancy rate for the municipality, in 2010, was 0%.[6]
The historical population is given in the following chart:[2][13]

Politics[]
In the 2007 federal election the most popular party was the SVP which received 42.74% of the vote. The next three most popular parties were the FDP (26.5%), the Green Party (11.54%) and the EDU Party (7.69%). In the federal election, a total of 13 votes were cast, and the voter turnout was 31.0%.[14]
Economy[]
As of 2010, Cerniaz had an unemployment rate of 0%. As of 2008, there were 8 people employed in the primary economic sector and about 5 businesses involved in this sector. No one was employed in the secondary sector or tertiary sector.[6] There were 22 residents of the municipality who were employed in some capacity, of which females made up 22.7% of the workforce. In 2008 the total number of full-time equivalent jobs was 5, all of which were in agriculture.[15]
In 2000, there were 14 workers who commuted away from the municipality.[16] Of the working population, 4.5% used public transportation to get to work, and 59.1% used a private car.[6]
Religion[]
From the 2000 census, 13 or 20.6% were Roman Catholic, while 40 or 63.5% belonged to the Swiss Reformed Church. Of the rest of the population, there was 1 individual who belongs to another Christian church. 9 (or about 14.29% of the population) belonged to no church, are agnostic or atheist.[7]
Education[]
| Wikimedia Commons has media related to Cerniaz. |
In Cerniaz about 19 or (30.2%) of the population have completed non-mandatory upper secondary education, and 4 or (6.3%) have completed additional higher education (either University or a Fachhochschule). Of the 4 who completed tertiary schooling, 75.0% were Swiss men, 25.0% were Swiss women.[7]
In the 2009/2010 school year there were a total of 3 students in the Cerniaz (VD) school district. In the Vaud cantonal school system, two years of non-obligatory pre-school are provided by the political districts.[17] During the school year, the political district provided pre-school care for a total of 155 children of which 83 children (53.5%) received subsidized pre-school care. The canton's primary school program requires students to attend for four years. There was 1 student in the municipal primary school program. The obligatory lower secondary school program lasts for six years and there were 2 students in those schools.[18]
As of 2000, there were 8 students from Cerniaz who attended schools outside the municipality.[16]
References[]
- ^ Amtliches Gemeindeverzeichnis der Schweiz published by the Swiss Federal Statistical Office (in German) accessed 17 February 2011
- ^ Jump up to: a b Cerniaz in German, French and Italian in the online Historical Dictionary of Switzerland.
- ^ Jump up to: a b Swiss Federal Statistical Office-Land Use Statistics 2009 data (in German) accessed 25 March 2010
- ^ Nomenklaturen – Amtliches Gemeindeverzeichnis der Schweiz Archived 2015-11-13 at the Wayback Machine (in German) accessed 4 April 2011
- ^ Flags of the World.com accessed 10-May-2011
- ^ Jump up to: a b c d e f g h Swiss Federal Statistical Office Archived September 4, 2011, at the Wayback Machine accessed 10-May-2011
- ^ Jump up to: a b c d e f STAT-TAB Datenwürfel für Thema 40.3 - 2000 Archived April 9, 2014, at the Wayback Machine (in German) accessed 2 February 2011
- ^ Swiss Federal Statistical Office - Superweb database - Gemeinde Statistics 1981-2008 Archived June 28, 2010, at the Wayback Machine (in German) accessed 19 June 2010
- ^ Canton of Vaud Statistical Office Archived 2015-03-16 at the Wayback Machine (in French) accessed 29 April 2011
- ^ Eurostat. "Housing (SA1)". Urban Audit Glossary (PDF). 2007. p. 18. Archived from the original (pdf) on 14 November 2009. Retrieved 12 February 2010.
- ^ Urban Audit Glossary pg 17
- ^ Jump up to: a b Swiss Federal Statistical Office STAT-TAB - Datenwürfel für Thema 09.2 - Gebäude und Wohnungen Archived September 7, 2014, at the Wayback Machine (in German) accessed 28 January 2011
- ^ Swiss Federal Statistical Office STAT-TAB Bevölkerungsentwicklung nach Region, 1850-2000 Archived September 30, 2014, at the Wayback Machine (in German) accessed 29 January 2011
- ^ Swiss Federal Statistical Office, Nationalratswahlen 2007: Stärke der Parteien und Wahlbeteiligung, nach Gemeinden/Bezirk/Canton Archived May 14, 2015, at the Wayback Machine (in German) accessed 28 May 2010
- ^ Swiss Federal Statistical Office STAT-TAB Betriebszählung: Arbeitsstätten nach Gemeinde und NOGA 2008 (Abschnitte), Sektoren 1-3 Archived December 25, 2014, at the Wayback Machine (in German) accessed 28 January 2011
- ^ Jump up to: a b Swiss Federal Statistical Office - Statweb (in German) accessed 24 June 2010
- ^ Organigramme de l'école vaudoise, année scolaire 2009-2010 Archived 2016-03-04 at the Wayback Machine (in French) accessed 2 May 2011
- ^ Canton of Vaud Statistical Office - Scol. obligatoire/filières de transition Archived 2016-04-25 at the Wayback Machine (in French) accessed 2 May 2011
| Authority control |
|---|
- Former municipalities of the canton of Vaud