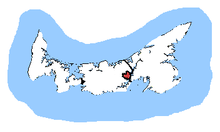
Charlottetown (formerly Hillsborough ) is a federal electoral district in Prince Edward Island , Canada, that has been represented in the House of Commons of Canada since 2004. The district, which includes the entire City of Charlottetown , has an area of 46 km2 and a population of 34,562 as of 2011.[2]
Demographics [ ] Ethnic groups: 97.2% WhiteLanguages: 94.8% English, 2.1% French, 2.5% OtherReligions: 47.7% Catholic, 39.5% Protestant, 2.5% Other Christian, 8.3% no affiliationAverage income: $26,205According to the Canada 2016 Census Twenty most common mother tongue languages (2016) : 86.8% English, 3.7% Mandarin, 2.1% French, 1.3% Arabic, 0.6% Nepali, 0.4% Cantonese, 0.4% Spanish, 0.4% Tagalog, 0.3% Farsi, 0.3% Russian, 0.2% Dutch, 0.2% Vietnamese, 0.2% Albanian, 0.2% Korean[3] History [ ] From 1966 until 2004, most of the Charlottetown riding was part of the riding of Hillsborough. In 2003, there was a riding readjustment; a part of the old Hillsborough riding became part of Cardigan . 96.4% of the riding of Charlottetown was previously part of the Hillsborough riding, and 3.6% was previously part of Malpeque . There were no boundary changes as a result of the 2012 federal electoral redistribution .
Member of Parliament [ ] This riding has elected the following Members of Parliament :
Election results [ ] Graph of election results in Hillsborough, Charlottetown (minor parties that never got 2% of the vote or didn't run consistently are omitted)
Charlottetown [ ] Graph of election results in Charlottetown (minor parties that never got 2% of the vote or didn't run consistently are omitted)
2021 general election [ ] 2019 general election [ ]
hide 2019 Canadian federal election
Party
Candidate
Votes
%
Expenditures
Liberal Sean Casey 8,812
44.26
−12.01
$81,859.21
Green Darcie Lanthier
4,648
23.35
+17.57
$36,415.23
Conservative Robert A. Campbell
4,040
20.29
+5.47
$46,459.01
New Democratic Joe Byrne 2,238
11.24
−11.90
$4,819.38
Christian Heritage Fred MacLeod
172
0.86
New $1,200.90
Total valid votes/Expense limit
19,910 100.0 $86,542.92
Total rejected ballots
274 1.36 +0.89
Turnout
20,184 73.45 −2.14
Eligible voters
27,480
Liberal hold
Swing
−14.79
Source: Elections Canada [5]
2015 general election [ ]
hide 2015 Canadian federal election : Charlottetown
Party
Candidate
Votes
%
Expenditures
Liberal Sean Casey 11,910
56.27
+16.79
$133,567.53
New Democratic Joe Byrne 4,897
23.14
–1.94
$51,147.58
Conservative Ron MacMillan
3,136
14.82
–17.89
$73,560.00
Green Becka Viau
1,222
5.77
+3.51
$5,912.52
Total valid votes/Expense limit
21,165 99.53 $170,107.74
Total rejected ballots
99 0.47 –0.14
Turnout
21,264 76.24 +6.14
Eligible voters
27,891
Liberal hold
Swing
+9.36
Source: Elections Canada [6] [7]
2011 general election [ ]
hide 2011 Canadian federal election : Charlottetown
Party
Candidate
Votes
%
Expenditures
Liberal Sean Casey 7,292
39.48
-10.58
$61,465.09
Conservative Donna Profit
6,040
32.71
+0.60
$48,556.35
New Democratic Joe Byrne 4,632
25.08
+12.77
$45,026.11
Green Eliza Knockwood
417
2.26
-2.57
$2,301.92
Christian Heritage Baird Judson
87
0.47
-0.23
$3,159.86
Total valid votes/Expense limit
18,468 100.0 – $69,664.10
Total rejected ballots
113 0.61 -0.16
Turnout
18,581 70.10 +3.96
Eligible voters
26,507
Liberal hold
Swing
-5.59
Sources:[8] [9]
2008 general election [ ]
hide 2008 Canadian federal election
Party
Candidate
Votes
%
Expenditures
Liberal Shawn Murphy 8,893
50.06
-0.10
$66,093.14
Conservative Tom DeBlois
5,704
32.11
-2.03
$48,302.66
New Democratic Brian Pollard
2,187
12.31
+1.19
$4,744.42
Green Laura Bisaillon
858
4.83
+1.76
$1,257.27
Christian Heritage Baird Judson
124
0.70
+0.19
$8,750.00
Total valid votes/Expense limit
17,776 100.0 – $67,455
Total rejected, unmarked and declined ballots
137 0.77 +0.18
Turnout
17,913 66.14 -4.61
Eligible voters
27,083
Liberal hold
Swing
+0.96
2006 general election [ ]
hide 2006 Canadian federal election
Party
Candidate
Votes
%
Expenditures
Liberal Shawn Murphy 9,586
50.16
+0.80
$60,442.09
Conservative Tom DeBlois
6,524
34.14
+6.59
$60,317.15
New Democratic Brian Pollard
2,126
11.12
-7.32
$5,251.38
Green David Daughton
586
3.07
-1.02
$780.62
Marijuana Andrew J. Chisholm
193
1.01
–
none listed
Christian Heritage Baird Judson
97
0.51
-0.05
$5,346.77
Total valid votes/Expense limit
19,112 100.0 – $62,665
Total rejected, unmarked and declined ballots
114 0.59 -0.12
Turnout
19,226 70.75 +3.45
Eligible voters
27,175
Liberal hold
Swing
-2.90
2004 general election [ ]
hide 2004 Canadian federal election
Party
Candidate
Votes
%
Expenditures
Liberal Shawn Murphy 9,175
49.36
+6.80
$59,677.46
Conservative Darren Peters
5,121
27.55
-7.80
$60,605.56
New Democratic Dody Crane 3,428
18.44
-2.91
$13,197.84
Green Will McFadden
760
4.09
–
$1,647.47
Christian Heritage Baird Judson
105
0.56
–
$2,837.13
Total valid votes/Expense limit
18,589 100.0 – $61,440
Total rejected, unmarked and declined ballots
133 0.71
Turnout
18,722 67.30
Eligible voters
27,820
Liberal notional hold
Swing
+7.30
Changes from 2000 are based on redistributed results. Change for the Conservatives is based on the combined total of the Progressive Conservatives and the Canadian Alliance.
Hillsborough [ ] Graph of election results in Hillsborough (minor parties that never got 2% of the vote or didn't run consistently are omitted)
2000 general election [ ] 1997 general election [ ] 1993 general election [ ] 1988 general election [ ] 1984 general election [ ] 1980 general election [ ] 1979 general election [ ] 1974 general election [ ] 1972 general election [ ] 1968 general election [ ] Student Vote results [ ] In a Student Vote, participating Canadian schools to parallel the Canadian federal election results. The vote was designed to educate students and simulate the electoral process for persons who have not yet reached the legal majority. Schools with a large student body that reside in another electoral district had the option to vote for candidates outside of the electoral district then where they were physically located.[10]
Graph of student vote election results in Charlottetown (minor parties that never got 2% of the vote or didn't run consistently are omitted)
2019 election [ ] 2015 election [ ] 2011 election [ ] See also [ ] References [ ] Notes [ ]
^ Jump up to: a b Statistics Canada : 2012^ "Electoral District Profile - Charlottetown (Prince Edward Island)" . elections.ca . Elections Canada. Retrieved 23 August 2018 .^ "Mother Tongue (269), Knowledge of Official Languages (5), Age (15A) and Sex (3) for the Population Excluding Institutional Residents of Canada, Provinces and Territories and Federal Electoral Districts (2013 Representation Order), 2016 Census - 100% Data" . 2 August 2017.^ "Confirmed candidates — Charlottetown" . Elections Canada . Retrieved 1 September 2021 .^ "Results Validated by the Returning Officer" . Elections Canada . Retrieved 25 October 2019 .^ "October 19, 2015 Election Results — Charlottetown (Validated results)" . Elections Canada . 20 October 2015. Retrieved 24 October 2015 .^ Elections Canada – Preliminary Election Expenses Limits for Candidates Archived August 15, 2015, at the Wayback Machine ^ Elections Canada – Official voting results, Forty-first general election, 2011 ^ Elections Canada – Candidate's electoral campaign return, 41st general election ^ "School by School results" . Student Vote Canada. Archived from the original on 2015-05-06. Retrieved 2013-06-12 .^ "Student Vote Canada 2019 Results" . Student Vote Canada 2019 . Retrieved June 12, 2020 .