Conner, Apayao
Conner | |
|---|---|
| Municipality of Conner | |
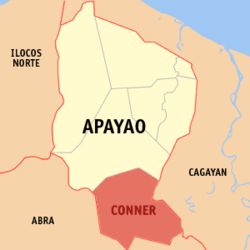 Map of Apayao with Conner highlighted | |
show OpenStreetMap | |
 Conner Location within the Philippines | |
| Coordinates: 17°48′N 121°20′E / 17.8°N 121.33°ECoordinates: 17°48′N 121°20′E / 17.8°N 121.33°E | |
| Country | Philippines |
| Region | Cordillera Administrative Region |
| Province | Apayao |
| District | Lone district |
| Barangays | 21 (see Barangays) |
| Government | |
| • Type | Sangguniang Bayan |
| • Mayor | Martina W. Dangoy |
| • Vice Mayor | Jorico F. Bayaua |
| • Representative | Elias C. Bulut Jr. |
| • Electorate | 15,644 voters (2019) |
| Area | |
| • Total | 694.30 km2 (268.07 sq mi) |
| Elevation | 174 m (571 ft) |
| Highest elevation | 532 m (1,745 ft) |
| Lowest elevation | 54 m (177 ft) |
| Population (2020 census) [3] | |
| • Total | 27,552 |
| • Density | 40/km2 (100/sq mi) |
| • Households | 5,466 |
| Economy | |
| • Income class | 2nd municipal income class |
| • Poverty incidence | 21.60% (2015)[4] |
| • Revenue | ₱146,204,103.30 (2016) |
| Service provider | |
| • Electricity | Kalinga - Apayao Electric Cooperative (KAELCO) |
| Time zone | UTC+8 (PST) |
| ZIP code | 3807 |
| PSGC | |
| IDD : area code | +63 (0)74 |
| Climate type | tropical rainforest climate |
| Native languages | Isnag Kalinga Ilocano Tagalog |


Conner, officially the Municipality of Conner, (Ilocano: Ili ti Conner; Tagalog: Bayan ng Conner), is a 2nd class municipality in the province of Apayao, Philippines. According to the 2020 census, it has a population of 27,552 people. [3]
Geography[]
According to the Philippine Statistics Authority, the municipality has a land area of 694.30 square kilometres (268.07 sq mi) [5] constituting 15.73% of the 4,413.35-square-kilometre- (1,704.00 sq mi) total area of Apayao.
The town was named after the American Engineer, Norman Conner, who spearheaded the construction of the main roads and thoroughfares within the Province of Apayao, thus, effectively ending the isolation of the Province from the outside world during the early American Era.
Barangays[]
Conner is politically subdivided into 21 barangays.[6]
| PSGC | Barangay | Population | ±% p.a. | |||
|---|---|---|---|---|---|---|
| 2020 [3] | 2010 [7] | |||||
| 148102001 | Allangigan | 1.8% | 494 | 424 | 1.49% | |
| 148102018 | Banban | 3.9% | 1,088 | 1,042 | 0.42% | |
| 148102002 | Buluan | 5.6% | 1,537 | 1,462 | 0.48% | |
| 148102003 | Caglayan (New Poblacion) | 7.7% | 2,132 | 1,865 | 1.30% | |
| 148102004 | Calafug | 3.8% | 1,041 | 906 | 1.35% | |
| 148102005 | Cupis | 1.6% | 446 | 441 | 0.11% | |
| 148102006 | Daga | 4.8% | 1,315 | 1,281 | 0.25% | |
| 148102019 | Guinaang | 5.5% | 1,507 | 1,476 | 0.20% | |
| 148102007 | Guinamgaman | 2.9% | 798 | 841 | −0.51% | |
| 148102020 | Ili | 4.8% | 1,325 | 1,195 | 1.00% | |
| 148102008 | Karikitan | 6.8% | 1,879 | 1,928 | −0.25% | |
| 148102009 | Katablangan | 2.0% | 559 | 697 | −2.11% | |
| 148102010 | Malama | 10.8% | 2,979 | 2,885 | 0.31% | |
| 148102011 | Manag | 6.4% | 1,771 | 1,629 | 0.81% | |
| 148102021 | Mawegui | 2.9% | 800 | 763 | 0.46% | |
| 148102012 | Nabuangan | 1.9% | 528 | 594 | −1.13% | |
| 148102013 | Paddaoan | 6.1% | 1,678 | 1,623 | 0.32% | |
| 148102014 | Puguin | 3.1% | 859 | 805 | 0.63% | |
| 148102015 | Ripang (Old Poblacion) | 3.6% | 979 | 841 | 1.48% | |
| 148102016 | Sacpil | 4.5% | 1,230 | 1,141 | 0.73% | |
| 148102017 | Talifugo | 4.0% | 1,106 | 972 | 1.25% | |
| Total | 27,552 | 24,811 | 1.02% | |||
Climate[]
| hideClimate data for Conner, Apayao | |||||||||||||
|---|---|---|---|---|---|---|---|---|---|---|---|---|---|
| Month | Jan | Feb | Mar | Apr | May | Jun | Jul | Aug | Sep | Oct | Nov | Dec | Year |
| Average high °C (°F) | 25 (77) |
27 (81) |
29 (84) |
32 (90) |
32 (90) |
31 (88) |
31 (88) |
30 (86) |
30 (86) |
29 (84) |
27 (81) |
25 (77) |
29 (84) |
| Average low °C (°F) | 20 (68) |
21 (70) |
21 (70) |
23 (73) |
24 (75) |
25 (77) |
24 (75) |
25 (77) |
24 (75) |
23 (73) |
23 (73) |
21 (70) |
23 (73) |
| Average precipitation mm (inches) | 109 (4.3) |
78 (3.1) |
64 (2.5) |
54 (2.1) |
181 (7.1) |
196 (7.7) |
204 (8.0) |
211 (8.3) |
174 (6.9) |
198 (7.8) |
185 (7.3) |
231 (9.1) |
1,885 (74.2) |
| Average rainy days | 17.2 | 13.7 | 13.2 | 13.0 | 21.7 | 23.4 | 25.2 | 25.2 | 21.9 | 17.7 | 18.6 | 20.8 | 231.6 |
| Source: Meteoblue [8] | |||||||||||||
Demographics[]
| Year | Pop. | ±% p.a. |
|---|---|---|
| 1918 | 1,628 | — |
| 1939 | 1,872 | +0.67% |
| 1948 | 2,112 | +1.35% |
| 1960 | 3,750 | +4.90% |
| 1970 | 9,419 | +9.64% |
| 1975 | 12,255 | +5.42% |
| 1980 | 14,196 | +2.98% |
| 1990 | 16,220 | +1.34% |
| 1995 | 17,461 | +1.39% |
| 2000 | 20,429 | +3.42% |
| 2007 | 22,668 | +1.44% |
| 2010 | 24,811 | +3.34% |
| 2015 | 26,051 | +0.93% |
| 2020 | 27,552 | +1.11% |
| Source: Philippine Statistics Authority [9] [7] [10][11] | ||
In the 2020 census, Conner had a population of 27,552. [3] The population density was 40 inhabitants per square kilometre (100/sq mi).
Economy[]
| Poverty Incidence of Conner | |
| Source: Philippine Statistics Authority[12][13][14][15][16][17] | |
References[]
- ^ Municipality of Conner | (DILG)
- ^ "2015 Census of Population, Report No. 3 – Population, Land Area, and Population Density" (PDF). Philippine Statistics Authority. Quezon City, Philippines. August 2016. ISSN 0117-1453. Archived (PDF) from the original on May 25, 2021. Retrieved July 16, 2021.
- ^ Jump up to: a b c d Census of Population (2020). "Cordillera Administrative Region (CAR)". Total Population by Province, City, Municipality and Barangay. PSA. Retrieved 8 July 2021.
- ^ https://psa.gov.ph/sites/default/files/City%20and%20Municipal-level%20Small%20Area%20Poverty%20Estimates_%202009%2C%202012%20and%202015_0.xlsx; publication date: 10 July 2019; publisher: Philippine Statistics Authority.
- ^ "Province: Apayao". PSGC Interactive. Quezon City, Philippines: Philippine Statistics Authority. Retrieved 12 November 2016.
- ^ "Municipal: Conner, Apayao". PSGC Interactive. Quezon City, Philippines: Philippine Statistics Authority. Retrieved 8 January 2016.
- ^ Jump up to: a b Census of Population and Housing (2010). "Cordillera Administrative Region (CAR)". Total Population by Province, City, Municipality and Barangay. NSO. Retrieved 29 June 2016.
- ^ "Conner: Average Temperatures and Rainfall". Meteoblue. Retrieved 8 March 2020.
- ^ Census of Population (2015). "Cordillera Administrative Region (CAR)". Total Population by Province, City, Municipality and Barangay. PSA. Retrieved 20 June 2016.
- ^ Censuses of Population (1903–2007). "Cordillera Administrative Region (CAR)". Table 1. Population Enumerated in Various Censuses by Province/Highly Urbanized City: 1903 to 2007. NSO.
- ^ "Province of Apayao". Municipality Population Data. Local Water Utilities Administration Research Division. Retrieved 17 December 2016.
- ^ "Poverty incidence (PI):". Philippine Statistics Authority. Retrieved 28 December 2020.
- ^ https://psa.gov.ph/sites/default/files/NSCB_LocalPovertyPhilippines_0.pdf; publication date: 29 November 2005; publisher: Philippine Statistics Authority.
- ^ https://psa.gov.ph/sites/default/files/2003%20SAE%20of%20poverty%20%28Full%20Report%29_1.pdf; publication date: 23 March 2009; publisher: Philippine Statistics Authority.
- ^ https://psa.gov.ph/sites/default/files/2006%20and%202009%20City%20and%20Municipal%20Level%20Poverty%20Estimates_0_1.pdf; publication date: 3 August 2012; publisher: Philippine Statistics Authority.
- ^ https://psa.gov.ph/sites/default/files/2012%20Municipal%20and%20City%20Level%20Poverty%20Estima7tes%20Publication%20%281%29.pdf; publication date: 31 May 2016; publisher: Philippine Statistics Authority.
- ^ https://psa.gov.ph/sites/default/files/City%20and%20Municipal-level%20Small%20Area%20Poverty%20Estimates_%202009%2C%202012%20and%202015_0.xlsx; publication date: 10 July 2019; publisher: Philippine Statistics Authority.
External links[]
![]() Media related to Conner, Apayao at Wikimedia Commons
Media related to Conner, Apayao at Wikimedia Commons
| show Places adjacent to Conner, Apayao |
|---|
| show Authority control |
|---|
This article about a location in the Cordillera Administrative Region is a stub. You can help Wikipedia by . |
- Municipalities of Apayao
- Philippines geography stubs