Demographics of Cleveland
The demographics of Cleveland have fluctuated throughout the city's history. From its founding in 1796, the city's population grew to 796,841 in 1920, making it the fifth largest city in the United States at the time. By 1930, the population rose to 900,429 and, after World War II, it reached 914,808.[1] Due to various historical factors including deindustrialization, suburbanization, and urban sprawl, Cleveland's population began decreasing in the 1960s. By 1980, the city's population was 573,822 and it had lost its position as one of the top 10 largest cities in the U.S.[1] By 2019, the population had further fallen to 381,009.[2] Beginning in 2018, the city's population began to flatten, after decades of decline.[3] Additionally, since 2010, some neighborhoods within Cleveland, notably Downtown, have begun seeing a population increase.[4]
Population data (2010)[]
| Year | Pop. | ±% |
|---|---|---|
| 1820 | 606 | — |
| 1830 | 1,075 | +77.4% |
| 1840 | 6,071 | +464.7% |
| 1850 | 17,034 | +180.6% |
| 1860 | 43,417 | +154.9% |
| 1870 | 92,829 | +113.8% |
| 1880 | 160,146 | +72.5% |
| 1890 | 261,353 | +63.2% |
| 1900 | 381,768 | +46.1% |
| 1910 | 560,663 | +46.9% |
| 1920 | 796,841 | +42.1% |
| 1930 | 900,429 | +13.0% |
| 1940 | 878,336 | −2.5% |
| 1950 | 914,808 | +4.2% |
| 1960 | 876,050 | −4.2% |
| 1970 | 750,903 | −14.3% |
| 1980 | 573,822 | −23.6% |
| 1990 | 505,616 | −11.9% |
| 2000 | 478,403 | −5.4% |
| 2010 | 396,815 | −17.1% |
| 2019* | 381,009 | −4.0% |
| * = Population estimate. Source: United States Census records and Population Estimates Program data.[1][5][2] | ||
As of the 2010 Census, there were 396,815 people, 167,490 households, and 89,821 families residing in the city of Cleveland (a population roughly comparable to that of Zurich). The population density was 5,113/sq mi (1,974/km2). During the day, incoming commuters from other parts of Cuyahoga County and the Greater Cleveland metropolitan area increase Cleveland's population by 30%.[6]
According to 2010 Census, there were 167,490 households in Cleveland, and 111,904 families residing in the city. The population density was 5,107.2 people per square mile (2,380.9/km2). There were 207,536 housing units at an average density of 2,782.4 per square mile (1,074.3/km2). 53.6% were family households and 46.4% were non family households. A total of 25.2% of households had children under 18 years, and 10.7% had someone over the age of 65. The average household size was 2.29, while the average family size was 3.11.[5] In the city, the age of the population was spread out, with 28.5% under the age of 18, 9.5% from 18 to 24, 30.4% from 25 to 44, 19.0% from 45 to 64, and 12.5% who are 65 years of age or older. The median age was 35.7 years. Females comprised 52.0% of the population and males accounted for 48.0%.[5]
The median income for a household in the city was $27,349, and the median income for a family was $31,182. The per capita income for the city was $16,302. 31.0% of the population and 22.9% of families were below the poverty line. Out of the total population, 37.6% of those under the age of 18 and 16.8% of those 65 and older were living below the poverty line. Of the city's population over the age of 25, 13.1% held a bachelor's degree or higher, and 75.7% had a high school diploma or equivalent.[5]
Ethnic and racial composition[]
White Black Hispanic Asian Other
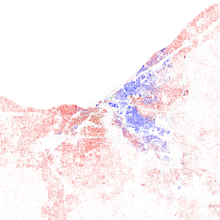
According to the 2019 census estimate, the ethnic and racial composition of Cleveland was 40% white (33.8% non-Hispanic white), 48.8% African American (non-Hispanic), 0.5% Native American, 2.6% Asian, and 4.4% from two or more races. Hispanics or Latinos of any race were 12% of the population.[2] 14.7% spoke a language other than English at home, including Spanish, Arabic, Chinese, and various Slavic languages (Russian, Polish, Serbo-Croatian, and Slovene).[2] There is no ethnic or racial majority in Cleveland. A 2020 analysis found the city to be the most ethnically and racially diverse in Ohio.[7]
Within Cleveland, the non-Hispanic white and Hispanic (of any race) populations are largely concentrated on the city's West Side, while the Black American population is largely concentrated on the East Side and the Asian community is mostly concentrated in the historical Asiatown neighborhood.[8] The East-West racial divide is a legacy of redlining and blockbusting on Cleveland's East Side,[9] and before the 1950s, no such division existed, as the poet Langston Hughes observed.[10] However, the division is not absolute; there is a significant African American minority on the West Side, and the East Side neighborhood of University Circle is majority non-Hispanic white, with significant African American and Asian minorities.[11] The city's Downtown is majority non-Hispanic white, with African American, Asian, and Hispanic minorities.[12]
The demographic distribution has largely remained stable since the 1970s, although there have been significant shifts in the composition of certain neighborhoods, notably Collinwood and Broadway–Slavic Village.[13] Cleveland's African American population increased from 235,405 (46.6%) in 1990 to 246,242 (51.0%) in 2000. However, due to increased African American migration to nearby East Side suburbs, this percentage fell to 48.8% in 2019. During the 2010s, the non-Hispanic white, Hispanic, and Asian populations increased in the city.[2]
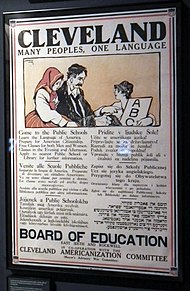
In the 19th and early 20th centuries, Cleveland saw a massive influx of immigrants from Ireland, Italy, and the Austro-Hungarian, German, Russian, and Ottoman empires, most of whom were attracted by manufacturing jobs.[14] In 1920, the city proper boasted a foreign-born population of 30% and, in 1870, that percentage was 42%.[15] As a result of the U.S. immigration restrictions of 1921 and 1924 and the decline of industry, Cleveland's foreign-born population decreased over time and was 4.1% by 1990.[15] In the late 2010s, the immigrant population of Cleveland and Cuyahoga County began to see significant growth.[16] By 2019, the foreign-born population of Cleveland had increased to 6%, while the foreign-born population of Cuyahoga County was 7.6%.[2][17] A 2019 study found Cleveland to be the city with the shortest average processing time in the nation for immigrants to become U.S. citizens.[18]
In Cleveland and Cuyahoga County, most of the foreign-born are from Europe, the Middle East, East Asia, Latin America, and South Asia, with smaller numbers from Africa. Within Cleveland, the neighborhoods with the highest foreign-born populations are Asiatown/Goodrich–Kirtland Park (32.7%), Clark–Fulton (26.7%), West Boulevard (18.5%), Brooklyn Centre (17.3%), Downtown (17.2%), University Circle (15.9%, with 20% in Little Italy), and Jefferson (14.3%).[19] Within Cuyahoga County, many Cleveland suburbs also boast high foreign-born populations, especially East Side suburbs such as Beachwood (17.11%), Mayfield Heights (16.36%), and Solon (15.56%) with their large communities of Russian-speaking immigrants from the post-Soviet states.[20][21][22] On the West Side, the streetcar suburb of Lakewood also has a significant foreign-born population and has been recognized locally as a hotspot for immigrants.[23]
European and Middle Eastern communities[]
The non-Hispanic white population is mostly concentrated on Cleveland's West Side, Downtown, and University Circle, and comprises 33.8% according to the 2019 census estimate.[2] This category, as defined by the U.S. Census Bureau, encompasses Cleveland's many ethnic European and Middle Eastern communities. Among them are Irish (especially in Kamm's Corners and other areas of West Park), Italians (especially in Little Italy and around Mayfield Road), Germans, and several Central-Eastern European ethnicities, including Czechs, Hungarians, Lithuanians, Poles, Romanians, Russians, Rusyns, Slovaks, Ukrainians, and ex-Yugoslav groups, such as Slovenes, Croats, and Serbs.[14] The presence of Hungarians within Cleveland proper was, at one time, so great that the city boasted the highest concentration of Hungarians in the world outside of Budapest.[24] Cleveland also has a long-established Jewish community,[25] as well as significant communities of Albanians,[26] Arabs (especially Lebanese, Syrians, and Palestinians),[27] Armenians,[28] French,[29] Greeks,[30] Iranians,[31] Scots,[14] and Turks.[32]
African American community[]
According to the 2019 census estimate, African Americans comprise about 48.8% of Cleveland's population.[2] The community expanded greatly during the 20th century as a result of the First and Second Great Migrations.[33] Most of the African American neighborhoods are on the East Side of Cleveland, but there is also a significant community on the West Side, particularly in the Bellaire–Puritas neighborhood.[34] Cleveland also has small African (especially Ethiopian and Congolese) and West Indian immigrant populations.[35]
Hispanic and Latino community[]
According to the 2019 census estimate, the Hispanic and Latino community forms 12% of the city's population and has been growing in recent decades.[2] The vast majority are of Puerto Rican descent, but the community also includes smaller numbers of immigrants from Mexico, Cuba, the Dominican Republic, South and Central America, and Spain.[36] The Clark–Fulton neighborhood on the West Side has the highest concentration of Hispanics in Cleveland.[37] The adjacent West Side neighborhoods of Brooklyn Centre, Stockyards, and Detroit–Shoreway also have significant Hispanic populations.[38][39][40]
Asian community[]
Centered on historical Asiatown, Cleveland's Asian community comprises 2.6% of the population and has also been growing, according to the 2019 census estimate.[2] The Asian community consists of Chinese, Koreans, Vietnamese, and other groups.[8]
See also[]
- Cleveland Cultural Gardens
- Greater Cleveland
References[]
- ^ Jump up to: a b c Gibson, Campbell (June 1998). "Population of the 100 Largest Cities and Other Urban Places in the United States: 1790 to 1990". U.S. Census Bureau. Retrieved October 20, 2012.
- ^ Jump up to: a b c d e f g h i j "U.S. Census Bureau Quick Facts: Cleveland". Retrieved May 21, 2020.
- ^ Exner, Rich (May 23, 2019). "Cleveland's population flattens near 385,000 after decades of big losses, new census estimates say". The Plain Dealer. Retrieved July 3, 2019.
- ^ Exner, Rich (May 13, 2016). "How downtown Cleveland is changing: by the numbers". The Plain Dealer. Retrieved July 3, 2019.
- ^ Jump up to: a b c d U.S. Census Bureau Quick Facts: Cleveland (2010) Archived 2014-02-18 at the Wayback Machine
- ^ "Commuter-Adjusted Daytime Population". U.S. Census Bureau. 2010. Retrieved July 8, 2019.
- ^ Mosby, Chris (January 23, 2020). "3 Ohio Cities Among Nation's Most Diverse: U.S. News". Patch. Retrieved May 24, 2020.
- ^ Jump up to: a b "Asiatown". The Encyclopedia of Cleveland History. Case Western Reserve University. Retrieved July 2, 2019.
- ^ Eddings, Amy (November 14, 2017). "Divided by Design: Tracking Neighborhood Racial Segregation in Cleveland". WVIZ. Retrieved July 3, 2019.
- ^ Rothstein, Richard (2017). The Color of Law: A Forgotten History of How Our Government Segregated America. New York: Liveright (W. W. Norton & Company). p. 22. ISBN 9781631492853. See also "Map of City of Cleveland Ethnic Settlements, Circa 1923". The Encyclopedia of Cleveland History. Case Western Reserve University. Retrieved June 12, 2020.
- ^ "Race and Ethnicity in University District, Cleveland, Ohio (Neighborhood)". Statistical Atlas. Retrieved July 2, 2019.
- ^ "Race and Ethnicity in Downtown, Cleveland, Ohio (Neighborhood)". Statistical Atlas. Retrieved July 2, 2019.
- ^ Jarboe, Michelle (May 10, 2017). "CSU report advises Cleveland to invest public money in East Side neighborhoods". The Plain Dealer. Retrieved July 3, 2019.
- ^ Jump up to: a b c "Immigration and Migration". The Encyclopedia of Cleveland History. Case Western Reserve University. Retrieved July 8, 2019.
- ^ Jump up to: a b Salling, Mark; Cyran, Ellen (January 1, 2006). "Foreign-Born Population in Selected Ohio Cities, 1870 to 2000: A Brief Descriptive Report". Cleveland State University. Retrieved July 2, 2019.
- ^ Exner, Rich (April 2, 2018). "Among counties, Cuyahoga near top in Midwest for attracting immigrants". The Plain Dealer. Retrieved July 8, 2019.
- ^ "U.S. Census Bureau Quick Facts: Cuyahoga County". Retrieved May 24, 2020.
- ^ Cho, Janet H. (February 7, 2019). "Cleveland is the No. 1 city for immigrants to become U.S. citizens, study says". The Plain Dealer. Retrieved July 2, 2019.
- ^ "National Origin in Cleveland, Ohio". Statistical Atlas. Retrieved May 24, 2020.
- ^ "National Origin in Cuyahoga County, Ohio". Statistical Atlas. Retrieved May 24, 2020.
- ^ "Russians". The Encyclopedia of Cleveland History. Case Western Reserve University. Retrieved July 2, 2019.
- ^ "Soviet and Post-Soviet Immigration". The Encyclopedia of Cleveland History. Case Western Reserve University. Retrieved July 2, 2019.
- ^ Meiser, Rebecca (November 29, 2006). "Destination Lakewood: How a bar town became an immigration hot spot". Cleveland Scene. Retrieved August 1, 2019.
- ^ "Hungarians". The Encyclopedia of Cleveland History. Case Western Reserve University. May 11, 2018. Retrieved July 8, 2019.
- ^ "Jews & Judaism". The Encyclopedia of Cleveland History. Case Western Reserve University. Retrieved July 2, 2019.
- ^ "Albanians". The Encyclopedia of Cleveland History. Case Western Reserve University. May 11, 2018. Retrieved May 14, 2020.
- ^ "Arab Americans". The Encyclopedia of Cleveland History. Case Western Reserve University. May 11, 2018. Retrieved May 14, 2020.
- ^ "Armenians". The Encyclopedia of Cleveland History. Case Western Reserve University. Retrieved August 9, 2019.
- ^ "French". The Encyclopedia of Cleveland History. Case Western Reserve University. May 11, 2018. Retrieved August 9, 2019.
- ^ "Greeks". The Encyclopedia of Cleveland History. Case Western Reserve University. May 11, 2018. Retrieved August 9, 2019.
- ^ Vandenberge, Jordan (January 3, 2020). "Iranian-Americans in Cleveland keeping close eye on rising tensions between US, Iran". WEWS-TV. Retrieved June 21, 2020.
- ^ "Turks in Cleveland". The Encyclopedia of Cleveland History. Case Western Reserve University. Retrieved August 9, 2019.
- ^ "African Americans". The Encyclopedia of Cleveland History. Case Western Reserve University. Retrieved July 8, 2019.
- ^ "Race and Ethnicity in Puritas-Longmead, Cleveland, Ohio (Neighborhood)". Statistical Atlas. Retrieved July 2, 2019.
- ^ Drown, Hannah (August 26, 2019). "New Ethiopian Cultural Garden first in Cleveland to represent an African nation". The Plain Dealer. Retrieved June 12, 2020.
- ^ "Hispanic Community". The Encyclopedia of Cleveland History. Case Western Reserve University. Retrieved July 2, 2019.
- ^ "Race and Ethnicity in Clark–Fulton, Cleveland, Ohio (Neighborhood)". Statistical Atlas. Retrieved July 2, 2019.
- ^ "Race and Ethnicity in Brooklyn-Centre, Cleveland, Ohio (Neighborhood)". Statistical Atlas. Retrieved July 2, 2019.
- ^ "Race and Ethnicity in Stockyards, Cleveland, Ohio (Neighborhood)". Statistical Atlas. Retrieved July 2, 2019.
- ^ "Race and Ethnicity in Detroit–Shoreway, Cleveland, Ohio (Neighborhood)". Statistical Atlas. Retrieved July 2, 2019.
Further reading[]
- The Peoples of Cleveland. Cleveland: Western Reserve Historical Society. 2001. ISBN 9780911704532.
External links[]
- Data Central at Cleveland.com
- Ethnic map of Cleveland, ca. 1923, The Encyclopedia of Cleveland History (Case Western Reserve University)
| show |
|---|

- Culture of Cleveland
- Geography of Cleveland
- Economy of Cleveland
- Demographics by city in the United States