Demographics of Alabama
| Year | Pop. | ±% |
|---|---|---|
| 1800 | 1,250 | — |
| 1810 | 9,046 | +623.7% |
| 1820 | 144,317 | +1495.4% |
| 1830 | 309,527 | +114.5% |
| 1840 | 590,756 | +90.9% |
| 1850 | 771,623 | +30.6% |
| 1860 | 964,201 | +25.0% |
| 1870 | 996,992 | +3.4% |
| 1880 | 1,262,505 | +26.6% |
| 1890 | 1,513,401 | +19.9% |
| 1900 | 1,828,697 | +20.8% |
| 1910 | 2,138,093 | +16.9% |
| 1920 | 2,348,174 | +9.8% |
| 1930 | 2,646,248 | +12.7% |
| 1940 | 2,832,961 | +7.1% |
| 1950 | 3,061,743 | +8.1% |
| 1960 | 3,266,740 | +6.7% |
| 1970 | 3,444,165 | +5.4% |
| 1980 | 3,893,888 | +13.1% |
| 1990 | 4,040,587 | +3.8% |
| 2000 | 4,447,100 | +10.1% |
| 2010 | 4,779,736 | +7.5% |
| 2020 | 5,024,279 | +5.1% |
| Sources: 1820[1], 1910–2020[2] | ||
Population[]
This section needs to be updated. (December 2017) |
The 2010 census estimated Alabama's population at 4,802,740, an increase of 332,636 or 7.5% since 2000. This includes a natural increase of 87,818 (375,808 births minus 287,990 deaths) and a net migration of 73,178 people into the state. Immigration from outside the United States resulted in a net increase of 30,537 and migration within the country produced a net increase of 42,641.
In 2006 Alabama had a larger percentage of tobacco smokers than the national average, with 23% of adults smoking.[3]
The racial makeup of the state and comparison to the prior census:
| By race | White | Black | AIAN* | Asian | NHPI* |
|---|---|---|---|---|---|
| 2000 (total population) | 72.56% | 26.33% | 1.00% | 0.89% | 0.07% |
| 2000 (Hispanic only) | 1.48% | 0.18% | 0.04% | 0.02% | 0.01% |
| 2005 (total population) | 72.14% | 26.70% | 0.98% | 1.02% | 0.07% |
| 2005 (Hispanic only) | 2.08% | 0.17% | 0.05% | 0.03% | 0.01% |
| Growth 2000–05 (total population) | 1.90% | 3.95% | -0.06% | 17.43% | 4.90% |
| Growth 2000–05 (non-Hispanic only) | 1.02% | 3.97% | -0.55% | 17.47% | 6.67% |
| Growth 2000–05 (Hispanic only) | 43.85% | 1.05% | 11.46% | 16.20% | -2.17% |
| * AIAN is American Indian or Alaskan Native; NHPI is Native Hawaiian or Pacific Islander | |||||
Birth data[]
Note: Births in table don't add up, because Hispanics are counted both by their ethnicity and by their race, giving a higher overall number.
| Race | 2013[4] | 2014[5] | 2015[6] | 2016[7] | 2017[8] | 2018[9] | 2019[10] |
|---|---|---|---|---|---|---|---|
| White: | 38,971 (67.0%) | 39,578 (66.6%) | 39,845 (66.8%) | ... | ... | ... | ... |
| > Non-Hispanic White | 35,086 (60.3%) | 35,929 (60.5%) | 35,826 (60.1%) | 34,899 (59.0%) | 34,377 (58.3%) | 33,776 (58.5%) | 33,394 (57.0%) |
| Black | 18,014 (31.0%) | 18,417 (31.0%) | 18,429 (30.9%) | 17,695 (29.9%) | 17,963 (30.5%) | 17,597 (30.5%) | 18,197 (31.0%) |
| Asian | 973 (1.7%) | 1,227 (2.1%) | 1,193 (2.0%) | 986 (1.7%) | 950 (1.6%) | 903 (1.6%) | 886 (1.5%) |
| American Indian | 209 (0.3%) | 200 (0.3%) | 190 (0.3%) | 150 (0.25%) | 175 (0.3%) | 148 (0.25%) | 188 (0.3%) |
| Hispanic (of any race) | 4,002 (6.9%) | 4,019 (6.8%) | 4,295 (7.2%) | 4,580 (7.7%) | 4,546 (7.7%) | 4,403 (7.6%) | 4,910 (8.4%) |
| Total Alabama | 58,167 (100%) | 59,422 (100%) | 59,657 (100%) | 59,151 (100%) | 58,941 (100%) | 57,761 (100%) | 58,615 (100%) |
- Since 2016, data for births of White Hispanic origin are not collected, but included in one Hispanic group; persons of Hispanic origin may be of any race.
Ancestry[]

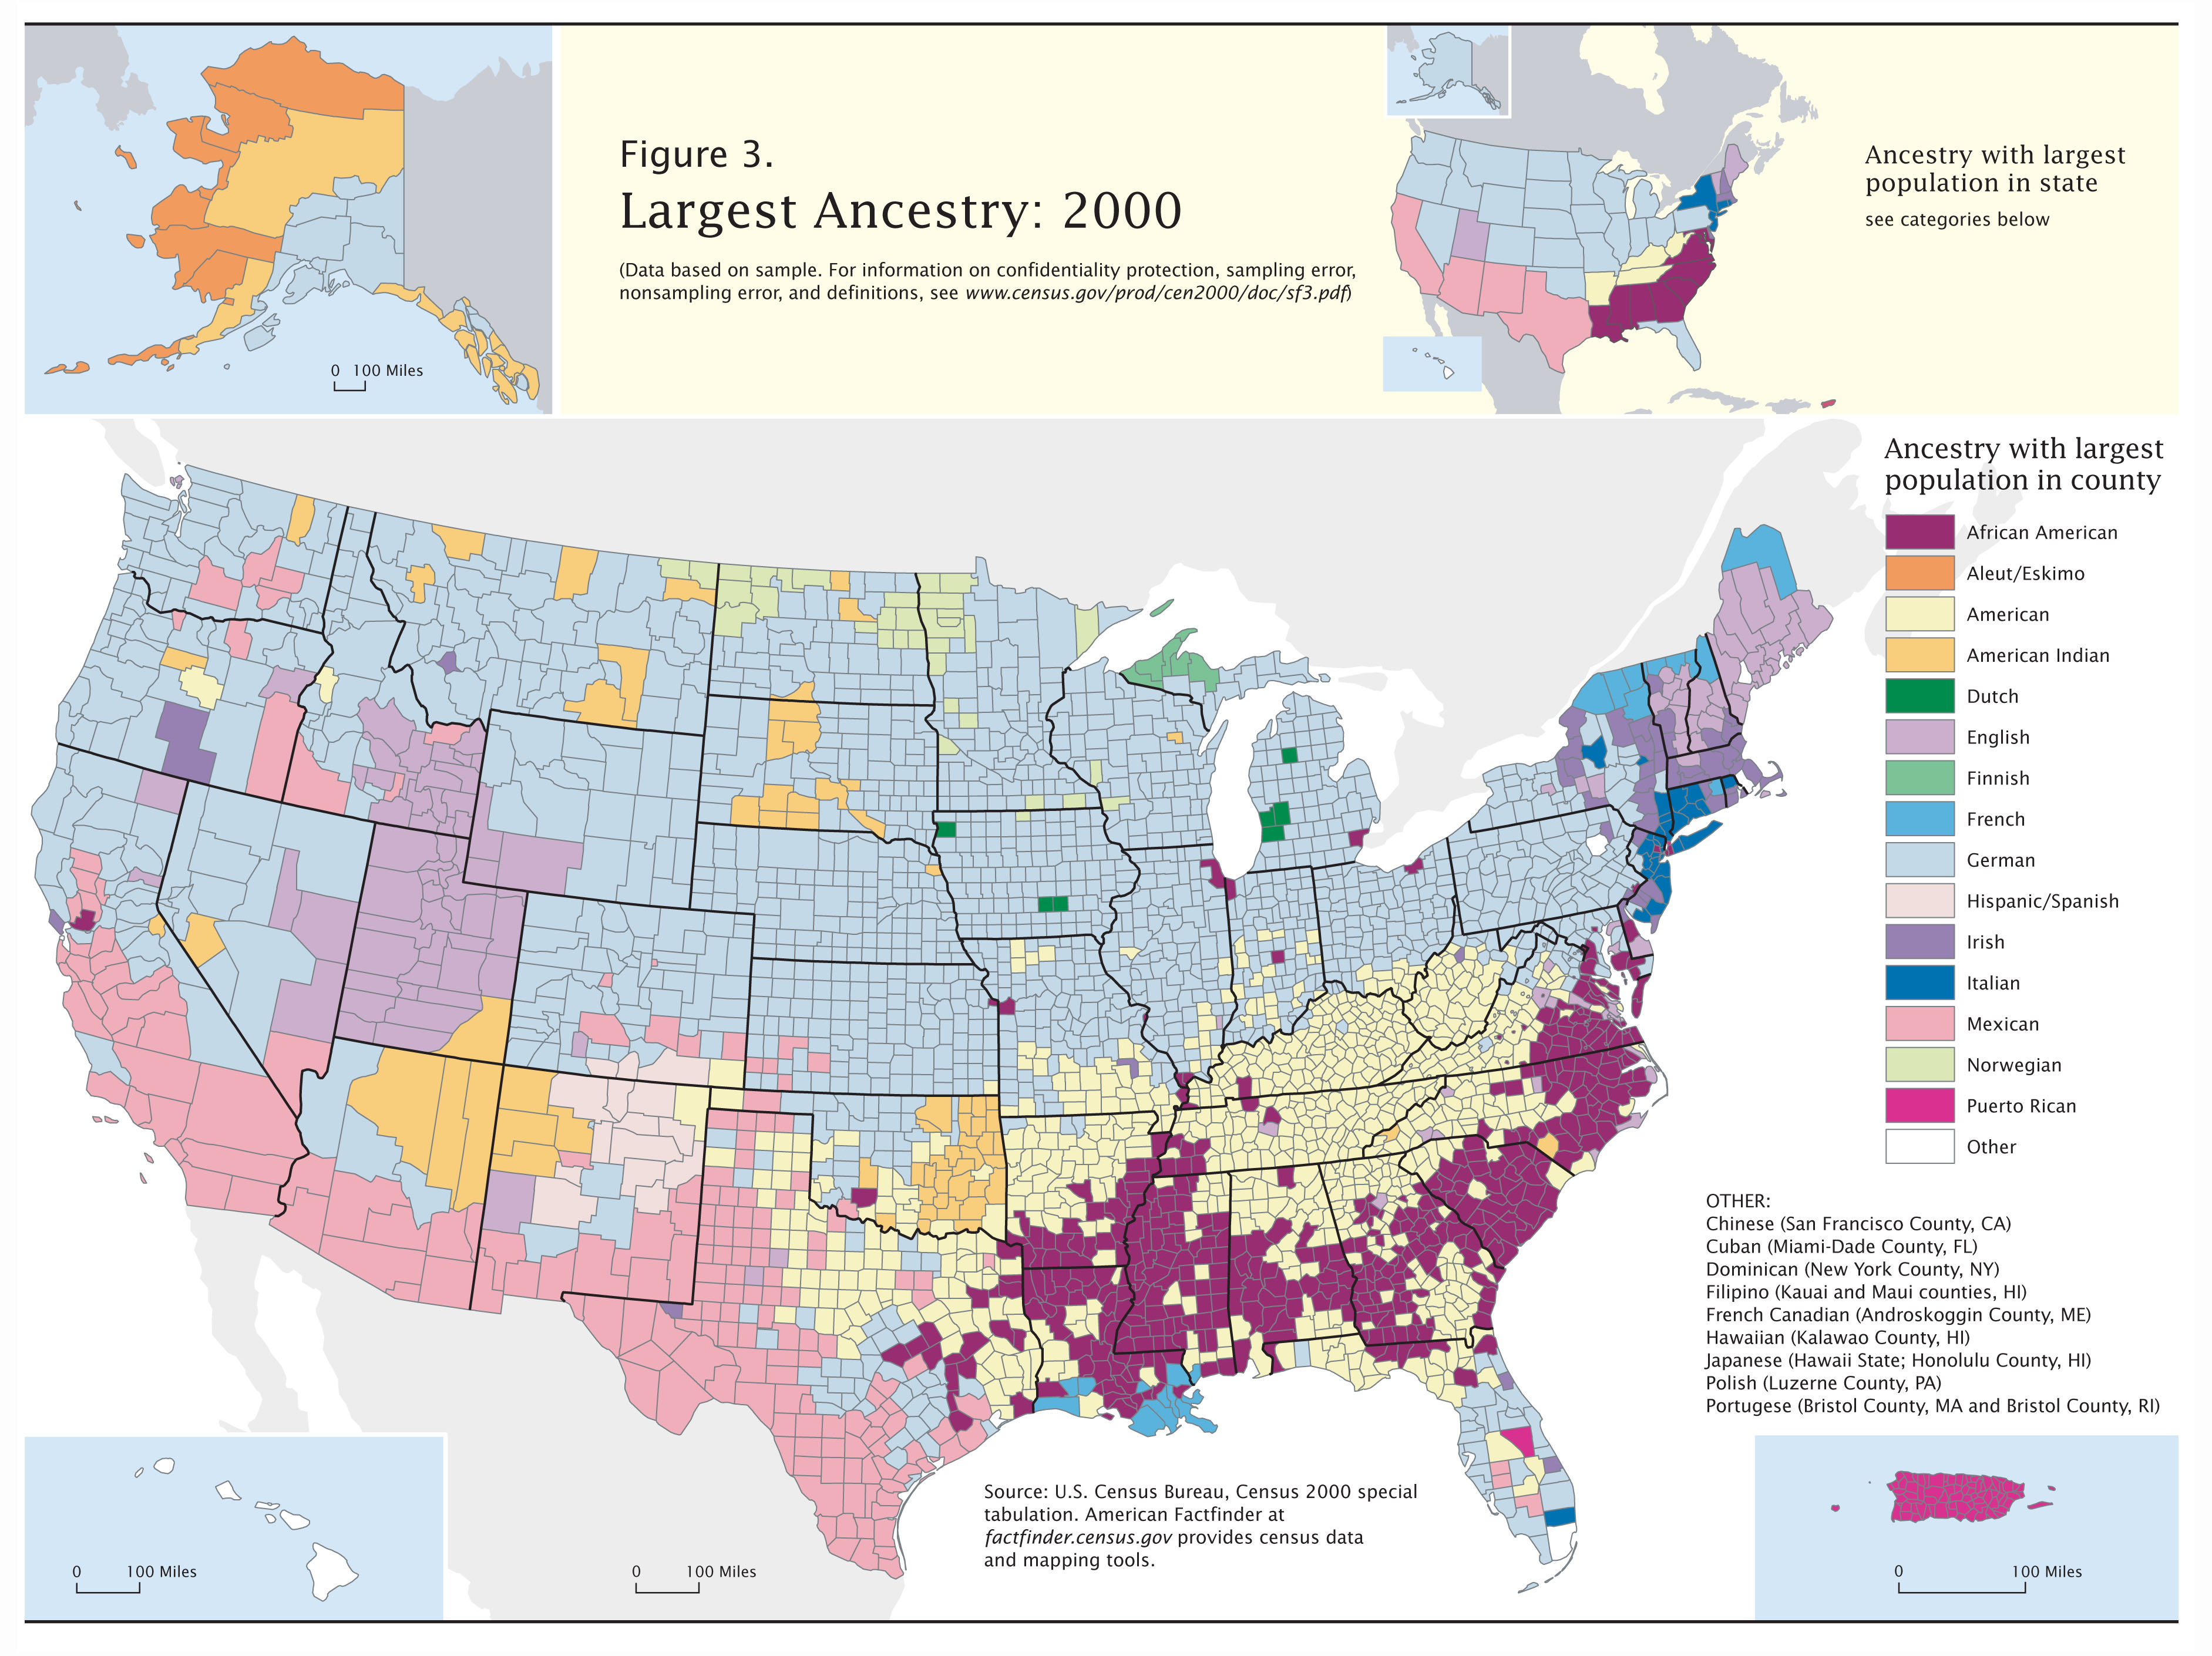
Historically, African Americans were brought to Alabama as slaves, in greatest numbers in the cotton-producing plantation region known as the Black Belt. This region remains predominantly African American, where many freedmen settled to work at agriculture after the Civil War. The northern part of the state, originally settled by small farmers with fewer slaves, is predominantly European American. The Port of Mobile, founded by the French and subsequently controlled by England, Spain, and the United States, has long had an ethnically diverse population. It has long served as an entry point for various groups settling in other parts of the state. Those citing "American" ancestry in Alabama are of overwhelmingly English extraction, however most English Americans identify simply as having American ancestry because their roots have been in North America for so long, in many cases since the early sixteen hundreds. Demographers estimate that a minimum of 20–23% of people in Alabama are of predominantly English ancestry and state that the figure is probably much higher. In the 1980 census 1,139,976 people in Alabama cited that they were of English ancestry out of a total state population of 2,824,719 making them 41% of the state at the time and the largest ethnic group.[13][14][15][16][17] There are also many more people in Alabama of Scots-Irish origins than are self-reported.[18] Many people in Alabama claim Irish ancestry because of the term "Scots-Irish", but most of the time in Alabama this term is used for those with Scottish roots, rather than Irish.[19]
Rankings[]
- Among the 50 states and the District of Columbia, Alabama ranks:
- 32nd in its percentage of European Americans
- 7th in its percentage of Blacks
- 43rd in its percentage of Hispanics
- 44th in its percentage of Asians
- 26th in its percentage of Native Americans
- 48th in its percentage of people of Mixed race
- 47th in its percentage of males
- 5th in its percentage of females
Religion[]
The religious affiliations of adult people in Alabama are as follows:[20]
- Christian – 86%
- Evangelical Protestant – 49%
- Baptist – 31%
- Pentecostal – 5%
- Presbyterian – 2%
- Restorationist – 3%
- Holiness movement – 1%
- Mainline Protestant – 13%
- Baptist – 2%
- Methodist – 5%
- Lutheran – 1%
- Presbyterian – 1%
- Episcopalian/ – 1%
- Congregationalist – 1%
- Historically Black Protestant – 16%
- Baptist – 11%
- Methodist – 3%
- Pentecostal – 1%
- – 1%
- Catholic – 7%
- LDS – 1%
- Christian – non-denominational – 6%
- Evangelical Protestant – 49%
- Non-Christian Faiths – 1%
- Other faiths – 1%
- Unaffiliated (religious "nones") – 12%
- Atheist – 1%
- Agnostic – 1%
- Nothing in Particular – 9%
- Don't Know – 1%
Language[]
As of 2000, 96.7% of Alabama residents age 5 and older speak English at home and 2.2% speak Spanish. German speakers make up only 0.4% of the population, French/French Creole at 0.3%, and Chinese at 0.1%.
Age and sex[]
As of 2000, 25.3% of residents of the state were under 18, 6.7% were under 5, and 13.0% were over 65.
51.7% of Alabamians are female and 48.3% are male; there is a surplus of 600,000 women in the age range of 25–44.
See also[]
- Demographics of the United States
- Alabama locations by per capita income
References[]
- ^ Forstall, Richard L. (1996). Population of States and Counties of the United States: 1790 to 1990. Washington: U.S. Bureau of the Census, pp. 8–11. ISBN 0-934213-48-8. Retrieved 19 May 2021. Due to the late arrival of returns from the counties of Lawrence, Perry, and Washington, the population of the state for 1820 was incorrectly listed as 127,901 in the official state total.[subnote 1]
- ^ "Historical Population Change Data (1910–2020)". Census.gov. United States Census Bureau. Archived April 29, 2021, at the Wayback Machine
- ^ CDC's STATE System - State Comparison Report Cigarette Use (Adults) – BRFSS[permanent dead link] for 2006, lists the state as having 23.3% smokers. The national average is 20.8% according to Cigarette Smoking Among Adults --- United States, 2006 article in the CDC's Morbidity and Mortality Weekly Report.
- ^ "Data" (PDF). www.cdc.gov. Retrieved 2019-07-09.
- ^ "Data" (PDF). www.cdc.gov. Retrieved 2019-07-09.
- ^ "Data" (PDF). www.cdc.gov. Retrieved 2019-07-09.
- ^ "Data" (PDF). www.cdc.gov. Retrieved 2019-07-09.
- ^ "Data" (PDF). www.cdc.gov. Retrieved 2019-07-09.
- ^ "Data" (PDF). www.cdc.gov. Retrieved 2019-12-02.
- ^ "Data" (PDF). www.cdc.gov. Retrieved 2019-12-02.
- ^ Data on selected ancestry groups.
- ^ 1980 United States Census
- ^ Ancestry of the Population by State: 1980 - Table 3
- ^ Sharing the Dream: White Males in a Multicultural America by Dominic J. Pulera.
- ^ Reynolds Farley, 'The New Census Question about Ancestry: What Did It Tell Us?', Demography, Vol. 28, No. 3 (August 1991), pp. 414, 421.
- ^ Stanley Lieberson and Lawrence Santi, 'The Use of Nativity Data to Estimate Ethnic Characteristics and Patterns', Social Science Research, Vol. 14, No. 1 (1985), pp. 44–46.
- ^ Stanley Lieberson and Mary C. Waters, 'Ethnic Groups in Flux: The Changing Ethnic Responses of American Whites', Annals of the American Academy of Political and Social Science, Vol. 487, No. 79 (September 1986), pp. 82–86.
- ^ "Alabama - Selected Social Characteristics in the United States: 2006-2008". Archived from the original on 2020-02-11. Retrieved 2010-08-18.
- ^ Census 2000 Map – top U.S. ancestries by county
- ^ "Religious Landscape Study". Religion and Public Life. Pew Research Center. Retrieved 28 March 2018.
Notes on references
External links[]
- 2000 Census of Population and Housing for Alabama, U.S. Census Bureau
- Demographics of Alabama
- Economy of Alabama
- Demographics of the United States by state