Demography of Leicester

Leicester, England is an ethnically and culturally diverse city. It is the thirteenth most populous city in the United Kingdom.
Population[]
Leicester's total population, according to the 2011 UK census, was 329,839. The population density was 4,494 people per square km.
Ethnicity[]
The following table shows the ethnic group of respondents in the 2001 and 2011 censuses in Leicester.
| Ethnic Group | 2001[1] | 2011[2] | ||
|---|---|---|---|---|
| Number | % | Number | % | |
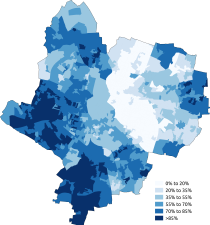
| White: British | 169,456 | 60.54% | 148,629 | 45.06% |
| White: Irish | 3,602 | 1.29% | 2,524 | 0.77% |
| White: Gypsy or Irish Traveller[note 1] | 417 | 0.13% | ||
| White: Other | 5,681 | 2.03% | 15,066 | 4.57% |
| White: Total | 178,739 | 63.85% | 166,636 | 50.52% |
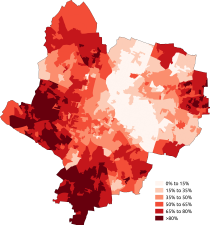
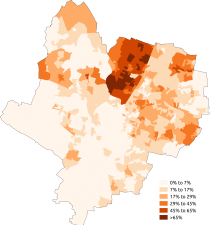
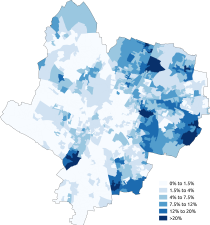
| Asian or Asian British: Indian | 72,033 | 25.73% | 93,335 | 28.30% |
| Asian or Asian British: Pakistani | 4,276 | 1.53% | 8,067 | 2.45% |
| Asian or Asian British: Bangladeshi | 1,926 | 0.69% | 3,642 | 1.10% |
| Asian or Asian British: Chinese[note 2] | 1,426 | 0.51% | 4,245 | 1.29% |
| Asian or Asian British: Other Asian | 5,516 | 1.97% | 13,181 | 4.00% |
| Asian or Asian British: Total | 85,177 | 30.43% | 122,470 | 37.13% |
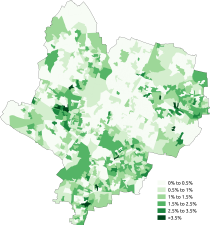
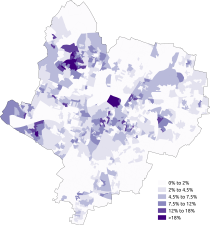
| Black or Black British: Caribbean | 4,610 | 1.65% | 4,790 | 1.45% |
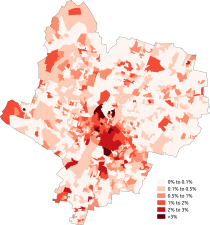
| Black or Black British: African | 3,432 | 1.23% | 12,480 | 3.78% |
| Black or Black British: Other Black | 553 | 0.20% | 3,315 | 1.01% |
| Black or Black British: Total | 8,595 | 3.07% | 20,585 | 6.24% |
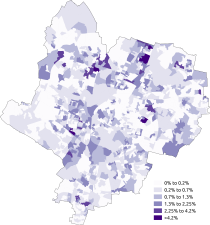
| Mixed: White and Black Caribbean | 2,841 | 1.01% | 4,691 | 1.42% |
| Mixed: White and Black African | 539 | 0.19% | 1,161 | 0.35% |
| Mixed: White and Asian | 1,908 | 0.68% | 3,388 | 1.03% |
| Mixed: Other Mixed | 1,218 | 0.44% | 2,340 | 0.71% |
| Mixed: Total | 6,506 | 2.32% | 11,580 | 3.51% |
| Other: Arab[note 3] | 3,311 | 1.00% | ||
| Other: Any other ethnic group | 904 | 0.32% | 5,257 | 1.59% |
| Other: Total | 904 | 0.32% | 8,568 | 2.60% |
| Total | 279,921 | 100.00% | 329,839 | 100.00% |
Notes for table above
White
White-British
White-Irish

White-Other

Asian
Asian-Indian

Asian-Pakistani

Asian-Bangladeshi

Asian-Chinese

Black
Black-African

Black-Caribbean
Other-Arab


Languages[]
The most common main languages spoken in Leicester according to the 2011 census are shown below.[3]
| Rank | Language | Usual residents aged 3+ | Proportion |
|---|---|---|---|
| 1 | English | 228,295 | 72.47% |
| 2 | Gujarati | 36,347 | 11.54% |
| 3 | Punjabi | 7,560 | 2.40% |
| 4 | Polish | 6,192 | 1.97% |
| 5 | Urdu | 3,376 | 1.07% |
| 6 | Somali | 3,331 | 1.06% |
| 7 | Arabic | 2,516 | 0.80% |
| 8 | Bengali (with Sylheti and Chatgaya) | 1,808 | 0.57% |
| 9 | Portuguese | 1,750 | 0.56% |
| 10 | Kurdish | 1,520 | 0.48% |
| 11 | Tamil | 1,498 | 0.48% |
| 12 | Hindi | 1,095 | 0.35% |
| 13 | Persian | 1,021 | 0.32% |
| 14 | Slovak | 878 | 0.28% |
| 15 | French | 849 | 0.27% |
| 16 | Shona | 801 | 0.25% |
| 17 | Turkish | 584 | 0.19% |
| 18 | Greek | 546 | 0.17% |
| 19 | Swahili/Kiswahili | 533 | 0.17% |
| 20 | Tagalog/Filipino | 496 | 0.16% |
| Other | 14,015 | 4.45% |
Religion[]
The following table shows the religion of respondents in the 2001 and 2011 censuses in Leicester.
| Religion | 2001[4] | 2011[5] | ||
|---|---|---|---|---|
| Number | % | Number | % | |
| Christian | 125,187 | 44.72% | 106,872 | 32.40% |
| Buddhist | 638 | 0.23% | 1,224 | 0.37% |
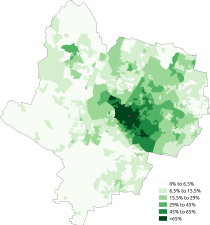
| Hindu | 41,248 | 14.74% | 50,087 | 15.19% |
| Jewish | 417 | 0.15% | 295 | 0.09% |
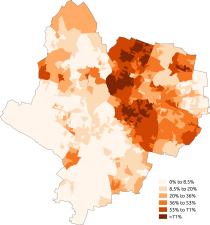
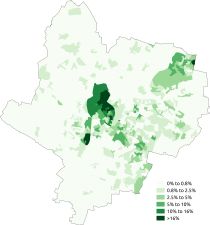
| Muslim | 30,885 | 11.03% | 61,440 | 18.63% |
| Sikh | 11,796 | 4.21% | 14,457 | 4.38% |
| Other religion | 1,179 | 0.42% | 1,839 | 0.56% |
| No religion | 48,789 | 17.43% | 75,280 | 22.82% |
| Religion not stated | 19,782 | 7.07% | 18,345 | 5.56% |
| Total | 279,921 | 100.00% | 329,839 | 100.00% |

Christianity
Islam

Judaism
Hinduism
Sikhism
Buddhism
Other religion

No religion


See also[]
- Demography of the United Kingdom
- Demography of England
- Demography of London
- Demography of Birmingham
- Demography of Greater Manchester
- List of English cities by population
- List of English districts by population
- List of English districts and their ethnic composition
- List of English districts by area
- List of English districts by population density
References[]
- ^ "2001 census - theme tables". NOMIS. Retrieved 17 June 2015.
- ^ "Download:local authorities: county / unitary". NOMIS. Retrieved 17 June 2015.
- ^ "Download:local authorities: county / unitary". NOMIS. Retrieved 17 June 2015.
- ^ "2001 census - theme tables". Retrieved 17 June 2015.
- ^ "Download:local authorities: county / unitary". NOMIS. Retrieved 17 June 2015.
England Portal | |
| Unitary authorities | |
| Boroughs or districts | |
| Major settlements | |
| Topics | |
- Demographics of England
- Demographics by city