Demography of England

The demography of England has since 1801 been measured by the decennial national census, and is marked by centuries of population growth and urbanization. Due to the lack of authoritative contemporary sources, estimates of the population of England for dates prior to the first census in 1801 vary considerably.
Population[]
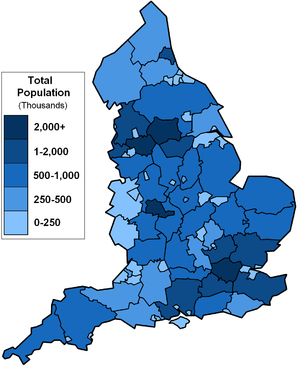
The population of England in 2019 was estimated to be 56,286,961.[1] The population at the time of the 2011 census was 53,012,456
Historical population[]
This section needs expansion. You can help by . (June 2014) |
| Year | Pop. | ±% |
|---|---|---|
| 5000BC | below 6000 | — |
| 3000BC | 100,000 | — |
| 1800BC | 300,000 | +200.0% |
| 100BC | 1,500,000 | +400.0% |
| Source: [4] | ||
| Year | Pop. | ±% |
|---|---|---|
| 1086 | 1,710,000 | — |
| 1190 | 3,100,000 | +81.3% |
| 1220 | 3,970,000 | +28.1% |
| 1250 | 4,230,000 | +6.5% |
| 1279 | 4,430,000 | +4.7% |
| 1290 | 4,750,000 | +7.2% |
| 1315 | 4,690,000 | −1.3% |
| 1325 | 4,120,000 | −12.2% |
| 1348 | 4,810,000 | +16.7% |
| 1351 | 2,600,000 | −45.9% |
| 1377 | 2,500,000 | −3.8% |
| 1400 | 2,080,000 | −16.8% |
| 1430 | 2,020,000 | −2.9% |
| 1450 | 1,900,000 | −5.9% |
| 1490 | 2,140,000 | +12.6% |
| 1522 | 2,350,000 | +9.8% |
| 1541 | 2,830,000 | +20.4% |
| 1560 | 3,200,000 | +13.1% |
| 1600 | 4,110,000 | +28.4% |
| 1650 | 5,310,000 | +29.2% |
| 1700 | 5,200,000 | −2.1% |
| Source: [5] [6] | ||
| Year | Pop. | ±% |
|---|---|---|
| 1801 | 8,287,907 | — |
| 1811 | 9,405,342 | +13.5% |
| 1821 | 11,178,050 | +18.8% |
| 1831 | 12,976,329 | +16.1% |
| 1841 | 14,847,888 | +14.4% |
| 1851 | 16,738,495 | +12.7% |
| 1861 | 18,753,390 | +12.0% |
| 1871 | 21,361,235 | +13.9% |
| 1881 | 24,397,385 | +14.2% |
| 1891 | 27,231,229 | +11.6% |
| 1901 | 30,072,180 | +10.4% |
| 1911 | 33,561,235 | +11.6% |
| 1921 | 35,230,225 | +5.0% |
| 1931 | 37,359,045 | +6.0% |
| 1939 | 38,084,321 | +1.9% |
| 1951 | 41,164,356 | +8.1% |
| 1961 | 43,460,525 | +5.6% |
| 2001 | 49,138,831 | +13.1% |
| 2011 | 53,012,456 | +7.9% |
| 2019 | 56,286,961 | +6.2% |
| Source: Year(s) 1801–2011[6][7][8][9] | ||
Vital statistics[]
[10] This is UK wide information.
| Average population | Live births | Deaths | Natural change | Crude birth rate (per 1000) | Crude death rate (per 1000) | Natural change (per 1000) | Fertility rates | |
|---|---|---|---|---|---|---|---|---|
| 1940 | 567,710 | 545,952 | 21,758 | 14.1 | 13.6 | 0.5 | ||
| 1941 | 539,205 | 499,343 | 39,862 | 13.9 | 12.9 | 1.0 | ||
| 1942 | 608,373 | 448,777 | 159,596 | 15.6 | 11.5 | 4.1 | ||
| 1943 | 641,064 | 469,916 | 171,148 | 16.2 | 11.9 | 4.3 | ||
| 1944 | 704,748 | 461,189 | 243,559 | 17.7 | 11.6 | 6.1 | ||
| 1945 | 638,422 | 456,216 | 182,206 | 15.9 | 11.4 | 4.5 | ||
| 1946 | 773,153 | 460,543 | 312,610 | 19.2 | 11.4 | 7.8 | ||
| 1947 | 829,863 | 484,324 | 345,539 | 20.5 | 12.0 | 8.5 | ||
| 1948 | 728,131 | 439,803 | 288,328 | 17.9 | 10.8 | 7.1 | ||
| 1949 | 686,181 | 478,627 | 207,554 | 16.8 | 11.7 | 5.1 | ||
| 1950 | 654,321 | 477,006 | 177,315 | 15.5 | 11.3 | 4.2 | ||
| 1951 | 636,259 | 513,375 | 122,884 | 15.5 | 12.5 | 3.0 | ||
| 1952 | 632,347 | 466,479 | 165,858 | 15.3 | 11.3 | 4.0 | ||
| 1953 | 642,844 | 472,137 | 170,707 | 15.5 | 11.3 | 4.2 | ||
| 1954 | 633,395 | 469,074 | 164,321 | 15.2 | 11.3 | 3.9 | ||
| 1955 | 628,935 | 484,926 | 144,009 | 15.0 | 11.7 | 3.3 | ||
| 1956 | 659,420 | 488,893 | 170,527 | 15.7 | 11.7 | 4.0 | ||
| 1957 | 681,736 | 482,174 | 199,562 | 16.1 | 11.5 | 4.6 | ||
| 1958 | 698,255 | 494,201 | 204,054 | 16.4 | 11.7 | 4.7 | ||
| 1959 | 706,239 | 495,517 | 210,722 | 16.5 | 11.6 | 4.9 | ||
| 1960 | 740,858 | 493,553 | 247,305 | 17.1 | 11.5 | 5.6 | ||
| 1961 | 766,358 | 518,047 | 248,311 | 17.6 | 11.9 | 5.7 | ||
| 1962 | 793,354 | 523,855 | 269,499 | 18.0 | 12.0 | 6.0 | ||
| 1963 | 807,017 | 538,105 | 268,912 | 18.2 | 12.2 | 6.0 | ||
| 1964 | 828,470 | 501,991 | 326,479 | 18.5 | 11.3 | 7.2 | ||
| 1965 | 816,433 | 516,317 | 300,116 | 18.1 | 11.5 | 6.6 | ||
| 1966 | 804,957 | 528,981 | 275,976 | 17.7 | 11.8 | 5.9 | ||
| 1967 | 788,458 | 509,356 | 279,102 | 17.2 | 11.2 | 6.0 | ||
| 1968 | 775,065 | 541,862 | 233,203 | 16.9 | 11.9 | 5.0 | ||
| 1969 | 754,456 | 543,425 | 211,031 | 16.4 | 11.9 | 4.5 | ||
| 1970 | 741,999 | 540,196 | 201,803 | 16.0 | 11.6 | 4.4 | ||
| 1971 | 46,411,000 | 740,099 | 532,445 | 207,654 | 15.9 | 11.5 | 4.4 | |
| 1972 | 46,572,000 | 685,485 | 554,251 | 131,234 | 14.7 | 11.9 | 2.8 | |
| 1973 | 46,686,000 | 638,356 | 549,876 | 88,480 | 13.7 | 11.8 | 1.9 | |
| 1974 | 46,682,000 | 603,153 | 547,980 | 55,173 | 12.9 | 11.7 | 1.2 | |
| 1975 | 46,674,000 | 568,900 | 545,444 | 23,456 | 12.2 | 11.7 | 0.5 | |
| 1976 | 46,659,000 | 550,383 | 560,317 | -9,934 | 11.8 | 12.0 | -0.2 | |
| 1977 | 46,639,000 | 536,953 | 538,652 | -1,699 | 11.5 | 11.5 | -0.0 | |
| 1978 | 46,638,000 | 562,589 | 547,685 | 14,904 | 12.1 | 11.7 | 0.4 | |
| 1979 | 46,698,000 | 601,316 | 554,840 | 46,476 | 12.9 | 11.9 | 1.0 | |
| 1980 | 46,787,000 | 618,371 | 544,349 | 74,022 | 13.2 | 11.6 | 1.6 | |
| 1981 | 46,820,000 | 598,163 | 541,018 | 57,145 | 12.8 | 11.6 | 1.2 | |
| 1982 | 46,777,000 | 589,711 | 544,984 | 44,727 | 12.6 | 11.7 | 0.9 | 1.76 |
| 1983 | 46,813,000 | 593,255 | 542,509 | 50,746 | 12.7 | 11.6 | 1.1 | 1.75 |
| 1984 | 46,912,000 | 600,573 | 531,314 | 69,259 | 12.8 | 11.3 | 1.5 | 1.75 |
| 1985 | 47,057,000 | 619,301 | 553,153 | 66,148 | 13.2 | 11.8 | 1.4 | 1.78 |
| 1986 | 47,187,000 | 623,609 | 544,545 | 79,064 | 13.2 | 11.5 | 1.7 | 1.76 |
| 1987 | 47,300,000 | 643,330 | 531,150 | 112,180 | 13.6 | 11.2 | 2.4 | 1.80 |
| 1988 | 47,412,000 | 654,353 | 535,553 | 118,800 | 13.8 | 11.3 | 2.5 | 1.82 |
| 1989 | 47,552,000 | 649,357 | 539,804 | 109,553 | 13.7 | 11.4 | 2.3 | 1.79 |
| 1990 | 47,699,000 | 666,920 | 528,920 | 138,000 | 14.0 | 11.1 | 3.9 | 1.83 |
| 1991 | 47,875,000 | 660,806 | 533,980 | 126,826 | 13.8 | 11.2 | 2.6 | 1.81 |
| 1992 | 47,998,000 | 651,784 | 522,660 | 129,124 | 13.6 | 10.9 | 2.7 | 1.79 |
| 1993 | 48,102,000 | 636,473 | 540,904 | 95,569 | 13.2 | 11.2 | 2.0 | 1.76 |
| 1994 | 48,228,000 | 628,956 | 516,297 | 112,659 | 13.0 | 10.7 | 2.3 | 1.75 |
| 1995 | 48,383,000 | 613,257 | 529,038 | 84,219 | 12.7 | 10.9 | 1.8 | 1.71 |
| 1996 | 48,519,000 | 614,184 | 526,650 | 87,534 | 12.7 | 10.9 | 1.8 | 1.73 |
| 1997 | 48,664,000 | 608,202 | 521,598 | 86,604 | 12.5 | 10.7 | 1.8 | 1.73 |
| 1998 | 48,820,000 | 602,111 | 518,089 | 84,022 | 12.3 | 10.6 | 1.7 | 1.72 |
| 1999 | 49,032,000 | 589,468 | 517,119 | 72,349 | 12.0 | 10.5 | 1.5 | 1.69 |
| 2000 | 49,233,000 | 572,826 | 503,026 | 69,800 | 11.6 | 10.2 | 1.4 | 1.65 |
| 2001 | 49,449,000 | 563,744 | 497,878 | 65,866 | 11.4 | 10.1 | 1.3 | 1.63 |
| 2002 | 49,679,000 | 565,709 | 500,792 | 64,917 | 11.4 | 10.1 | 1.3 | 1.64 |
| 2003 | 49,925,000 | 589,851 | 504,127 | 85,724 | 11.8 | 10.1 | 1.7 | 1.72 |
| 2004 | 50,194,000 | 607,184 | 480,717 | 126,467 | 12.1 | 9.6 | 2.5 | 1.77 |
| 2005 | 50,606,000 | 613,028 | 479,678 | 133,350 | 12.1 | 9.5 | 2.6 | 1.77 |
| 2006 | 50,965,000 | 635,748 | 470,326 | 165,422 | 12.5 | 9.2 | 3.3 | 1.83 |
| 2007 | 51,381,000 | 655,357 | 470,721 | 184,636 | 12.8 | 9.2 | 3.6 | 1.88 |
| 2008 | 51,815,000 | 672,809 | 475,763 | 197,046 | 13.0 | 9.2 | 3.8 | 1.92 |
| 2009 | 52,196,000 | 671,058 | 459,241 | 211,817 | 12.9 | 8.8 | 4.1 | 1.91 |
| 2010 | 52,642,000 | 687,007 | 461,017 | 225,990 | 13.1 | 8.8 | 4.3 | 1.94 |
| 2011 | 53,107,000 | 688,120 | 452,862 | 235,258 | 13.0 | 8.5 | 4.5 | 1.93 |
| 2012 | 53,493,000 | 694,241 | 466,779 | 227,462 | 13.0 | 8.7 | 4.3 | 1.94 |
| 2013 | 53,865,000 | 664,517 | 473,552 | 190,965 | 12.3 | 8.8 | 3.5 | 1.85 |
| 2014 | 54,316,000 | 661,496 | 468,875 | 192,621 | 12.2 | 8.6 | 3.6 | 1.83 |
| 2015 | 54,786,000 | 664,399 | 495,309 | 169,090 | 12.1 | 9.0 | 3.1 | 1.82 |
| 2016 | 55,268,000 | 663,157 | 490,454 | 172,703 | 12.0 | 8.9 | 3.1 | 1.81 |
| 2017 | 55,619,000 | 646,794 | 498,882 | 147,912 | 11.6 | 9.0 | 2.6 | 1.76 |
| 2018 | 55,977,000 | 625,651 | 505,859 | 119,792 | 11.2 | 9.0 | 2.2 | 1.70 |
| 2019 | 56,287,000 | 610,505 | 488,952 | 121,553 | 10.8 | 8.7 | 2.1 | 1.66 |
| 2020 | 56,550,000 | 585,195 | 569,700 | 15,495 | 10.3 | 10.1 | 0.3 | 1.59 |
| 2021 | 549,207 |
In 2019 70.5% of all babies were born to UK-born mothers while 29.5% were born to foreign-born mothers of which 10.8% came from the EU and 18.7% from non-EU countries.[11]
Current vital statistics[]
| Period | Live births | Deaths | Natural increase |
|---|---|---|---|
| January - March 2020 | 145,021 | 140,356 | +4,665 |
| January - March 2021 | 139,680 | 169,852 | -30,172 |
| Difference |
- Deaths from January 2021 =
 68,796
 - Deaths from January 2022 =
 49,807 [14]
Historical percent distribution of the total population by age[]
| Ages | 1901 | 1931 | 1951 | 1961 |
|---|---|---|---|---|
| 0-14 years | 32 | 24 | 22 | 23 |
| 15-64 years | 63 | 69 | 67 | 65 |
| 65 years and over | 5 | 7 | 11 | 12 |
| Total (%) | 100 | 100 | 100 | 100 |
Place of birth[]
Places of birth given by respondents to the 2001 and 2011 censuses were as follows:
| Country of birth | 2001[16] | 2011[17] | ||
|---|---|---|---|---|
| Number | % | Number | % | |
| 42,968,596 | 87.44% | 44,246,592 | 83.46% | |
| 794,577 | 1.62% | 708,872 | 1.34% | |
| 609,711 | 1.24% | 506,619 | 0.96% | |
| 215,124 | 0.44% | 206,735 | 0.39% | |
| 6,499 | 0.01% | |||
| 459,662 | 0.94% | 395,182 | 0.75% | |
| Total Born in all EU Member Countries | 695,045 | 1.41% | 1,980,259 | 3.73% |
| EU Member Countries (joined pre 2001) | 894,908 | 1.69% | ||
| Other EU Member Countries
(joined post-2001) |
1,085,351 | 2.04% | ||
| Other Countries | 3,396,116 | 6.91% | 4,961,698 | 9.36% |
| Total | 49,138,831 | 100.00% | 53,012,456 | 100.00% |
Below are the estimates of the largest foreign-born groups in England according to ONS estimates.
| Country of birth | 2013 | 2014[18] | 2015 | 2018 [19] |
|---|---|---|---|---|
| 698,000 | 748,000 | 751,000 | 832,000 | |
| 561,000 | 677,000 | 713,000 | 832,000 | |
| 479,000 | 499,000 | 478,000 | 535,000 | |
| 315,000 | 317,000 | 318,000 | 369,000 | |
| 263,000 | 267,000 | 253,000 | 309,000 |
Age[]
The data below is based on the 2011 census.[20] In 2001, the mean age of England's population was 38.60, and the median age was 37.00.

| Ages attained (years) |
Population | % of total population |
% per year of age band |
|---|---|---|---|
| 0–4 | 3,318,449 | 6.26 | 1.25 |
| 5–9 | 2,972,632 | 5.61 | 1.12 |
| 10–14 | 3,080,929 | 5.81 | 1.16 |
| 15–19 | 3,340,265 | 6.30 | 1.26 |
| 20–24 | 3,595,321 | 6.78 | 1.36 |
| 25–29 | 3,650,881 | 6.89 | 1.38 |
| 30–34 | 3,509,221 | 6.62 | 1.32 |
| 35–39 | 3,549,116 | 6.69 | 1.34 |
| 40–44 | 3,885,934 | 7.33 | 1.47 |
| 45–49 | 3,879,815 | 7.32 | 1.46 |
| 50–54 | 3,400,095 | 6.41 | 1.28 |
| 55–59 | 2,996,992 | 5.65 | 1.13 |
| 60–64 | 3,172,277 | 5.98 | 1.20 |
| 65–69 | 2,508,154 | 4.73 | 0.95 |
| 70–74 | 2,044,129 | 3.86 | 0.77 |
| 75–79 | 1,669,345 | 3.15 | 0.63 |
| 80–84 | 1,258,773 | 2.37 | 0.47 |
| 85–89 | 776,311 | 1.46 | 0.29 |
| 90+ | 403,817 | 0.76 | – |
Life expectancy at birth[21]
- January 2001 – December 2003
- Males: 76.24 years
- Females: 80.72 years
- January 2002 – December 2004
- Males: 76.55 years
- Females: 80.91 years
- January 2003 – December 2005
- Males: 76.92 years
- Females: 81.14 years
Ethnicity[]
| Ethnic group | Year | |||||
|---|---|---|---|---|---|---|
| 1991[22][23] | 2001[24] | 2011[25] | ||||
| Population | % | Population | % | Population | % | |
| White: Total | 44,144,339 | 93.8% | 44,679,361 | 91% | 45,281,142 |
85.4% |
| – | – | 42,747,136 | 87.0% | 42,279,236 | 79.8% | |
| – | – | 624,115 | 1.3% | 517,001 | 1.0% | |
| White: Irish Traveller/White Gypsy[note 1] | – | – | – | – | 54,895 | 0.1% |
| White: Other | – | – | 1,308,110 | 2.7% | 2,430,010 | 4.6% |
| Asian or Asian British: Total | 1,762,262 | 3.7% | 2,468,970 | 5% | 4,143,403 |
7.8% |
| 823,821 | 1.8% | 1,028,546 | 2.1% | 1,395,702 | 2.6% | |
| 449,646 | 1.0% | 706,539 | 1.4% | 1,112,282 | 2.1% | |
| 157,881 | 0.3% | 275,394 | 0.6% | 436,514 | 0.8% | |
| 141,661 | 0.3% | 220,681 | 0.5% | 379,502 | 0.7% | |
| Asian or Asian British: Asian Other | 189,253 | 0.4% | 237,810 | 0.5% | 819,403 | 1.6% |
| Black or Black British: Total | 874,882 | 1.9% | 1,132,508 | 2.3% | 1,846,614 |
3.5% |
| Black or Black British: Caribbean | 495,682 | 1.1% | 561,246 | 1.1% | 591,016 | 1.1% |
| Black or Black British: African | 206,918 | 0.4% | 475,938 | 1.0% | 977,741 | 1.8% |
| Black or Black British: Other | 172,282 | 0.4% | 95,324 | 0.2% | 277,857 | 0.5% |
| British Mixed: Total | – | – | 643,373 | 1.3% | 1,192,879 |
2.3% |
| Mixed: White and Caribbean | – | – | 231,424 | 0.5% | 415,616 | 0.8% |
| Mixed: White and African | – | – | 76,498 | 0.2% | 161,550 | 0.3% |
| Mixed: White and Asian Other | – | – | 184,014 | 0.4% | 332,708 | 0.6% |
| Mixed: Other Mixed | – | – | 151,437 | 0.3% | 283,005 | 0.3% |
| Other: Total | 273,721 | 0.6% | 214,619 | 0.4% | 548,418 |
1.0% |
| Other: Arab[note 1] | – | – | – | – | 220,985 | 0.4% |
| Other: Any other ethnic group | 273,721 | 0.6% | 214,619 | 0.4% | 327,433 | 0.6% |
| Total | 47,055,204 | 100% | 49,138,831 | 100% | 53,012,456 |
100% |
Notes for table above
Languages[]
The most common main languages spoken in England according to the 2011 census are shown below.[26]
| Rank | Language | Usual residents aged 3+ | Proportion |
|---|---|---|---|
| 1 | English | 46,936,780 | 92.02% |
| 2 | Polish | 529,173 | 1.04% |
| 3 | Punjabi | 271,580 | 0.53% |
| 4 | Hindi/Urdu | 266,330 | 0.52% |
| 5 | Bengali (with Sylheti and Chatgaya) | 216,196 | 0.42% |
| 6 | Gujarati | 212,217 | 0.42% |
| 7 | Arabic | 152,490 | 0.30% |
| 8 | French | 145,026 | 0.28% |
| 9 | Portuguese | 131,002 | 0.26% |
| 10 | Spanish | 118,554 | 0.23% |
| 11 | Tamil | 99,773 | 0.20% |
| 12 | Turkish | 98,083 | 0.19% |
| 13 | Italian | 90,547 | 0.18% |
| 14 | Somali | 84,387 | 0.17% |
| 15 | Lithuanian | 84,327 | 0.17% |
| 16 | German | 75,190 | 0.15% |
| 17 | Persian/Farsi | 75,179 | 0.15% |
| 18 | Tagalog/Filipino | 67,593 | 0.13% |
| 19 | Romanian | 66,496 | 0.13% |
| 20 | Russian | 66,271 | 0.13% |
| – | Welsh | 8,248 | 0.02% |
| – | Cornish | 554 | 0.00% |
| – | Other | 1,209,614 | 2.37% |
| Population | 51,005,610 | 100.00% |
Religion[]
Religion in England (2011 census)
Respondents to the 2001 and 2011 censuses gave their religions as follows:
| Religion | 2001[27] | 2011[28] | ||
|---|---|---|---|---|
| Number | % | Number | % | |
| Christian | 35,251,244 | 71.74% | 31,479,876 | 59.38% |
| Muslim | 1,524,887 | 3.10% | 2,660,116 | 5.02% |
| Hindu | 546,982 | 1.11% | 806,199 | 1.52% |
| Sikh | 327,343 | 0.67% | 420,196 | 0.79% |
| Jewish | 257,671 | 0.52% | 261,282 | 0.49% |
| Buddhist | 139,046 | 0.28% | 238,626 | 0.45% |
| Other religion | 143,811 | 0.29% | 227,825 | 0.43% |
| No religion | 7,171,332 | 14.59% | 13,114,232 | 24.74% |
| Religion not stated | 3,776,515 | 7.69% | 3,804,104 | 7.18% |
| Total population | 49,138,831 | 100.00% | 53,012,456 | 100.00% |
See also[]
- Demography of the United Kingdom
- Demography of Scotland
- Demography of Wales
- Demography of Northern Ireland
- Demography of London
- Demography of Birmingham
- Demography of Greater Manchester
- United Kingdom Census 2011
- National Statistics Socio-economic Classification
- Census 2001 Ethnic Codes
- List of English districts by population
- List of urban areas in England by population
- List of towns and cities in England by historical population
- List of major settlements by population in English counties
Notes[]
References[]
- ^ "Population estimates - Office for National Statistics". www.ons.gov.uk.
- ^ "2011 Census: Population Estimates for the United Kingdom" (PDF). Office for National Statistics. 27 March 2011. Retrieved 18 December 2012.
- ^ "National Statistics Online – Live births". Statistics.gov.uk. Retrieved 9 July 2010.
- ^ Pryor, Francis (2004). Briatin BC: Life in Britain and Ireland Before the Romans. London: Harper Perennial. ISBN 978-0007126934.
- ^ S. Broadberry et al (2010), "English Medieval Population: Reconciling Time Series and Cross Sectional Evidence", Table 7 (Preprint, p.22); S. Broadberry et al (2010), "British Economic Growth 1270–1870", Table 18 (Preprint, p. 54); see also S. Broadberry et al (2015), British Economic Growth 1270–1870, Cambridge University Press, ISBN 1107070783, Chapter 1, and Table 5.06, pg 205
See also B. Campbell (1990), "People and Land in the Middle Ages, 1066–1500", in Robert A. Dodgshon and Robin A. Butlin (eds), Historical Geography of England and Wales, 2nd edition. Elsevier. ISBN 1483288412, pp. 69–122 for discussion of drivers and trends underlying the numbers. - ^ a b Wrigley and Schofield, "The Population History of England, 1541–1871. A reconstruction.", Harvard University Press, 1981, Table 7.8, pgs. 208-9, [1]
- ^ At the time of the first census. Census officials estimated that there had been an increase of 77% in the preceding 100 years. In each county women were in the majority. Notes for 1801 taken from Kent 1800–1899 – A Chronicle of the Nineteenth Century Bob Ogley (Froglets Publications 2003) ISBN 1-872337-51-1. Wrigley and Schofield estimate 8,664,000 based on birth and death records.]
- ^ Vision of Britain a population through time England, Retrieved 9 August 2013
- ^ 2011 Census: Population Estimates for the United Kingdom, 27 March 2011 (PDF), ONS, 12 December 2011, archived from the original (PDF) on 5 January 2016, retrieved 9 August 2013
- ^ "Vital Statistics: Population and Health Reference Tables". Office for National Statistics. Retrieved 20 July 2017.
- ^ "Parents' country of birth - Office for National Statistics". www.ons.gov.uk.
- ^ "Provisional births in England and Wales".
- ^ "Deaths registered monthly in England and Wales".
- ^ "Deaths registered monthly in England and Wales". Office for National Statistics. Retrieved 22 October 2021.
- ^ A. H. Halsey (1972). Trends in British Society since 1900. Palgrave MacMillan. ISBN 978-1-349-00780-6.
- ^ Census 2001 Key Statistics – Local Authorities KS05 Country of birth, Accessed 6 September 2014
- ^ 2011 Census: KS202EW National identity, local authorities in England and Wales, Accessed 22 December 2012
- ^ "Table 1.3: Overseas-born population in the United Kingdom, excluding some residents in communal establishments, by sex, by country of birth, January 2014 to December 2014". Office for National Statistics. 27 August 2015. Retrieved 17 April 2016. Figures given are the central estimates. See the source for 95 per cent confidence intervals.
- ^ https://www.ons.gov.uk/file?uri=%2fpeoplepopulationandcommunity%2fpopulationandmigration%2finternationalmigration%2fdatasets%2fpopulationoftheunitedkingdombycountryofbirthandnationality%2fjanuarytodecember2018/populationbycountryofbirthandnationalityjan18todec18.xls
- ^ UK Statistics (27 March 2011). "2011 Census: Usual resident population by five-year age group and sex, United Kingdom and constituent countries". UK Statistics. Retrieved 19 December 2012.
- ^ Neighbourhood Statistics. "Life Expectancy at Birth for City of London, London, England". Neighbourhood.statistics.gov.uk. Retrieved 9 July 2010.
- ^ As UK Census data past 2001 is unavailable through the ONS website, it has been recommended to use archival census collection websites to obtain data. Data is taken from United Kingdom Casweb Data services of the United Kingdom 1991 Census on Ethnic Data for England (Table 6)
- ^ Office of Population Censuses and Surveys ; General Register Office for Scotland ; Registrar General for Northern Ireland (1997): 1991 Census aggregate data. UK Data Service (Edition: 1997). DOI: http://dx.doi.org/10.5257/census/aggregate-1991-1 This information is licensed under the terms of the Open Government Licence
- ^ "Key Statistics for local authorities; Ethnic Statistics for England and Wales". webarchive.nationalarchives.gov.uk. Archived from the original on 7 September 2021. Retrieved 7 January 2022.
- ^ "Key Statistics for England and Wales: Ethnic statistics". webarchive.nationalarchives.gov.uk. Archived from the original on 8 August 2021. Retrieved 7 January 2022.
- ^ "View:England". NOMIS. Retrieved 5 September 2014.
- ^ "Religion (2001 Census)". data.gov.uk. 9 February 2010. Retrieved 18 December 2012.
- ^ "2011 Census: KS209EW Religion, local authorities in England and Wales". ons.gov.uk. Retrieved 18 December 2012.
External links[]
- National Statistics
- Populstat population figure site – main source for 1801–1991
- Genealogical documents
- England map by county population
._.
- 2001 in England
- Demographics of England
- Ethnic groups in the United Kingdom
- History of England by topic
- 2001 United Kingdom census