Demographics of Belarus
| Demographics of Belarus | |
|---|---|
 Population pyramid 2018 | |
| Population | 9,349,645 (2021) |
| Age structure | |
| 0–14 years | 16.9%(male 821,285/female 772,360) |
| 15–64 years | 67.7%(male 3,053,618/female 3,314,835) |
| 65 and over | 15.4%(male 479,740/female 971,608) (2019 census) |
| Sex ratio | |
| Total | 0.87 male(s)/female (2014) |
| At birth | 1.06 male(s)/female |
| Under 15 | 1.06 male(s)/female |
| 15–64 years | 0.94 male(s)/female |
| 65 and over | 0.46 male(s)/female |
| Nationality | |
| Nationality | noun: Belarusian(s) adjective: Belarusian |
| Major ethnic | Belarusians |
| Language | |
| Spoken | Belarusian, Russian |

| Year | Pop. | ±% |
|---|---|---|
| 1897 | 6,673,000 | — |
| 1914 | 6,899,100 | +3.4% |
| 1926 | 4,983,240 | −27.8% |
| 1939 | 5,568,994 | +11.8% |
| 1951 | 7,781,100 | +39.7% |
| 1959 | 8,055,700 | +3.5% |
| 1970 | 8,992,200 | +11.6% |
| 1979 | 9,532,500 | +6.0% |
| 1989 | 10,151,800 | +6.5% |
| 1999 | 10,045,200 | −1.1% |
| 2009 | 9,503,800 | −5.4% |
| 2019 | 9,413,446 | −1.0% |
| 2021 | 9,349,645 | −0.7% |
| Source:[1] | ||
The demographics of Belarus is about the demographic features of the population of Belarus, including population growth, population density, ethnicity, education level, health, economic status, religious affiliations, and other aspects of the population.
Demographic trends[]
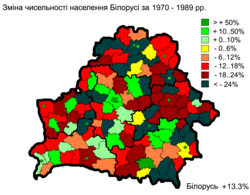
The population of Belarus suffered a dramatic decline during World War II, dropping from more than 9 million in 1940 to 7.7 million in 1951. It then resumed its long-term growth, rising to 10 million in 1999.[2] After that the population began a steady decline, dropping to 9.7 million in 2006–2007.[3] Originally a highly agrarian country with nearly 80% of its population in rural areas, Belarus has been undergoing a process of continuous urbanization. The share of its rural population decreased from 70% in 1959 to less than 30% in the 2000s.[4]
Population[]
Age structure[]
- 0–14 years: 15.4% (male 759,285/female 717,118)
- 15–24 years: 11.7% (male 575,907/female 544,170)
- 25–54 years: 45.5% (male 2,141,419/female 2,227,433)
- 55–64 years: 13.3% (male 562,639/female 716,216)
- 65 years and over: 14.2% (male 430,225/female 933,646) (2014 est.)
Median age[]
- Total: 39.4 years
- Male: 36.3 years
- Female: 42.4 years (2014 est.)
Sex ratio[]
- At birth: 1.06 male(s)/female
- 0–14 years: 1.06 male(s)/female
- 15–24 years: 1.06 male(s)/female
- 25–54 years: 0.96 male(s)/female
- 55–64 years: 0.87 male(s)/female
- 65 years and over: 0.46 male(s)/female
- Total population: 0.87 male(s)/female (2014 est.)
 |
 |
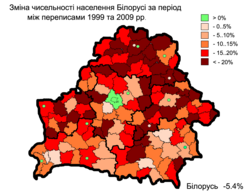 | ||
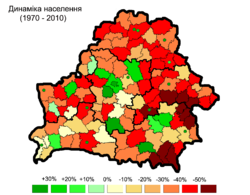
| 1970–1989 | 1970–2010 | 1999–2010 |
Vital statistics[]
Belarusian provinces of the Russian Empire[]
The figures below refer to the five governorates of the Russian Empire (Grodno, Vitebsk, Minsk, Mogilev, Vilna) with a Belarusian majority.[8]
| Average population | Live births | Deaths | Natural change | Crude birth rate (per 1000) | Crude death rate (per 1000) | Natural change (per 1000) | |
|---|---|---|---|---|---|---|---|
| 1900 | 9,009,000 | 393,612 | 222,350 | 171,262 | 43.7 | 24.7 | 19.0 |
| 1901 | 9,176,000 | 386,064 | 235,223 | 150,841 | 42.1 | 25.6 | 16.4 |
| 1902 | 9,328,000 | 408,209 | 220,421 | 187,788 | 43.8 | 23.6 | 20.1 |
| 1903 | 9,512,000 | 372,206 | 236,846 | 135,360 | 39.1 | 24.9 | 14.2 |
| 1904 | 9,676,000 | 387,501 | 236,530 | 150,971 | 40.0 | 24.4 | 15.6 |
| 1905 | 9,828,000 | 372,119 | 239,956 | 132,163 | 37.9 | 24.4 | 13.4 |
| 1906 | 10,004,000 | 381,101 | 210,556 | 170,545 | 38.1 | 21.0 | 17.0 |
| 1907 | 10,152,000 | 380,932 | 193,273 | 187,659 | 37.5 | 19.0 | 18.5 |
| 1908 | 10,373,000 | 363,095 | 204,611 | 158,484 | 35.0 | 19.7 | 15.3 |
| 1909 | 10,561,000 | 382,501 | 209,211 | 173,290 | 36.2 | 19.8 | 16.4 |
| 1910 | 10,725,000 | 371,091 | 224,884 | 146,207 | 34.6 | 21.0 | 13.6 |
| 1911 | 10,858,000 | 380,034 | 202,405 | 177,629 | 35.0 | 18.6 | 16.4 |
| 1912 | 11,072,000 | 387,594 | 188,434 | 199,160 | 35.0 | 17.0 | 18.0 |
| 1913 | 11,283,000 | 372,229 | 202,323 | 169,906 | 33.0 | 17.9 | 15.1 |
| 1914 | 11,587,000 | 384,682 | 210,515 | 174,167 | 33.2 | 18.2 | 15.0 |
After WWII[]
Source: National Statistical Committee of the Republic of Belarus[10]
| Average population | Live births | Deaths | Natural change | Crude birth rate (per 1000) | Crude death rate (per 1000) | Natural change (per 1000) | Total fertility rate | Abortions. reported | |
|---|---|---|---|---|---|---|---|---|---|
| 1950 | 7,745,000 | 197,200 | 62,000 | 135,200 | 25.5 | 8.0 | 17.5 | ||
| 1951 | 7,765,000 | 198,200 | 61,200 | 137,000 | 25.5 | 7.9 | 17.6 | ||
| 1952 | 7,721,000 | 191,100 | 64,200 | 126,900 | 24.8 | 8.3 | 16.4 | ||
| 1953 | 7,690,000 | 176,200 | 61,900 | 114,300 | 22.9 | 8.0 | 14.9 | ||
| 1954 | 7,722,000 | 193,100 | 61,600 | 131,500 | 25.0 | 8.0 | 17.0 | ||
| 1955 | 7,804,000 | 194,400 | 58,000 | 136,400 | 24.9 | 7.4 | 17.5 | ||
| 1956 | 7,880,000 | 199,500 | 56,000 | 143,500 | 25.3 | 7.1 | 18.2 | ||
| 1957 | 7,936,000 | 200,800 | 58,000 | 142,800 | 25.3 | 7.3 | 18.0 | ||
| 1958 | 8,009,000 | 207,700 | 53,700 | 154,000 | 25.9 | 6.7 | 19.2 | ||
| 1959 | 8,112,000 | 204,600 | 62,600 | 142,000 | 25.2 | 7.7 | 17.5 | 2.72 | |
| 1960 | 8,190,000 | 200,218 | 54,037 | 146,181 | 24.4 | 6.6 | 17.8 | 2.69 | 170,787 |
| 1961 | 8,284,000 | 194,239 | 53,682 | 140,557 | 23.4 | 6.5 | 17.0 | 2.66 | 178,290 |
| 1962 | 8,385,000 | 185,302 | 60,676 | 124,626 | 22.1 | 7.2 | 14.9 | 2.57 | 185,554 |
| 1963 | 8,458,000 | 173,889 | 58,291 | 115,598 | 20.6 | 6.9 | 13.7 | 2.46 | 191,137 |
| 1964 | 8,519,000 | 161,794 | 53,967 | 107,827 | 19.0 | 6.3 | 12.7 | 2.36 | 200,534 |
| 1965 | 8,607,000 | 153,865 | 58,156 | 95,709 | 17.9 | 6.8 | 11.1 | 2.27 | 205,999 |
| 1966 | 8,709,000 | 153,414 | 58,265 | 95,149 | 17.6 | 6.7 | 10.9 | 2.28 | 203,430 |
| 1967 | 8,800,000 | 147,501 | 61,263 | 86,238 | 16.8 | 7.0 | 9.8 | 2.26 | 203,722 |
| 1968 | 8,877,000 | 146,095 | 62,354 | 83,741 | 16.5 | 7.0 | 9.4 | 2.23 | 198,955 |
| 1969 | 8,957,000 | 142,652 | 65,912 | 76,740 | 15.9 | 7.4 | 8.6 | 2.18 | 191,637 |
| 1970 | 9,038,000 | 146,676 | 68,974 | 77,702 | 16.2 | 7.6 | 8.6 | 2.30 | 187,935 |
| 1971 | 9,112,000 | 149,135 | 68,511 | 80,624 | 16.4 | 7.5 | 8.8 | 2.34 | 190,169 |
| 1972 | 9,178,000 | 147,813 | 71,866 | 75,947 | 16.1 | 7.8 | 8.3 | 2.36 | 185,101 |
| 1973 | 9,245,000 | 144,729 | 73,927 | 70,802 | 15.7 | 8.0 | 7.7 | 2.29 | 193,503 |
| 1974 | 9,312,000 | 146,876 | 73,181 | 73,695 | 15.8 | 7.9 | 7.9 | 2.24 | 194,247 |
| 1975 | 9,367,000 | 146,517 | 79,701 | 66,816 | 15.6 | 8.5 | 7.1 | 2.20 | 194,710 |
| 1976 | 9,411,000 | 147,912 | 82,400 | 65,512 | 15.7 | 8.8 | 7.0 | 2.16 | 199,121 |
| 1977 | 9,463,000 | 148,963 | 84,565 | 64,398 | 15.7 | 8.9 | 6.8 | 2.11 | 202,146 |
| 1978 | 9,525,000 | 151,053 | 86,612 | 64,441 | 15.9 | 9.1 | 6.8 | 2.08 | 201,619 |
| 1979 | 9,590,000 | 151,800 | 90,837 | 60,963 | 15.8 | 9.5 | 6.4 | 2.05 | 203,446 |
| 1980 | 9,658,000 | 154,432 | 95,514 | 58,918 | 16.0 | 9.9 | 6.1 | 2.04 | 201,852 |
| 1981 | 9,732,000 | 157,899 | 93,136 | 64,763 | 16.2 | 9.6 | 6.7 | 2.08 | 202,340 |
| 1982 | 9,804,000 | 159,364 | 93,840 | 65,524 | 16.3 | 9.6 | 6.7 | 2.02 | 198,011 |
| 1983 | 9,872,000 | 173,510 | 97,849 | 75,661 | 17.6 | 9.9 | 7.7 | 2.09 | 207,461 |
| 1984 | 9,938,000 | 168,749 | 104,274 | 64,475 | 17.0 | 10.5 | 6.5 | 2.14 | 210,844 |
| 1985 | 9,999,000 | 165,034 | 105,690 | 59,344 | 16.6 | 10.6 | 5.9 | 2.09 | 200,888 |
| 1986 | 10,058,000 | 171,611 | 97,276 | 74,335 | 17.1 | 9.7 | 7.4 | 2.10 | 171,114 |
| 1987 | 10,111,000 | 162,937 | 99,921 | 63,016 | 16.2 | 9.9 | 6.2 | 2.04 | 163,761 |
| 1988 | 10,144,000 | 163,193 | 102,671 | 60,522 | 16.1 | 10.1 | 6.0 | 2.03 | 140,921 |
| 1989 | 10,171,000 | 153,449 | 103,479 | 49,970 | 15.1 | 10.2 | 4.9 | 2.03 | 256,041 |
| 1990 | 10,189,348 | 142,167 | 109,582 | 32,585 | 14.0 | 10.8 | 3.2 | 1.91 | 260,839 |
| 1991 | 10,194,050 | 132,045 | 114,650 | 17,395 | 13.0 | 11.2 | 1.7 | 1.81 | 241,138 |
| 1992 | 10,216,470 | 127,971 | 116,674 | 11,297 | 12.5 | 11.4 | 1.1 | 1.76 | 240,387 |
| 1993 | 10,239,050 | 117,384 | 128,544 | -11,160 | 11.5 | 12.6 | -1.1 | 1.62 | 217,957 |
| 1994 | 10,226,955 | 110,599 | 130,003 | -19,404 | 10.8 | 12.7 | -1.9 | 1.53 | 212,533 |
| 1995 | 10,193,831 | 101,144 | 133,775 | -32,631 | 9.9 | 13.1 | -3.2 | 1.41 | 193,280 |
| 1996 | 10,159,569 | 95,798 | 133,422 | -37,624 | 9.4 | 13.1 | -3.7 | 1.34 | 174,098 |
| 1997 | 10,117,433 | 89,586 | 136,653 | -47,067 | 8.9 | 13.5 | -4.7 | 1.25 | 152,660 |
| 1998 | 10,071,963 | 92,645 | 137,296 | -44,651 | 9.2 | 13.6 | -4.4 | 1.30 | 145,339 |
| 1999 | 10,026,738 | 92,975 | 142,027 | -49,052 | 9.3 | 14.2 | -4.9 | 1.31 | 135,829 |
| 2000 | 9,979,610 | 93,691 | 134,867 | -41,176 | 9.4 | 13.5 | -4.1 | 1.32 | 121,895 |
| 2001 | 9,928,549 | 91,720 | 140,299 | -48,579 | 9.2 | 14.1 | -4.9 | 1.29 | 101,402 |
| 2002 | 9,865,548 | 88,743 | 146,655 | -57,912 | 9.0 | 14.9 | -5.9 | 1.24 | 89,895 |
| 2003 | 9,796,749 | 88,512 | 143,200 | -54,688 | 9.0 | 14.6 | -5.6 | 1.23 | 80,174 |
| 2004 | 9,730,146 | 88,943 | 140,064 | -51,121 | 9.1 | 14.4 | -5.3 | 1.23 | 71,700 |
| 2005 | 9,663,915 | 90,508 | 141,857 | -51,349 | 9.4 | 14.7 | -5.3 | 1.25 | 64,655 |
| 2006 | 9,604,924 | 96,721 | 138,426 | -41,705 | 10.1 | 14.4 | -4.3 | 1.34 | 58,516 |
| 2007 | 9,560,953 | 103,626 | 132,993 | -29,367 | 10.8 | 13.9 | -3.1 | 1.43 | 46,287 |
| 2008 | 9,527,985 | 107,876 | 133,879 | -26,003 | 11.3 | 14.1 | -2.7 | 1.49 | 42,197 |
| 2009 | 9,506,765 | 109,263 | 135,097 | -25,834 | 11.5 | 14.2 | -2.7 | 1.51 | 35,967 |
| 2010 | 9,483,850 | 108,050 | 137,132 | -29,082 | 11.4 | 14.5 | -3.1 | 1.49 | 33,262 |
| 2011 | 9,461,650 | 109,147 | 135,090 | -25,943 | 11.5 | 14.3 | -2.7 | 1.52 | 32,031 |
| 2012 | 9,446,850 | 115,893 | 126,531 | -10,638 | 12.3 | 13.4 | -1.1 | 1.62 | 28,628 |
| 2013 | 9,443,250 | 117,997 | 125,326 | -7,329 | 12.5 | 13.3 | -0.8 | 1.67 | 31,206 |
| 2014 | 9,448,550 | 118,534 | 121,542 | -3,008 | 12.5 | 12.9 | -0.3 | 1.70 | 29,797 |
| 2015 | 9,461,100 | 119,028 | 120,026 | -998 | 12.6 | 12.7 | -0.1 | 1.72 | 29,217 |
| 2016 | 9,469,400 | 117,779 | 119,379 | -1,600 | 12.4 | 12.6 | -0.2 | 1.73 | 27,467 |
| 2017 | 9,459,000 | 102,556 | 119,311 | -16,755 | 10.8 | 12.6 | -1.8 | 1.54 | |
| 2018 | 9,438,800 | 94,042 | 120,053 | -26,011 | 10.0 | 12.7 | -2.8 | 1.45 | |
| 2019[11] | 9,419,800 | 87,602 | 120,470 | -32,868 | 9.3 | 12.8 | -3.5 | 1.38 | |
| 2020[12] | 9,379,952 | 83,015 | 144,536 | -61,651 | 8.9 | 15.4 | -6.5 |
Current vital statistics[]
| Period | Live births | Deaths | Natural increase |
|---|---|---|---|
| January - March 2019 | 21,519 | 32,229 | -10,710 |
| January - March 2020 | 20,180 | 31,039 | -10,859 |
| Difference |
Birth rate (by district, 2019)

Mortality rate (by district, 2019)

Rate of natural increase (by district, 2019)


Infant mortality rate[]
- Total: 4.0
 deaths/1,000 live births for 429 death. (2010)
 - Total: 3.9 deaths/1,000 live births for 422 death. (2011)
- Total: 3.4 deaths/1,000 live births for 386 death. (2012)
- Total: 3.5
 deaths/1,000 live births for 407 death. (2013)
 - Total: 3.5
 deaths/1,000 live births for 415 death. (2014)
- Total: 3.5 deaths/1,000 live births for 321 death. (January–September 2014)
- Total: 3.2 deaths/1,000 live births for 283 death. (January–September 2015)
Total fertility rate (TFR) in Belarus by region and year[]
| Region | 2017 | 2016 | 2015 | 2010 | 2005 |
|---|---|---|---|---|---|
| Belarus (total) | 1.54 | 1.73 | 1.72 | 1.49 | 1.25 |
| Minsk | 1.06 | 1.21 | 1.24 | 1.25 | 1.08 |
| Vitebsk Oblast | 1.45 | 1.63 | 1.62 | 1.42 | 1.19 |
| Mogilev Oblast | 1.65 | 1.85 | 1.83 | 1.49 | 1.25 |
| Gomel Oblast | 1.72 | 1.93 | 1.89 | 1.55 | 1.28 |
| Grodno Oblast | 1.75 | 2.03 | 1.96 | 1.63 | 1.30 |
| Brest Oblast | 1.89 | 2.10 | 2.06 | 1.73 | 1.45 |
| Minsk Oblast | 1.94 | 2.16 | 2.18 | 1.72 | 1.37 |
Life expectancy at birth[]

- Total population: 72.15 years
- country comparison to the world: 138
- Male: 66.53 years
- Female: 78.1 years (2014 est.)
| Period | Life expectancy in Years |
|---|---|
| 1950–1955 | 60.71 |
| 1955–1960 | |
| 1960–1965 | |
| 1965–1970 | |
| 1970–1975 | |
| 1975–1980 | |
| 1980–1985 | |
| 1985–1990 | |
| 1990–1995 | |
| 1995–2000 | |
| 2000–2005 | |
| 2005–2010 | |
| 2010–2015 |
Demographic situation in 2015[]
| Top 10 cities with the highest birth rate | 2014[15] |
|---|---|
| 20.7 | |
| Brahin | 19.9 |
| Chachersk | 19.3 |
| Lahoysk | 19.0 |
| 18.0 | |
| Karma | 17.4 |
| Ivanava | 17.3 |
| Zhytkavichy | 17.0 |
| Obol | 16.8 |
| Slawharad | 16.7 |
| Zaslawye | 16.5 |
| Top 10 cities with the lowest birth rate | 2015 |
| 4.8 | |
| Yanovichi | 4.9 |
| Vidzy | 5.3 |
| 6.2 | |
| Damachava | 6.5 |
| 6.6 | |
| Lubcha | 7.2 |
| Vetrino | 7.3 |
| Kamaryn | 7.4 |
| Azarychy | 8.1 |
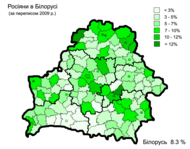
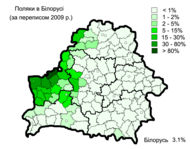
Ethnic groups[]
- Belarusians 84.9%, Russians 7.5%, Poles 3.1%, Ukrainians 1.7%, Jews 0.1%, Armenians 0.1%, Lipka Tatars 0.1%, Ruska Roma 0.1%, Lithuanians 0.1%, Azerbaijanis 0.1%, others 2.2% (2019 census).
Prior to the Second World War[]
Prior to World War II, Jews were the second largest ethnic group in Belarus, and at 400,000 in the 1926 and 1939 censuses they even exceeded the number of Russians (although admittedly by a small margin).[16] Jews accounted for 7%–8% of the total population at that time, comprising more than 40% of the population in cities and towns, where Jews and Poles were the majority, while Belarusians mostly lived in rural areas.
The Poles were the fourth largest ethnic group in Belarussian SSR (current Eastern portion of Belarus), before World War II, comprising 1–2% of the population in the pre-war censuses (less than 100,000).[16]
| Ethnic group |
census 19261 | census 19392 | ||
|---|---|---|---|---|
| Number | % | Number | % | |
| Belarusians | 4,017,301 | 80.6 | 4,615,496 | 82.9 |
| Jews | 407,059 | 8.2 | 375,092 | 6.7 |
| Russians | 383,806 | 7.7 | 364,705 | 6.6 |
| Poles | 97,498 | 2.0 | 58,380 | 1.1 |
| Ukrainians | 34,681 | 0.7 | 104,247 | 1.9 |
| Germans | 7,075 | 0.1 | 8,448 | 0.2 |
| Latvians | 14,080 | 0.3 | 8,117 | 0.2 |
| Tatars | 3,777 | 0.1 | 7,664 | 0.1 |
| Lithuanians | 6,864 | 0.1 | 4,284 | 0.1 |
| Roma | 2,366 | 0.1 | 3,632 | 0.1 |
| Mordvins | 1,051 | 0.0 | 2,042 | 0.0 |
| Others | 7,682 | 0.2 | 16,887 | 0.3 |
| Total | 4,983,240 | 5,568,994 | ||
| 1 Source: [2]. 2 Source: [3]. | ||||
After the Second World War[]
The Holocaust decimated the Jewish population in Belarus, and after World War II, in 1959, Jews accounted for only 1.9% of the population. Since then, Jewish emigration to Israel and other countries reduced the number of Jews to 0.1% of the population (13,000 in 2009).

After the war, a large number of Poles were forced to move to Poland. In exchange, Belarusians from the former Belastok Voblast, which was returned to Poland in 1945, after being occupied in 1939 were displaced to Belarus. Due to changes in the western border of Belarus and Poland after World War II (see territorial changes of Poland), the number of Poles in Belarus increased to more than 500,000 according to the first post-war census (1959) and to about 400,000 according to the 1999 census. Poles are now the third largest ethnic group in Belarus (see Polish minority in Belarus). There are around 15,000 of Lipka Tatars and about 10,000 of Ruska Roma (Russian Gypsies).
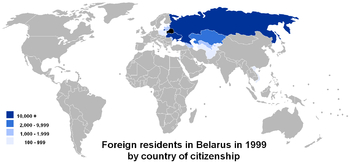
In the post-war period Belarus experienced an influx of workers from other parts of the Soviet Union, for example Russians and Ukrainians. The decade after independence saw a decline in the population of most of these minority groups, either by assimilation or emigration. The most significant exception to this trend has been a continued (if small-scale) net immigration of Armenians and Azerbaijanis, whose numbers increased from less than 2,000 in 1959 to around 10,000 in 1999.[2]
 |
 |
 |
 | |||
| Belarusian | Russians | Poles | Ukrainians |
 |
 |
 |
 | |||
| Belarusian | Russians | Poles | Ukrainians |
| Ethnic group |
census 19591 | census 19702 | census 19793 | census 19894 | census 19995 | census 20096 | census 20197 | |||||||
|---|---|---|---|---|---|---|---|---|---|---|---|---|---|---|
| Number | % | Number | % | Number | % | Number | % | Number | % | Number | % | Number | % | |
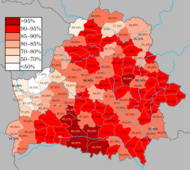
| Belarusians | 6,532,035 | 81.1 | 7,289,610 | 81.0 | 7,567,955 | 79.4 | 7,904,623 | 77.9 | 8,158,900 | 81.2 | 7,957,252 | 83.7 | 7,990,719 | 84.9 |
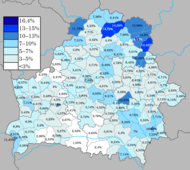
| Russians | 659,093 | 8.2 | 938,161 | 10.4 | 1,134,117 | 11.9 | 1,342,099 | 13.2 | 1,141,700 | 11.4 | 785,084 | 8.3 | 706,992 | 7.5 |
| Poles | 538,881 | 6.7 | 382,600 | 4.3 | 403,169 | 4.2 | 417,720 | 4.1 | 395,700 | 3.9 | 294,549 | 3.1 | 287,693 | 3.1 |
| Ukrainians | 133,061 | 1.7 | 190,839 | 2.1 | 230,985 | 2.4 | 291,008 | 2.9 | 237,000 | 2.4 | 158,723 | 1.7 | 159,656 | 1.7 |
| Jews | 150,084 | 1.9 | 148,011 | 1.6 | 135,450 | 1.4 | 111,975 | 1.1 | 27,800 | 0.3 | 12,926 | 0.1 | 13,705 | 0.1 |
| Armenians | 1,751 | 0.0 | 2,362 | 0.0 | 2,751 | 0.0 | 4,933 | 0.1 | 10,200 | 0.1 | 8,512 | 0.1 | 9,392 | 0.1 |
| Tatars | 8,650 | 0.1 | 9,992 | 0.1 | 10,851 | 0.1 | 12,436 | 0.1 | 10,100 | 0.1 | 7,316 | 0.1 | 8,445 | 0.1 |
| Romani | 4,662 | 0.1 | 6,843 | 0.1 | 8,408 | 0.1 | 10,762 | 0.1 | 9,900 | 0.1 | 7,079 | 0.1 | 6,848 | 0.1 |
| Azerbaijanis | 1,402 | 0.0 | 1,335 | 0.0 | 2,654 | 0.0 | 5,009 | 0.1 | 6,300 | 0.1 | 5,567 | 0.1 | 6,001 | 0.1 |
| Lithuanians | 8,363 | 0.1 | 8,092 | 0.1 | 6,993 | 0.1 | 7,606 | 0.1 | 6,400 | 0.1 | 5,087 | 0.1 | 5,287 | 0.1 |
| Others | 16,666 | 0.2 | 24,493 | 0.3 | 29,183 | 0.3 | 43,635 | 0.4 | 41,200 | 0.4 | 261,712 | 2.8 | 218,708 | 2.3 |
| Total | 8,054,648 | 9,002,338 | 9,532,516 | 10,151,806 | 10,045,200 | 9,503,807 | 9,413,446 | |||||||
| 1 Source: [4]. 2 Source: [5]. 3 Source: [6]. 4 Source: [7]. 5 Source: [8]. 6 Source: [9]. 7 Source: [10]. | ||||||||||||||
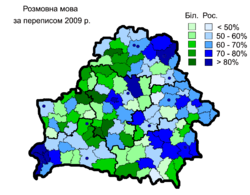
Languages[]
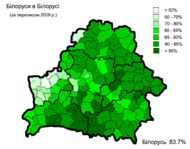
Belarusian and Russian are the official languages according to the Constitution of Belarus (Article 17). The constitution guarantees preservation of the cultural heritage of all ethnic minorities, including their languages (Article 15). Russian, and not Belarusian, is the dominant language in Belarus, spoken normally at home by 70% of the population (2009 census). Major cities such as Minsk and Brest are overwhelmingly Russian-speaking.
 |
 | |
| Native languages | Spoken languages |
Religion[]
According to 1997 estimates, 80% of the religious population belonged to the Eastern Orthodox Church and the others are mainly Roman Catholic, Greek Catholic, Protestants, Muslims, and Jews.[17]
Urbanization[]
- Urban population: 75% of total population (2011)
- Rate of urbanization: 0.21% annual rate of change (2010–2015 est.)
See also[]
- List of cities in Belarus
- Belarus Census (disambiguation)
References[]
- ^ "BELARUS: historical demographical data of the whole country". Populstat. Retrieved 6 July 2017.
- ^ Jump up to: a b Ethnic composition of the population Archived February 7, 2009, at the Wayback Machine, 1999 Belarus Census.
- ^ Population estimates 1995–2007 Archived 2008-12-03 at the Wayback Machine, BelStat
- ^ Statistical Yearbook of the Republic of Belarus 2007, BelStat, Minsk, 2007
- ^ "Population on January 1, 2018 by regions of the Republic of Belarus" (in Russian). Белстат. 2018.
- ^ "Belarus ranks 6th in population the CIS countries" (in Russian). БЕЛТА. 2018-07-06.
- ^ "Division of Belarus". pop-stat.mashke.org.
- ^ "Статистический ежегодник Российской Империи (Издание ЦСК ) - Проект "Исторические Материалы"". istmat.info.
- ^ [1] United Nations. Demographic Yearbooks
- ^ "National Statistical Committee of the Republic of Belarus".
- ^ "Естественное движение населения по Республике Беларусь за 2019 год" (PDF).
- ^ "Половозрастная структура населения Республики Беларусь на 1 января 2021 г. и среднегодовая численность населения за 2020 год" (PDF).
- ^ "Число зарегистрированных родившихся, умерших, браков и разводов по Республике Беларусь".
- ^ "Demographic Data". demdata.belstat.gov.by. 2016. Retrieved 2018-06-23.
- ^ "Дрибин, Брагин и Чечерск обставили Минск по рождаемости" [Drybin, Brahin and Chachersk overpassed Minsk in birth rate] (in Russian). Euroradio.
- ^ Jump up to: a b "Приложение Демоскопа Weekly". demoscope.ru.
- ^ "The World Factbook — Central Intelligence Agency". www.cia.gov.
External links[]

- Demographics of Belarus