Energy in Belarus


Energy in Belarus describes energy and electricity production, consumption and import in Belarus. Belarus is a net energy importer. According to IEA, the energy import vastly exceeded the energy production in 2015, describing Belarus as one of the world's least energy sufficient countries in the world.[1] Belarus is very dependent on Russia.[2]
Total energy consumption (measured by total primary energy supply) in Belarus was 27.0 Mtoe in 2018, similar to consumption in Norway and Hungary.[1] Primary energy use in Belarus was 327 TWh or 34 TWh per million persons in 2008.[3]
Primary energy use per capita in Belarus in 2009 (34 MWh) was slightly more than in Portugal (26 MWh) and about half of the use in Belgium (64 MWh) or Sweden (62 MWh).[3]
Overview[]
| Population (million) |
Prim. energy (TWh) |
Production (TWh) |
Import (TWh) |
Electricity (TWh) |
CO2-emission (Mt) | |
|---|---|---|---|---|---|---|
| 2004 | 9.82 | 311 | 42 | 272 | 30.9 | 60.6 |
| 2007 | 9.70 | 326 | 47 | 276 | 32.5 | 62.7 |
| 2008 | 9.68 | 327 | 47 | 287 | 33.2 | 64.2 |
| 2009 | 9.66 | 311 | 47 | 258 | 31.4 | 60.8 |
| 2012 | 9.47 | 343 | 50 | 286 | 34.4 | 66.0 |
| 2012R | 9.46 | 355 | 47.9 | 309 | 35.0 | 71.1 |
| 2013 | 9.47 | 317 | 46.4 | 274 | 34.5 | 58.3 |
| Change 2004-09 | -1.6% | -0.1% | 11.9% | -5.0% | 1.6% | 0.2% |
| Mtoe = 11.63 TWh, Prim. energy includes energy losses
2012R = CO2 calculation criteria changed, numbers updated | ||||||
Power plants[]
| Name | Region/city | Capacity, MW[5] |
|---|---|---|
| Lukoml GRES | Viciebsk Region | 2,889 |
| Brest Region | 1,095 | |
| Minsk thermal No. 4 | Minsk city | 1,035 |
| Minsk thermal No. 5 | Minsk Region | 719.6 |
| Homiel thermal No. 2 | Homiel city | 544 |
| Minsk thermal No. 3 | Minsk city | 442 |
| Mahilioŭ thermal No. 2 | Mahilioŭ city | 347 |
| Hrodna thermal No. 2 | Hrodna city | 302.5 |
| Navapolack thermal | Navapolack city | 270 |
| Mazyr thermal | Mazyr city | 205 |
| Babruysk thermal No. 2 | Babruysk city | 182.6 |
| Svietlahorsk thermal | Svietlahorsk city | 155 |
| Minsk thermal No. 2 | Minsk city | 94 |
| Viciebsk thermal | Viciebsk city | 80 |
| Orša thermal | Orša city | 79.8 |
| Barysaŭ thermal | Barysaŭ city | 65 |
| Žodzina thermal | Žodzina city | 54 |
| Lida thermal | Lida city | 43 |
| Viciebsk hydro | Viciebsk Region | 40 |
| Mahilioŭ thermal No. 1 | Mahilioŭ city | 38.5 |
| Homiel thermal No. 1 | Homiel city | 37.3 |
| Žlobin thermal | Žlobin city | 26.2 |
| Pinsk thermal | Pinsk city | 22 |
| Polack hydro | Viciebsk Region | 21.7 |
| Mahilioŭ thermal No. 3 | Mahilioŭ city | 19.5 |
| Baranavičy thermal | Baranavičy city | 18 |
| Hrodna hydro | Hrodna Region | 17 |
| Brest thermal | Brest city | 12 |
| Babruysk thermal No. 1 | Babruysk city | 12 |
The Astravets Nuclear Power Plant is under construction, with the first unit of two expected to come online in 2020.[6]
Natural gas[]
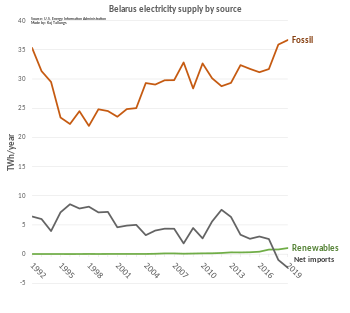
The country is one of the world’s largest importers of natural gas with estimates for 2018 being about 17 Mtoe (20 billion cubic metres [bcm]) of natural gas, making it the leading importer among the so-called EU4Energy countries: Armenia, Azerbaijan, Belarus, Georgia, Kazakhstan, Kyrgyzstan, Moldova, Tajikistan, Turkmenistan, Ukraine and Uzbekistan. In 2018 almost all generated electricity came from natural gas (97%, or 39 terawatt hours [TWh]).[1] In 1990, the IEA reported natural gas as constituting 52% of electricity generation, with oil generating 48%.[7]
There are two large gas pipes running through Belarus, the Yamal–Europe pipeline and Northern Lights. In addition there is the Minsk–Kaliningrad Interconnection that connects to Kaliningrad.
Oil[]

Belarus is a large oil refiner, listed 36th in the world, at 19 Mt of oil products in 2018 by the IEA.[1] It has two refineries and oil pipelines built during the Soviet era including the Mozyr Oil Refinery.
Renewable energy[]
Renewable energy generation accounted for 6% of Belarus’s energy in 2018, mostly from biofuels and waste. Renewables share in electricity generation was 2% in 2018 (0.8 TWh).[1]
Storage[]
Because non-nuclear thermal power plants are ramped up and down depending on heat requirements, and nuclear is not very flexible, increased battery storage has been suggested.[8]
Subsidies[]
Fossil fuelled heat is heavily subsidized.[9]: 62
See also[]
| Wikimedia Commons has media related to Energy in Belarus. |
- Map of Belarusian power grids
- Druzhba pipeline
- 2004 Russia–Belarus gas dispute
- 2007 Russia–Belarus energy dispute
References[]
- ^ a b c d e Belarus energy profile, International Energy Agency, retrieved May 26, 2021
- ^ The Economic Aspects of the Energy Sector in CIS Countries (PDF), European Commission, retrieved May 26, 2021
- ^ a b IEA Key energy statistics 2010 Page: Country specific indicator numbers from page 48
- ^ IEA Key World Energy Statistics Statistics 2015, 2014 (2012R as in November 2015 + 2012 as in March 2014 is comparable to previous years statistical calculation criteria, 2013, 2012, 2011, 2010, 2009 Archived 2013-10-07 at the Wayback Machine, 2006 Archived 2009-10-12 at the Wayback Machine IEA October, crude oil p.11, coal p. 13 gas p. 15
- ^ Установленная мощность, кВт (in Russian)
- ^ "Hot tests completed at Ostrovets unit 1". World Nuclear News. 16 April 2020. Retrieved 3 May 2020.
- ^ IEA statistics: Belarus 1990, archived from the original on 2014
- ^ "How the energy system of Belarus should develop in order to stay beneficial. Forecast". ecoidea.me. Retrieved 2021-12-23.
- ^ "Renewables Readiness Assessment: Belarus". /publications/2021/Jul/Renewables-Readiness-Assessment-Belarus. Retrieved 2021-12-23.
This article may be expanded with text translated from the corresponding article in Russian. (February 2019) Click [show] for important translation instructions.
|
| History |  | ||||
|---|---|---|---|---|---|
| Geography |
| ||||
| Politics |
| ||||
| Economy | |||||
| Society |
| ||||
| Sovereign states |
|  | |||||
|---|---|---|---|---|---|---|---|
| |||||||
Special areas of internal sovereignty |
| ||||||
| |||||||
- Energy in Belarus