Natural gas

Natural gas (also called fossil gas; sometimes just gas) is a naturally occurring hydrocarbon gas mixture consisting of methane and commonly including varying amounts of other higher alkanes, and sometimes a small percentage of carbon dioxide, nitrogen, hydrogen sulfide, or helium.[2] Natural gas is colorless and odorless, and explosive, so a sulfur-smell (similar to rotten eggs) is added for early detection of leaks.[3] Natural gas is formed when layers of decomposing plant and animal matter are exposed to intense heat and pressure under the surface of the Earth over millions of years.[4] The energy that the plants originally obtained from the sun is stored in the form of chemical bonds in the gas.[5] Natural gas is a fossil fuel.
Natural gas is a non-renewable[5] hydrocarbon used as a source of energy for heating, cooking, and electricity generation. It is also used as a fuel for vehicles and as a chemical feedstock in the manufacture of plastics and other commercially important organic chemicals.
The extraction and consumption of natural gas is a major and growing driver of climate change.[6][7][8] It is a potent greenhouse gas itself when released into the atmosphere, and creates carbon dioxide when burnt.[9][10] Natural gas can be efficiently burned to generate heat and electricity, emitting less waste and toxins at the point of use relative to other fossil and biomass fuels.[11] However, gas venting and flaring, along with unintended fugitive emissions throughout the supply chain, can result in a similar carbon footprint overall.[12][13][14]
Natural gas is found in deep underground rock formations or associated with other hydrocarbon reservoirs in coal beds and as methane clathrates. Petroleum is another fossil fuel found close to and with natural gas. Most natural gas was created over time by two mechanisms: biogenic and thermogenic. Biogenic gas is created by methanogenic organisms in marshes, bogs, landfills, and shallow sediments. Deeper in the earth, at greater temperature and pressure, thermogenic gas is created from buried organic material.[15][4]
In petroleum production, gas is sometimes burned as flare gas. Before natural gas can be used as a fuel, most, but not all, must be processed to remove impurities, including water, to meet the specifications of marketable natural gas. The by-products of this processing include ethane, propane, butanes, pentanes, and higher molecular weight hydrocarbons, hydrogen sulfide (which may be converted into pure sulfur), carbon dioxide, water vapor, and sometimes helium and nitrogen.
Natural gas is sometimes informally referred to simply as "gas", especially when it is being compared to other energy sources, such as oil or coal. However, it is not to be confused with gasoline, which is often shortened in colloquial usage to "gas", especially in North America.
History[]
Natural gas was discovered accidentally in ancient China, as it resulted from the drilling for brines. Natural gas was first used by the Chinese in about 500 BC (possibly even 1000 BC[16]). They discovered a way to transport gas seeping from the ground in crude pipelines of bamboo to where it was used to boil salt water to extract the salt in the Ziliujing District of Sichuan.[17][18]
The discovery and identification of natural gas in the Americas happened in 1626. In 1821, William Hart successfully dug the first natural gas well at Fredonia, New York, United States, which led to the formation of the Fredonia Gas Light Company. The city of Philadelphia created the first municipally owned natural gas distribution venture in 1836.[19] By 2009, 66 000 km3 (16,000 cu. mi.) (or 8%) had been used out of the total 850 000 km3 (200,000 cu. mi.) of estimated remaining recoverable reserves of natural gas.[20] Based on an estimated 2015 world consumption rate of about 3400 km3 (815 cu. mi.) of gas per year, the total estimated remaining economically recoverable reserves of natural gas would last 250 years at current consumption rates. An annual increase in usage of 2–3% could result in currently recoverable reserves lasting significantly less, perhaps as few as 80 to 100 years.[20]
Sources[]
Natural gas[]
In the 19th century, natural gas was primarily obtained as a by-product of producing oil. The small, light gas carbon chains came out of solution as the extracted fluids underwent pressure reduction from the reservoir to the surface, similar to uncapping a soft drink bottle where the carbon dioxide effervesces. The gas was often viewed as a by-product, a hazard, and a disposal problem in active oil fields. The large volumes produced could not be utilized until relatively expensive pipeline and storage facilities were constructed to deliver the gas to consumer markets.
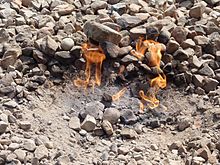
Until the early part of the 20th century, most natural gas associated with oil was either simply released or burned off at oil fields. Gas venting and production flaring are still practised in modern times, but efforts are ongoing around the world to retire them, and to replace them with other commercially viable and useful alternatives.[21][22] Unwanted gas (or stranded gas without a market) is often returned to the reservoir with 'injection' wells while awaiting a possible future market or to re-pressurize the formation, which can enhance oil extraction rates from other wells. In regions with a high natural gas demand (such as the US), pipelines are constructed when it is economically feasible to transport gas from a wellsite to an end consumer.
In addition to transporting gas via pipelines for use in power generation, other end uses for natural gas include export as liquefied natural gas (LNG) or conversion of natural gas into other liquid products via gas to liquids (GTL) technologies. GTL technologies can convert natural gas into liquids products such as gasoline, diesel or jet fuel. A variety of GTL technologies have been developed, including Fischer–Tropsch (F–T), methanol to gasoline (MTG) and syngas to gasoline plus (STG+). F–T produces a synthetic crude that can be further refined into finished products, while MTG can produce synthetic gasoline from natural gas. STG+ can produce drop-in gasoline, diesel, jet fuel and aromatic chemicals directly from natural gas via a single-loop process.[23] In 2011, Royal Dutch Shell's 140,000 barrels (22,000 m3) per day F–T plant went into operation in Qatar.[24]
Natural gas can be "associated" (found in oil fields), or "non-associated" (isolated in natural gas fields), and is also found in coal beds (as coalbed methane).[25] It sometimes contains a significant amount of ethane, propane, butane, and pentane—heavier hydrocarbons removed for commercial use prior to the methane being sold as a consumer fuel or chemical plant feedstock. Non-hydrocarbons such as carbon dioxide, nitrogen, helium (rarely), and hydrogen sulfide must also be removed before the natural gas can be transported.[26]
Natural gas extracted from oil wells is called casinghead gas (whether or not truly produced up the annulus and through a casinghead outlet) or associated gas. The natural gas industry is extracting an increasing quantity of gas from challenging resource types: sour gas, tight gas, shale gas, and coalbed methane.
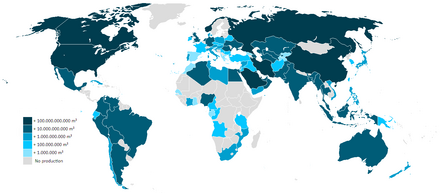
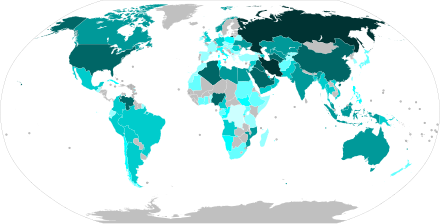
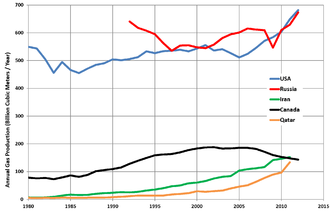
There is some disagreement on which country has the largest proven gas reserves. Sources that consider that Russia has by far the largest proven reserves include the US CIA (47 600 km3),[27] the US Energy Information Administration (47 800 km3),[28][29] and OPEC (48 700 km3).[30] However, BP credits Russia with only 32 900 km3,[31] which would place it in second place, slightly behind Iran (33 100 to 33 800 km3, depending on the source). With Gazprom, Russia is frequently the world's largest natural gas extractor. Major proven resources (in cubic kilometers) are world 187 300 (2013), Iran 33 600 (2013), Russia 32 900 (2013), Qatar 25 100 (2013), Turkmenistan 17 500 (2013) and the United States 8500 (2013).
It is estimated that there are about 900 000 km3 of "unconventional" gas such as shale gas, of which 180 000 km3 may be recoverable.[32] In turn, many studies from MIT, Black & Veatch and the DOE predict that natural gas will account for a larger portion of electricity generation and heat in the future.[33]
The world's largest gas field is the offshore South Pars / North Dome Gas-Condensate field, shared between Iran and Qatar. It is estimated to have 51,000 cubic kilometers (12,000 cu mi) of natural gas and 50 billion barrels (7.9 billion cubic meters) of natural gas condensates.
Because natural gas is not a pure product, as the reservoir pressure drops when non-associated gas is extracted from a field under supercritical (pressure/temperature) conditions, the higher molecular weight components may partially condense upon isothermic depressurizing—an effect called retrograde condensation. The liquid thus formed may get trapped as the pores of the gas reservoir get depleted. One method to deal with this problem is to re-inject dried gas free of condensate to maintain the underground pressure and to allow re-evaporation and extraction of condensates. More frequently, the liquid condenses at the surface, and one of the tasks of the gas plant is to collect this condensate. The resulting liquid is called natural gas liquid (NGL) and has commercial value.
Shale gas[]

Shale gas is natural gas produced from shale. Because shale has matrix permeability too low to allow gas to flow in economical quantities, shale gas wells depend on fractures to allow the gas to flow. Early shale gas wells depended on natural fractures through which gas flowed; almost all shale gas wells today require fractures artificially created by hydraulic fracturing. Since 2000, shale gas has become a major source of natural gas in the United States and Canada.[34] Because of increased shale gas production the United States was in 2014 the number one natural gas producer in the world.[35] The production of shale gas in the United States has been described as a "shale gas revolution" and as "one of the landmark events in the 21st century."[36]
Following the increased production in the United States, shale gas exploration is beginning in countries such as Poland, China, and South Africa.[37][38][39] Chinese geologists have identified the Sichuan Basin as a promising target for shale gas drilling, because of the similarity of shales to those that have proven productive in the United States. Production from the Wei Wei 201 well is 1×10⁴–2×10⁴ m3 per day.[40] In late 2020, China National Petroleum Corporation claimed daily production of 20 million cubic meters of gas from its Changning-Weiyuan demonstration zone.[41]
Town gas[]
Town gas is a flammable gaseous fuel made by the destructive distillation of coal. It contains a variety of calorific gases including hydrogen, carbon monoxide, methane, and other volatile hydrocarbons, together with small quantities of non-calorific gases such as carbon dioxide and nitrogen, and is used in a similar way to natural gas. This is a historical technology and is not usually economically competitive with other sources of fuel gas today.
Most town "gashouses" located in the eastern US in the late 19th and early 20th centuries were simple by-product coke ovens that heated bituminous coal in air-tight chambers. The gas driven off from the coal was collected and distributed through networks of pipes to residences and other buildings where it was used for cooking and lighting. (Gas heating did not come into widespread use until the last half of the 20th century.) The coal tar (or asphalt) that collected in the bottoms of the gashouse ovens was often used for roofing and other waterproofing purposes, and when mixed with sand and gravel was used for paving streets.
Biogas[]
Methanogenic Archaea are responsible for almost all biological sources of methane, though -degrading Bacteria produce an as-yet not fully quantified fraction of biogenic methane, particularly in the oceans.[42] Some live in symbiotic relationships with other life forms, including termites, ruminants, and cultivated crops. Other sources of methane, the principal component of natural gas, include landfill gas, biogas, and methane hydrate. When methane-rich gases are produced by the anaerobic decay of organic matter (biomass), these are referred to as biogas (or natural biogas). Sources of biogas include swamps, marshes, and landfills, as well as agricultural waste materials such as sewage sludge and manure by way of anaerobic digesters,[43] in addition to enteric fermentation, particularly in cattle. Landfill gas is created by decomposition of waste in landfill sites. Excluding water vapor, about half of landfill gas is methane and most of the rest is carbon dioxide, with small amounts of nitrogen, oxygen, and hydrogen, and variable trace amounts of hydrogen sulfide and siloxanes. If the gas is not removed, the pressure may get so high that it works its way to the surface, causing damage to the landfill structure, unpleasant odor, vegetation die-off, and an explosion hazard. The gas can be vented to the atmosphere, flared or burned to produce electricity or heat. Biogas can also be produced by separating organic materials from waste that otherwise goes to landfills. This method is more efficient than just capturing the landfill gas it produces. Anaerobic lagoons produce biogas from manure, while biogas reactors can be used for manure or plant parts. Like landfill gas, biogas is mostly methane and carbon dioxide, with small amounts of nitrogen, oxygen and hydrogen. However, with the exception of pesticides, there are usually lower levels of contaminants.
Landfill gas cannot be distributed through utility natural gas pipelines unless it is cleaned up to less than 3% CO
2, and a few parts per million H
2S, because CO
2 and H
2S corrode the pipelines.[44] The presence of CO
2 will lower the energy level of the gas below requirements for the pipeline.[45][46] Siloxanes in the gas will form deposits in gas burners and need to be removed prior to entry into any gas distribution or transmission system. Consequently, it may be more economical to burn the gas on site or within a short distance of the landfill using a dedicated pipeline. Water vapor is often removed, even if the gas is burned on site. If low temperatures condense water out of the gas, siloxanes can be lowered as well because they tend to condense out with the water vapor. Other non-methane components may also be removed to meet emission standards, to prevent fouling of the equipment or for environmental considerations. Co-firing landfill gas with natural gas improves combustion, which lowers emissions.
Biogas, and especially landfill gas, are already used in some areas, but their use could be greatly expanded. Systems have been established for use in parts of Hertfordshire, UK[47] and Lyon in France.[48] Using materials that would otherwise generate no income, or even cost money to get rid of, improves the profitability and energy balance of biogas production. Gas generated in sewage treatment plants is commonly used to generate electricity. For example, the Hyperion sewage plant in Los Angeles burns 8 million cubic feet (230,000 cubic meters) of gas per day to generate power[49] New York City utilizes gas to run equipment in the sewage plants, to generate electricity, and in boilers.[50] Using sewage gas to make electricity is not limited to large cities. The city of Bakersfield, California, uses cogeneration at its sewer plants.[51] California has 242 sewage wastewater treatment plants, 74 of which have installed anaerobic digesters. The total biopower generation from the 74 plants is about 66 MW.[52]
Crystallized natural gas – hydrates[]
Huge quantities of natural gas (primarily methane) exist in the form of hydrates under sediment on offshore continental shelves and on land in arctic regions that experience permafrost, such as those in Siberia. Hydrates require a combination of high pressure and low temperature to form.
In 2010, the cost of extracting natural gas from crystallized natural gas was estimated to be as much as twice the cost of extracting natural gas from conventional sources, and even higher from offshore deposits.[53]
In 2013, Japan Oil, Gas and Metals National Corporation (JOGMEC) announced that they had recovered commercially relevant quantities of natural gas from methane hydrate.[54]
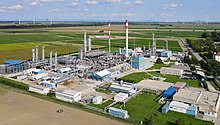
Processing[]
The image below is a schematic block flow diagram of a typical natural gas processing plant. It shows the various unit processes used to convert raw natural gas into sales gas pipelined to the end user markets.
The block flow diagram also shows how processing of the raw natural gas yields byproduct sulfur, byproduct ethane, and natural gas liquids (NGL) propane, butanes and natural gasoline (denoted as pentanes +).[55][56][57][58]

Depletion[]
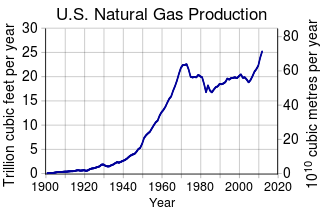
As of mid-2020, natural gas production in the US has peaked three times, with current levels exceeding both previous peaks. It reached 24.1 trillion cubic feet per year in 1973, followed by a decline, and reached 24.5 trillion cubic feet in 2001. After a brief drop, withdrawals increased nearly every year since 2006 (owing to the shale gas boom), with 2017 production at 33.4 trillion cubic feet and 2019 production at 40.7 trillion cubic feet. After the third peak in December 2019, extraction continued to fall from March onward due to decreased demand caused by the COVID-19 pandemic in the US.[59]
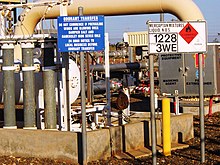
Storage and transport[]

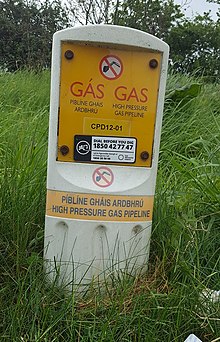
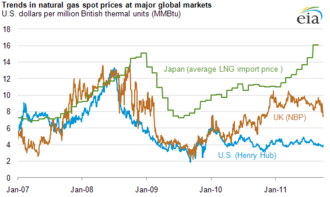
Because of its low density, it is not easy to store natural gas or to transport it by vehicle. Natural gas pipelines are impractical across oceans, since the gas needs to be cooled down and compressed, as the friction in the pipeline causes the gas to heat up. Many existing pipelines in America are close to reaching their capacity, prompting some politicians representing northern states to speak of potential shortages. The large trade cost implies that natural gas markets are globally much less integrated, causing significant price differences across countries. In Western Europe, the gas pipeline network is already dense.[61][better source needed][full citation needed] New pipelines are planned or under construction in Eastern Europe and between gas fields in Russia, Near East and Northern Africa and Western Europe.
Whenever gas is bought or sold at custody transfer points, rules and agreements are made regarding the gas quality. These may include the maximum allowable concentration of CO
2, H
2S and H
2O. Usually sales quality gas that has been treated to remove contamination is traded on a "dry gas" basis and is required to be commercially free from objectionable odours, materials, and dust or other solid or liquid matter, waxes, gums and gum forming constituents, which might damage or adversely affect operation of equipment downstream of the custody transfer point.
LNG carriers transport liquefied natural gas (LNG) across oceans, while tank trucks can carry liquefied or compressed natural gas (CNG) over shorter distances.[62] Sea transport using CNG carrier ships that are now under development may be competitive with LNG transport in specific conditions.
Gas is turned into liquid at a liquefaction plant, and is returned to gas form at regasification plant at the terminal. Shipborne regasification equipment is also used. LNG is the preferred form for long distance, high volume transportation of natural gas, whereas pipeline is preferred for transport for distances up to 4,000 km (2,500 mi) over land and approximately half that distance offshore.
CNG is transported at high pressure, typically above 200 bars (20,000 kPa; 2,900 psi). Compressors and decompression equipment are less capital intensive and may be economical in smaller unit sizes than liquefaction/regasification plants. Natural gas trucks and carriers may transport natural gas directly to end-users, or to distribution points such as pipelines.

In the past, the natural gas which was recovered in the course of recovering petroleum could not be profitably sold, and was simply burned at the oil field in a process known as flaring. Flaring is now illegal in many countries.[63] Additionally, higher demand in the last 20–30 years has made production of gas associated with oil economically viable. As a further option, the gas is now sometimes re-injected into the formation for enhanced oil recovery by pressure maintenance as well as miscible or immiscible flooding. Conservation, re-injection, or flaring of natural gas associated with oil is primarily dependent on proximity to markets (pipelines), and regulatory restrictions.
Natural gas can be indirectly exported through the absorption in other physical output. A recent study suggests that the expansion of shale gas production in the US has caused prices to drop relative to other countries. This has caused a boom in energy intensive manufacturing sector exports, whereby the average dollar unit of US manufacturing exports has almost tripled its energy content between 1996 and 2012.[64]
A "master gas system" was invented in Saudi Arabia in the late 1970s, ending any necessity for flaring. Satellite observation, however, shows that flaring[65][66][67][68] and venting[citation needed] are still practiced in some gas-extracting countries.
Natural gas is used to generate electricity and heat for desalination. Similarly, some landfills that also discharge methane gases have been set up to capture the methane and generate electricity.
Natural gas is often stored underground inside depleted gas reservoirs from previous gas wells, salt domes, or in tanks as liquefied natural gas. The gas is injected in a time of low demand and extracted when demand picks up. Storage nearby end users helps to meet volatile demands, but such storage may not always be practicable.
With 15 countries accounting for 84% of the worldwide extraction, access to natural gas has become an important issue in international politics, and countries vie for control of pipelines.[69] In the first decade of the 21st century, Gazprom, the state-owned energy company in Russia, engaged in disputes with Ukraine and Belarus over the price of natural gas, which have created concerns that gas deliveries to parts of Europe could be cut off for political reasons.[70] The United States is preparing to export natural gas.[71]
Floating liquefied natural gas[]
Floating liquefied natural gas (FLNG) is an innovative technology designed to enable the development of offshore gas resources that would otherwise remain untapped due to environmental or economic factors which currently make them impractical to develop via a land-based LNG operation. FLNG technology also provides a number of environmental and economic advantages:
- Environmental – Because all processing is done at the gas field, there is no requirement for long pipelines to shore, compression units to pump the gas to shore, dredging and jetty construction, and onshore construction of an LNG processing plant, which significantly reduces the environmental footprint.[72] Avoiding construction also helps preserve marine and coastal environments. In addition, environmental disturbance will be minimised during decommissioning because the facility can easily be disconnected and removed before being refurbished and re-deployed elsewhere.
- Economic – Where pumping gas to shore can be prohibitively expensive, FLNG makes development economically viable. As a result, it will open up new business opportunities for countries to develop offshore gas fields that would otherwise remain stranded, such as those offshore East Africa.[73]
Many gas and oil companies are considering the economic and environmental benefits of floating liquefied natural gas (FLNG). There are currently projects underway to construct five FLNG facilities. Petronas is close to completion on their FLNG-1[74] at Daewoo Shipbuilding and Marine Engineering and are underway on their FLNG-2 project[75] at Samsung Heavy Industries. Shell Prelude is due to start production 2017.[76] The Browse LNG project will commence FEED in 2019.[77]
Uses[]
Natural gas is primarily used in the northern hemisphere. North America and Europe are major consumers.
Mid-stream natural gas[]
Often well head gases require removal of various hydrocarbon molecules contained within the gas. Some of these gases include heptane, pentane, propane and other hydrocarbons with molecular weights above methane (CH
4). The natural gas transmission lines extend to the natural gas processing plant or unit which removes the higher molecular weighted hydrocarbons to produce natural gas with energy content between 950–1,050 British thermal units per cubic foot (35–39 MJ/m3). The processed natural gas may then be used for residential, commercial and industrial uses.
Natural gas flowing in the distribution lines is called mid-stream natural gas and is often used to power engines which rotate compressors. These compressors are required in the transmission line to pressurize and repressurize the mid-stream natural gas as the gas travels. Typically, natural gas powered engines require 950–1,050 BTU/cu ft (35–39 MJ/m3) natural gas to operate at the rotational name plate specifications.[78] Several methods are used to remove these higher molecular weighted gases for use by the natural gas engine. A few technologies are as follows:
- Joule–Thomson skid
- Cryogenic or chiller system
- Chemical enzymology system[78]
Power generation[]
Natural gas is a major source of electricity generation through the use of cogeneration, gas turbines and steam turbines. Natural gas is also well suited for a combined use in association with renewable energy sources such as wind or solar[79] and for alimenting[clarification needed] peak-load power stations functioning in tandem with hydroelectric plants.[citation needed] Most grid peaking power plants and some off-grid engine-generators use natural gas. Particularly high efficiencies can be achieved through combining gas turbines with a steam turbine in combined cycle mode. Natural gas burns more cleanly than other fuels, such as oil and coal. Because burning natural gas produces both water and carbon dioxide, it produces less carbon dioxide per unit of energy released than coal, which produces mostly carbon dioxide. Burning natural gas produces only about half the carbon dioxide per kilowatt-hour (kWh) that coal does.[80] For transportation, burning natural gas produces about 30% less carbon dioxide than burning petroleum. The US Energy Information Administration reports the emissions in million metric tons of carbon dioxide in the world for 2012:[81][clarification needed]
- Natural gas: 6,799
- Petroleum: 11,695
- Coal: 13,787
Coal-fired electric power generation emits around 2,000 pounds (900 kg) of carbon dioxide for every megawatt-hour (MWh) generated, which is almost double the carbon dioxide released by natural gas-fired generation.[82] Because of this higher carbon efficiency of natural gas generation, as the fuel mix in the United States has changed to reduce coal and increase natural gas generation, carbon dioxide emissions have unexpectedly fallen. Those measured in the first quarter of 2012 were the lowest of any recorded for the first quarter of any year since 1992.[83]
Combined cycle power generation using natural gas is currently the cleanest available source of power using hydrocarbon fuels, and this technology is widely and increasingly used as natural gas can be obtained at increasingly reasonable costs. Fuel cell technology may eventually provide cleaner options for converting natural gas into electricity, but as yet it is not price-competitive. Locally produced electricity and heat using natural gas powered Combined Heat and Power plant (CHP or Cogeneration plant) is considered energy efficient and a rapid way to cut carbon emissions.[84]
Natural gas generated power has increased from 740 TWh in 1973 to 5140 TWh in 2014, generating 22% of the worlds total electricity. Approximately half as much as generated with coal.[85][verification needed][full citation needed] Efforts around the world to reduce the use of coal has led some regions to switch to natural gas.
Domestic use[]
Natural gas dispensed in a residential setting can generate temperatures in excess of 1,100 °C (2,000 °F) making it a powerful domestic cooking and heating fuel.[86] In much of the developed world it is supplied through pipes to homes, where it is used for many purposes including ranges and ovens, gas-heated clothes dryers, heating/cooling, and central heating.[87] Heaters in homes and other buildings may include boilers, furnaces, and water heaters. Both North America and Europe are major consumers of natural gas.
Domestic appliances, furnaces, and boilers use low pressure, usually 6 to 7 inches of water (6" to 7" WC), which is about 0.25 psig. The pressures in the supply lines vary, either utilization pressure (UP, the aforementioned 6" to 7" WC) or elevated pressure (EP), which may be anywhere from 1 psig to 120 psig. Systems using EP have a regulator at the service entrance to step down the pressure to UP.[citation needed]
In Australia, natural gas is transported from gas processing facilities to regulator stations via Transmission pipelines. Gas is then regulated down to distributed pressures and the gas is distributed around a gas network via gas mains. Small branches from the network, called services, connect individual domestic dwellings, or multi-dwelling buildings to the network. The networks typically range in pressures from 7 kPa (low pressure) to 515 kPa (high pressure). Gas is then regulated down to 1.1 kPa or 2.75 kPa, before being metered and passed to the consumer for domestic use.[88] Natural gas mains are made from a variety of materials: historically cast iron, though more modern mains are made from steel or polyethylene.
In the US compressed natural gas (CNG) is available in some rural areas as an alternative to less expensive and more abundant LPG (liquefied petroleum gas), the dominant source of rural gas. It is used in homes lacking direct connections to public utility provided gas, or to fuel portable grills. Natural gas is also supplied by independent natural gas suppliers through Natural Gas Choice programs[clarification needed] throughout the United States.

Transportation[]
CNG is a cleaner and also cheaper alternative to other automobile fuels such as gasoline (petrol).[89] By the end of 2014, there were over 20 million natural gas vehicles worldwide, led by Iran (3.5 million), China (3.3 million), Pakistan (2.8 million), Argentina (2.5 million), India (1.8 million), and Brazil (1.8 million).[90] The energy efficiency is generally equal to that of gasoline engines, but lower compared with modern diesel engines. Gasoline/petrol vehicles converted to run on natural gas suffer because of the low compression ratio of their engines, resulting in a cropping of delivered power while running on natural gas (10–15%). CNG-specific engines, however, use a higher compression ratio due to this fuel's higher octane number of 120–130.[91]
Besides use in road vehicles, CNG can also be used in aircraft.[92] Compressed natural gas has been used in some aircraft like the Aviat Aircraft Husky 200 CNG[93] and the Chromarat VX-1 KittyHawk[94]
LNG is also being used in aircraft. Russian aircraft manufacturer Tupolev for instance is running a development program to produce LNG- and hydrogen-powered aircraft.[95] The program has been running since the mid-1970s, and seeks to develop LNG and hydrogen variants of the Tu-204 and Tu-334 passenger aircraft, and also the Tu-330 cargo aircraft. Depending on the current market price for jet fuel and LNG, fuel for an LNG-powered aircraft could cost 5,000 rubles (US$100) less per tonne, roughly 60%, with considerable reductions to carbon monoxide, hydrocarbon and nitrogen oxide emissions.
The advantages of liquid methane as a jet engine fuel are that it has more specific energy than the standard kerosene mixes do and that its low temperature can help cool the air which the engine compresses for greater volumetric efficiency, in effect replacing an intercooler. Alternatively, it can be used to lower the temperature of the exhaust.
Fertilizers[]
Natural gas is a major feedstock for the production of ammonia, via the Haber process, for use in fertilizer production.[87]
Hydrogen[]
Natural gas can be used to produce hydrogen, with one common method being the hydrogen reformer. Hydrogen has many applications: it is a primary feedstock for the chemical industry, a hydrogenating agent, an important commodity for oil refineries, and the fuel source in hydrogen vehicles.
Animal and fish feed[]
Protein rich animal and fish feed is produced by feeding natural gas to Methylococcus capsulatus bacteria on commercial scale.[96][97][98]
Other[]
Natural gas is also used in the manufacture of fabrics, glass, steel, plastics, paint, synthetic oil, and other products.[99] The first step in the valorization of natural gas components is usually the[clarification needed] of the alkane into olefin. The oxidative dehydrogenation of ethane leads to ethylene which can be converted forther to ethylene epoxide, ethylene glycol, acetaldehyde[100] or other olefins.[101] Propane can be converted to propylene[102][103] or can be oxidized to acrylic acid[104][105][106] and acrylonitrile.
Environmental effects[]
Greenhouse gas effect of natural gas release[]

Human activity is responsible for about 60% of all methane emissions and for most of the resulting increase in atmospheric methane.[108][109][110] Natural gas is intentionally released or is otherwise known to leak during the extraction, storage, transportation, and distribution of fossil fuels. Globally, this accounts for an estimated 33% of anthropogenic greenhouse gas warming.[111] The decomposition of municipal solid waste (a source of landfill gas) and wastewater account for an additional 18% of such emissions. These estimates include substantial uncertainties[112] which should be reduced in the near future with improved satellite measurements, such as those planned for MethaneSAT.[10]
After release to the atmosphere, methane is removed by gradual oxidation to carbon dioxide and water by hydroxyl radicals (OH−
) formed in the troposphere or stratosphere, giving the overall chemical reaction CH
4 + 2O
2 → CO
2 + 2H
2O.[113][114] While the lifetime of atmospheric methane is relatively short when compared to carbon dioxide,[115] with a half-life of about 7 years, it is more efficient at trapping heat in the atmosphere, so that a given quantity of methane has 84 times the global-warming potential of carbon dioxide over a 20-year period and 28 times over a 100-year period. Natural gas is thus a potent greenhouse gas due to the strong radiative forcing of methane in the short term, and the continuing effects of carbon dioxide in the longer term.[110]
Targeted efforts to reduce warming quickly by reducing anthropogenic methane emissions is a climate change mitigation strategy supported by the Global Methane Initiative.[111]
Greenhouse gas emissions[]
When refined and burned, natural gas can produce 25–30% less carbon dioxide per joule delivered than oil, and 40–45% less than coal.[80] It can also produce potentially fewer toxic pollutants than other hydrocarbon fuels.[80][116] However, compared to other major fossil fuels, natural gas causes more emissions in relative terms during the production and transportation of the fuel, meaning that the life cycle greenhouse gas emissions are about 47 % higher than the direct emissions from the site of consumption.[117]
In terms of the warming effect over 100 years, natural gas production and use comprises about one fifth of human greenhouse gas emissions, and this contribution is growing rapidly. Globally, natural gas use emitted about 7.8 billion tons of CO
2 in 2018 (including flaring), while coal and oil use emitted 14.7 and 12.4 billion tons, respectively.[118] In 2019 45 megatonnes of methane was released.[119] According to an updated version of the Special Report on Emissions Scenario, by 2030 natural gas would be the source of 11 billion tons a year because demand is increasing 1.9% per year.[120]
The continued financing and construction of new gas pipelines indicates that huge emissions of fossil greenhouse gases could be locked-in for 40 to 50 years into the future.[121] In the U.S. state of Texas alone, five new long-distance gas pipelines have been under construction, with the first entering service in 2019,[122] and the others scheduled to come online during 2020–2022.[123]:23
To reduce its greenhouse emissions, the Netherlands is subsidizing a transition away from natural gas for all homes in the country by 2050. In Amsterdam, no new residential gas accounts have been allowed since 2018, and all homes in the city are expected to be converted by 2040 to use the excess heat from adjacent industrial buildings and operations.[124] Some cities in the United States have started prohibiting gas hookups for new houses, with state laws passed and under consideration to either require electrification or prohibit local requirements.[125] The UK government is also experimenting with alternative home heating technologies to meet its climate goals.[126] To preserve their businesses, natural gas utilities in the United States have been lobbying for laws preventing local electrification ordinances, and are promoting renewable natural gas and hydrogen fuel.[127]
Other pollutants[]
Natural gas produces far lower amounts of sulfur dioxide and nitrogen oxides than other fossil fuels.[116] The pollutants due to natural gas combustion are listed below:[80][128]
| Pollutant (lb/million Btu)[80] | NG | Oil | Coal |
|---|---|---|---|
| Carbon dioxide | 117 | 164 | 208 |
| Carbon monoxide | 0.040 | 0.033 | 0.208 |
| Sulfur dioxide | 0.001 | 1.122 | 2.591 |
| Nitrogen oxides | 0.092 | 0.448 | 0.457 |
| Particulates | 0.007 | 0.084 | 2.744 |
| Mercury | 0 | 0.000007 | 0.000016 |
Radionuclides[]
Natural gas extraction also produces radioactive isotopes of polonium (Po-210), lead (Pb-210) and radon (Rn-220). Radon is a gas with initial activity from 5 to 200,000 becquerels per cubic meter of gas. It decays rapidly to Pb-210 which can build up as a thin film in gas extraction equipment.[129]
Safety concerns[]
The natural gas extraction workforce face unique health and safety challenges and is recognized by the National Institute for Occupational Safety and Health (NIOSH) as a priority industry sector in the National Occupational Research Agenda (NORA) to identify and provide intervention strategies regarding occupational health and safety issues.[130][131]
Production[]
Some gas fields yield sour gas containing hydrogen sulfide (H
2S), a toxic compound when inhaled. Amine gas treating, an industrial scale process which removes acidic gaseous components, is often used to remove hydrogen sulfide from natural gas.[132]
Extraction of natural gas (or oil) leads to decrease in pressure in the reservoir. Such decrease in pressure in turn may result in subsidence, sinking of the ground above. Subsidence may affect ecosystems, waterways, sewer and water supply systems, foundations, and so on.[133]
Fracking[]
Releasing natural gas from subsurface porous rock formations may be accomplished by a process called hydraulic fracturing or "fracking". It is estimated[by whom?] that hydraulic fracturing will eventually[when?] account for nearly 70% of natural gas development in North America.[134][non-primary source needed] Since the first commercial hydraulic fracturing operation in 1949, approximately one million wells have been hydraulically fractured in the United States.[135] The production of natural gas from hydraulically fractured wells has utilized the technological developments of directional and horizontal drilling, which improved access to natural gas in tight rock formations.[136] Strong growth in the production of unconventional gas from hydraulically fractured wells occurred between 2000 and 2012.[137]
In hydraulic fracturing, well operators force water mixed with a variety of chemicals through the wellbore casing into the rock. The high pressure water breaks up or "fracks" the rock, which releases gas from the rock formation. Sand and other particles are added to the water as a proppant to keep the fractures in the rock open, thus enabling the gas to flow into the casing and then to the surface. Chemicals are added to the fluid to perform such functions as reducing friction and inhibiting corrosion. After the "frack," oil or gas is extracted and 30–70% of the frack fluid, i.e. the mixture of water, chemicals, sand, etc., flows back to the surface. Many gas-bearing formations also contain water, which will flow up the wellbore to the surface along with the gas, in both hydraulically fractured and non-hydraulically fractured wells. This produced water often has a high content of salt and other dissolved minerals that occur in the formation.[138]
The volume of water used to hydraulically fracture wells varies according to the hydraulic fracturing technique. In the United States, the average volume of water used per hydraulic fracture has been reported as nearly 7,375 gallons for vertical oil and gas wells prior to 1953, nearly 197,000 gallons for vertical oil and gas wells between 2000 and 2010, and nearly 3 million gallons for horizontal gas wells between 2000 and 2010.[139]
Determining which fracking technique is appropriate for well productivity depends largely on the properties of the reservoir rock from which to extract oil or gas. If the rock is characterized by low-permeability – which refers to its ability to let substances, i.e. gas, pass through it, then the rock may be considered a source of tight gas.[140] Fracking for shale gas, which is currently also known as a source of unconventional gas, involves drilling a borehole vertically until it reaches a lateral shale rock formation, at which point the drill turns to follow the rock for hundreds or thousands of feet horizontally.[141] In contrast, conventional oil and gas sources are characterized by higher rock permeability, which naturally enables the flow of oil or gas into the wellbore with less intensive hydraulic fracturing techniques than the production of tight gas has required.[142][143] The decades in development of drilling technology for conventional and unconventional oil and gas production has not only improved access to natural gas in low-permeability reservoir rocks, but also posed significant adverse impacts on environmental and public health.[144][145][146][147]
The US EPA has acknowledged that toxic, carcinogenic chemicals, i.e. benzene and ethylbenzene, have been used as gelling agents in water and chemical mixtures for high volume horizontal fracturing (HVHF).[148] Following the hydraulic fracture in HVHF, the water, chemicals, and frack fluid that return to the well's surface, called flowback or produced water, may contain radioactive materials, heavy metals, natural salts, and hydrocarbons which exist naturally in shale rock formations.[149] Fracking chemicals, radioactive materials, heavy metals, and salts that are removed from the HVHF well by well operators are so difficult to remove from the water they're mixed with, and would so heavily pollute the water cycle, that most of the flowback is either recycled into other fracking operations or injected into deep underground wells, eliminating the water that HVHF required from the hydrologic cycle.[150]
Historically low gas prices have delayed the nuclear renaissance, as well as the development of solar thermal energy.[citation needed]
Added odor[]
Natural gas in its native state is colorless and almost odorless. In order to assist consumers in detecting leaks, an odorizer with a scent similar to rotten eggs, tert-Butylthiol (t-butyl mercaptan), is added. Sometimes a related compound, thiophane, may be used in the mixture. Situations in which an odorant that is added to natural gas can be detected by analytical instrumentation, but cannot be properly detected by an observer with a normal sense of smell, have occurred in the natural gas industry. This is caused by odor masking, when one odorant overpowers the sensation of another. As of 2011, the industry is conducting research on the causes of odor masking.[151]
Risk of explosion[]
Explosions caused by natural gas leaks occur a few times each year. Individual homes, small businesses and other structures are most frequently affected when an internal leak builds up gas inside the structure. Frequently, the blast is powerful enough to significantly damage a building but leave it standing. In these cases, the people inside tend to have minor to moderate injuries. Occasionally, the gas can collect in high enough quantities to cause a deadly explosion, destroying one or more buildings in the process. Many building codes now forbid the installation of gas pipes inside cavity walls or below floor boards to mitigate against this risk. Gas usually dissipates readily outdoors, but can sometimes collect in dangerous quantities if flow rates are high enough. From 1994 through 2013, the United States had 745 serious incidents with gas distribution, causing 278 fatalities and 1,059 injuries, with $110,658,083 in property damage.[152] However, considering the tens of millions of structures that use the fuel, the individual risk of using natural gas is low.
Risk of carbon monoxide inhalation[]
Natural gas heating systems may cause carbon monoxide poisoning if unvented or poorly vented. In 2011, natural gas furnaces, space heaters, water heaters and stoves were blamed for 11 carbon monoxide deaths in the US. Another 22 deaths were attributed to appliances running on liquified petroleum gas, and 17 deaths on gas of unspecified type. Improvements in natural gas furnace designs have greatly reduced CO poisoning concerns. Detectors are also available that warn of carbon monoxide or explosive gases such as methane and propane.[153]
Energy content, statistics, and pricing[]
Quantities of natural gas are measured in normal cubic meters (cubic meter of gas at "normal" temperature 0 °C (32 °F) and pressure 101.325 kPa (14.6959 psi)) or standard cubic feet (cubic foot of gas at "standard" temperature 60.0 °F (15.6 °C) and pressure 14.73 psi (101.6 kPa)), one cubic meter ≈ 35.3147 cu ft. The gross heat of combustion of commercial quality natural gas is around 39 MJ/m3 (0.31 kWh/cu ft), but this can vary by several percent. This is about 49 MJ/kg (6.2 kWh/lb) (assuming a density of 0.8 kg/m3 (0.05 lb/cu ft),[154] an approximate value).
Except in the European Union, the U.S., and Canada, natural gas is sold in gigajoule retail units. LNG (liquefied natural gas) and LPG (liquefied petroleum gas) are traded in metric tonnes (1,000 kg) or million BTU as spot deliveries. Long term natural gas distribution contracts are signed in cubic meters, and LNG contracts are in metric tonnes. The LNG and LPG is transported by specialized transport ships, as the gas is liquified at cryogenic temperatures. The specification of each LNG/LPG cargo will usually contain the energy content, but this information is in general not available to the public.
In the Russian Federation, Gazprom sold approximately 250 billion cubic meters (8.8 trillion cubic feet) of natural gas in 2008. In 2013 they produced 487.4 billion cubic meters (17.21 trillion cubic feet) of natural and associated gas. Gazprom supplied Europe with 161.5 billion cubic meters (5.70 trillion cubic feet) of gas in 2013.
In August 2015, possibly the largest natural gas discovery in history was made and notified by an Italian gas company ENI. The energy company indicated that it has unearthed a "supergiant" gas field in the Mediterranean Sea covering about 40 square miles (100 km2). This was named the Zohr gas field and could hold a potential 30 trillion cubic feet (850 billion cubic meters) of natural gas. ENI said that the energy is about 5.5 billion barrels of oil equivalent [BOE] (3.4×10¹⁰ GJ). The Zohr field was found in the deep waters off the northern coast of Egypt and ENI claims that it will be the largest ever in the Mediterranean and even the world.[155]
European Union[]
Gas prices for end users vary greatly across the EU.[156] A single European energy market, one of the key objectives of the EU, should level the prices of gas in all EU member states. Moreover, it would help to resolve supply and global warming issues,[157] as well as strengthen relations with other Mediterranean countries and foster investments in the region.[158]
United States[]
In US units, one standard cubic foot (28 L) of natural gas produces around 1,028 British thermal units (1,085 kJ). The actual heating value when the water formed does not condense is the net heat of combustion and can be as much as 10% less.[159]
In the United States, retail sales are often in units of therms (th); 1 therm = 100,000 BTU. Gas sales to domestic consumers are often in units of 100 standard cubic feet (scf). Gas meters measure the volume of gas used, and this is converted to therms by multiplying the volume by the energy content of the gas used during that period, which varies slightly over time. The typical annual consumption of a single family residence is 1,000 therms or one Residential Customer Equivalent (RCE). Wholesale transactions are generally done in decatherms (Dth), thousand decatherms (MDth), or million decatherms (MMDth). A million decatherms is a trillion BTU, roughly a billion cubic feet of natural gas.
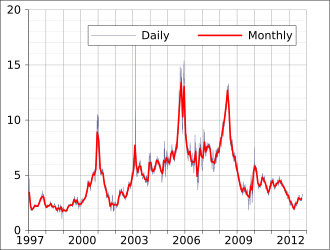
The price of natural gas varies greatly depending on location and type of consumer. In 2007, a price of $7 per 1000 cubic feet ($0.25/m3) was typical in the United States. The typical caloric value of natural gas is roughly 1,000 BTU per cubic foot, depending on gas composition. This corresponds to around $7 per million BTU or around $7 per gigajoule (GJ). In April 2008, the wholesale price was $10 per 1000 cubic feet ($10/million BTU).[160] The residential price varies from 50% to 300% more than the wholesale price. At the end of 2007, this was $12–$16 per 1000 cubic feet ($0.42–$0.57/m3).[161] Natural gas in the United States is traded as a futures contract on the New York Mercantile Exchange. Each contract is for 10,000 million BTU or 10 billion BTU (10,551 GJ). Thus, if the price of gas is $10/million BTU on the NYMEX, the contract is worth $100,000.
Canada[]
Canada uses metric measure for internal trade of petrochemical products. Consequently, natural gas is sold by the gigajoule (GJ), cubic meter (m3) or thousand cubic meters (E3m3). Distribution infrastructure and meters almost always meter volume (cubic foot or cubic meter). Some jurisdictions, such as Saskatchewan, sell gas by volume only. Other jurisdictions, such as Alberta, gas is sold by the energy content (GJ). In these areas, almost all meters for residential and small commercial customers measure volume (m3 or ft3), and billing statements include a multiplier to convert the volume to energy content of the local gas supply.
A gigajoule (GJ) is a measure approximately equal to half a barrel (250 lbs) of oil, or 1 million BTUs, or 1,000 cu ft or 28 m3 of gas. The energy content of gas supply in Canada can vary from 37 to 43 MJ/m3 (990 to 1,150 BTU/cu ft) depending on gas supply and processing between the wellhead and the customer.
As an asset class for investors[]
Research conducted by the World Pensions Council (WPC)[when?] suggests that large US and Canadian pension funds and Asian and MENA area SWF investors have become particularly active in the fields of natural gas and natural gas infrastructure, a trend started in 2005 by the formation of Scotia Gas Networks in the UK by OMERS and Ontario Teachers' Pension Plan.[citation needed]
Adsorbed natural gas (ANG)[]
Natural gas may be stored by adsorbing it to the porous solids called sorbents. The optimal condition for methane storage is at room temperature and atmospheric pressure. Pressures up to 4 MPa (about 40 times atmospheric pressure) will yield greater storage capacity. The most common sorbent used for ANG is activated carbon (AC), primarily in three forms: Activated Carbon Fiber (ACF), Powdered Activated Carbon (PAC), and activated carbon monolith.[162]
See also[]
- Associated petroleum gas
- Energy transition
- Gas oil ratio
- Natural gas by country
- Peak gas
- Power to gas
- Renewable natural gas
- World energy resources and consumption
References[]
- ^ "Natural Gas – Exports". The World Factbook. Central Intelligence Agency. Retrieved 11 June 2015.
- ^ "Background". Naturalgas.org. Archived from the original on 9 July 2014. Retrieved 14 July 2012.
- ^ "Why Does Natural Gas Smell Like Rotten Eggs? | Metropolitan Utilities District".
- ^ Jump up to: a b "Natural gas explained". U.S. Energy Information Administration. Retrieved 30 September 2020.
- ^ Jump up to: a b "Electricity from Natural Gas". Archived from the original on 6 June 2014. Retrieved 10 November 2013.
- ^ Valerie Volcovici, Kate Abnett, and Matthew Green (18 August 2020). "Cleaner but not clean - Why scientists say natural gas won't avert climate disaster". Reuters.CS1 maint: multiple names: authors list (link)
- ^ "Data and Statistics: CO2 emissions by energy source, World 1990-2017". International Energy Agency (Paris). Retrieved 24 April 2020.
- ^ Hannah Ritchie and Max Roser (2020). "CO₂ and Greenhouse Gas Emissions: CO₂ Emissions by Fuel". Our World in Data. Published online at OurWorldInData.org. Retrieved 24 April 2020.
- ^ "Why carbon dioxide isn't the only greenhouse gas we must reduce – Dr Richard Dixon". www.scotsman.com. Retrieved 17 August 2020.
- ^ Jump up to: a b "Methane Emissions in the Oil and Gas Industry". American Geosciences Institute. 16 May 2018. Retrieved 1 May 2019.
- ^ "Natural gas and the environment". U.S. Energy Information Administration. Retrieved 30 September 2020.
- ^ Moniz, E.J. (2011). "The Future of Natural Gas: An Interdisciplinary MIT Study". MIT Press. Retrieved 8 January 2020. Cite journal requires
|journal=(help) - ^ Howarth, R.W. (2014). "A bridge to nowhere: methane emissions and the greenhouse gas footprint of natural gas" (PDF). Energy Science & Engineering. Society of Chemical Industry and John Wiley & Sons Ltd. 2 (2): 47–60. doi:10.1002/ese3.35.
- ^ Adam Voiland and Joshua Stevens (8 March 2016). "Methane Matters". NASA Earth Observatory. Retrieved 15 September 2020.
- ^ "Organic Origins of Petroleum". US Geological Survey. Archived from the original on 27 May 2010.
- ^ Eric & Chun-Chih Hadley-Ives. "First Oil Wells". www.historylines.net.CS1 maint: uses authors parameter (link)
- ^ "History". NaturalGas.org. Retrieved 1 December 2016.
- ^ Abbott, Malcolm (2016). The Economics of the Gas Supply Industry. Routledge. p. 185. ISBN 978-1-138-99879-7.
- ^ "A Brief History of Natural Gas - APGA". www.apga.org. Retrieved 18 February 2019.
- ^ Jump up to: a b "World Energy Outlook 2009" (PDF). International Energy Agency. 2009.
- ^ "Global Gas Flaring Reduction Partnership". United Nations. Retrieved 29 December 2019.
- ^ "UN Climate Initiatives Platform - Zero Routine Flaring by 2030". United Nations. Retrieved 29 December 2019.
- ^ "Introduction to STG+ Technology". Primus Green Energy. February 2013. Retrieved 5 March 2013.
- ^ "First cargo of Pearl GTL products ship from Qatar". Shell Global. 13 June 2011. Retrieved 19 November 2017.
- ^ "Extraction". NaturalGas.org. Archived from the original on 8 July 2013.
- ^ "Natural gas overview". Naturalgas.org. Archived from the original on 1 January 2011. Retrieved 6 February 2011.
- ^ "Natural Gas – Proved Reserves". The World Factbook. Central Intelligence Agency. Retrieved 1 December 2013.
- ^ US Energy Information Administration, International statistics, accessed 1 December 2013.
- ^ "U.S. Crude Oil, Natural Gas, and Natural Gas Proved Reserves, Year-end 2017". www.eia.gov. Retrieved 26 August 2019.
- ^ "Table 3.2 – World Proven Natural Gas Reserves by Country". OPEC. Archived from the original on 27 February 2018. Retrieved 1 December 2013.
- ^ "BP Statistical Review of World Energy June 2013" (PDF). BP. Archived from the original (PDF) on 4 December 2013.
- ^ Helen Knight (12 June 2010). "Wonderfuel: Welcome to the age of unconventional gas". New Scientist. pp. 44–47.
- ^ Michael Kanellos (9 June 2011). "In Natural Gas, U.S. Will Move From Abundance to Imports". Greentech Media.
- ^ Mouawad, Jad (17 June 2009). "Estimate places natural gas reserves 35% higher". The New York Times. Retrieved 25 October 2009.
- ^ Morris Beschloss (2 September 2014). "U.S. Now World's Leading Natural Gas Producer". Desert Sun. Retrieved 4 November 2014.
- ^ Wang, Qiang; Chen, Xi; Jha, Awadhesh N.; Rogers, Howard (February 2014). "Natural gas from shale formation – The evolution, evidences and challenges of shale gas revolution in United States". Renewable and Sustainable Energy Reviews. 30: 1–28. doi:10.1016/j.rser.2013.08.065.
- ^ "Poland Seeks to Boost Shale Gas Industry". Financial Times. 2012. Retrieved 18 October 2012.
- ^ Catherine T. Yang (9 August 2012). "China Drills into Shale Gas, Targeting Huge Reserves Amid Challenges". National Geographic. Retrieved 18 October 2012.
- ^ Franz Wild; Andres R. Martinez (7 September 2012). "South Africa Allows Exploration of Shale Gas Resources". Bloomberg.com. Retrieved 18 October 2012.
- ^ Zou, Caineng; Dong, Dazhong; Wang, Shejiao; Li, Jianzhong; Li, Xinjing; Wang, Yuman; Li, Denghua; Cheng, Keming (December 2010). "Geological characteristics and resource potential of shale gas in China". Petroleum Exploration and Development. 37 (6): 641–653. doi:10.1016/S1876-3804(11)60001-3.
- ^ "Shale gas production soars in SW China base". China Daily Information Co. ChinaDaily.com.cn. 13 October 2020. Retrieved 2 December 2020.
- ^ DM Karl, L Beversdorf, KM Björkman, MJ Church, A Martinez, EF DeLong (2008). "Aerobic production of methane in the sea". Nature Geoscience. 1 (7): 473–478. Bibcode:2008NatGe...1..473K. doi:10.1038/ngeo234.CS1 maint: multiple names: authors list (link)
- ^ David Schmidt. "Anaerobic Digestion Overview" (PDF). University of Minnesota. Retrieved 19 November 2017.
- ^ "Interstate Natural Gas—Quality Specifications & Interchangeability" (PDF). Archived from the original (PDF) on 12 August 2011. Retrieved 6 February 2011.
- ^ "Reading: Natural Gas | Geology". courses.lumenlearning.com. Retrieved 26 August 2019.
- ^ Speight, James G. (14 August 2018). Handbook of Natural Gas Analysis. John Wiley & Sons. ISBN 9781119240280.
- ^ "Biogen Opens 45,000 TPA Food Waste to Biogas Plant in Hertfordshire, UK". 6 February 2015.
- ^ "Biogas co-generation in a greenhouse complex".
- ^ "Hyperion Treatment Plant". LA Sewers. Archived from the original on 12 October 2011. Retrieved 6 February 2011.
- ^ "New York City's Wastewater Treatment System" (PDF). New York City Department of Environmental Protection. Retrieved 6 February 2011.
- ^ "Bakersfield Wastewater Treatment Plant 3". Parsons. 5 December 2009. Archived from the original on 21 January 2011. Retrieved 6 February 2011.
- ^ Orta, Jason; Zhiqin Zhang; et al. (2010). "2009 Progress to Plan – Bioenergy Action Plan for California" (PDF). California Energy Commission.
- ^ Steve Hargreaves (9 March 2010). "Natural gas crystals: Energy under the sea". CNN Money. Retrieved 6 February 2011.
- ^ Tabuchi, Hiroko (12 March 2013). "An Energy Coup for Japan: 'Flammable Ice'". The New York Times.
- ^ "Natural Gas Processing: The Crucial Link Between Natural Gas Production and Its Transportation to Market" (PDF). Energy Information Administration, Office of Oil and Gas. January 2006. Retrieved 24 November 2017 – via The Louisiana Department of Natural Resources.
- ^ "Natural Gas Processing". Axens. Retrieved 24 November 2017.
- ^ Arg, S.R.; Engel, D.C. (1 January 2012). Reliable & Efficient Feed Gas Preparation – A Key Enabler to Pearl GTL. OnePetro. Society of Petroleum Engineers. doi:10.2118/157375-MS. ISBN 9781613992012. Retrieved 11 June 2015.
- ^ Elliot, Doug; et al. (2005). Benefits of Integrating NGL Extraction and LNG Liquefaction (PDF). Prepared for Presentation at AIChE 2005 Spring National Meeting 5th Topical Conference on Natural Gas Utilization (TI) Session 16c – Gas. Archived from the original (PDF) on 26 June 2013.
- ^ "U.S. Natural Gas Gross Withdrawals". U.S. Energy Information Administration (EIA). Retrieved 28 September 2020.
- ^ Gas Networks Ireland (1 June 2016). "Advice for Working in the Vicinity of Gas Pipelines" (PDF). Retrieved 20 June 2020.
- ^ "Gas Infrastructure Europe". Energia Mexicana (in Spanish). Retrieved 18 June 2009.
- ^ Ulvestad, Marte; Overland, Indra (2012). "Natural gas and CO2 price variation: Impact on the relative cost-efficiency of LNG and pipelines". International Journal of Environmental Studies. 69 (3): 407–426. doi:10.1080/00207233.2012.677581. PMC 3962073. PMID 24683269.
- ^ Hyne, Norman J. (1991). Dictionary of Petroleum Exploration, Drilling & Production. PennWell Books. p. 190. ISBN 978-0-87814-352-8.
- ^ Arezki, Rabah; Fetzer, Thiemo (January 2016). "On the Comparative Advantage of U.S. Manufacturing: Evidence from the Shale Gas Revolution" (PDF). Journal of International Economics. Centre for Economic Performance. ISSN 2042-2695. Archived from the original (PDF) on 1 July 2016.
- ^ "Bank-Led Satellite Imagery Sheds More Light on Gas Flaring Pollution". The World Bank – News & Broadcast. 29 August 2007. Retrieved 24 November 2017.
- ^ Ethan (9 November 2007). "Will eyes in the sky end natural gas flaring?". Ethan Zuckerman’s online home. Retrieved 24 November 2017.
- ^ "Composite image of gas flares in 1992, 2000 and 2006 by NGDC". Ethan Zuckerman’s online home. 9 November 2007. Retrieved 6 February 2011. National Geophysical Data Center (NGDC)
- ^ "Composite image of the earth at night". Retrieved 24 November 2017 – via Ethan Zuckerman’s online home.
- ^ Jürgen Wagner (19 June 2007). "The Contours of the New Cold War". IMI. Retrieved 6 February 2011.
- ^ "Gazprom and Russian Foreign Policy". NPR. Retrieved 24 November 2017.
- ^ Sumit Roy (23 June 2014). "U.S. Natural Gas Export Era Begins In 2015, Fueling Upside In Prices". Seeking Alpha. Retrieved 11 June 2015.
- ^ "SEAAOC – NT Resources Week – Informa – NT Government". NTRW. Archived from the original on 25 March 2012. Retrieved 11 June 2015.
- ^ "The Floating Liquefied Natural Gas (FLNG) Market 2011-2021". visiongain. 28 January 2011. ENE8974. Archived from the original on 19 March 2015. Retrieved 11 June 2015.
- ^ "Petronas' FLNG Facility to Deliver First Cargo in Q1 2016". World Maritime News Staff. 22 April 2015. Retrieved 23 November 2017.
- ^ Raj, Audrey (16 June 2015). "Steel cut for PETRONAS FLNG 2". Asian Oil & Gas. Retrieved 23 November 2017.
- ^ "prelude starts production".
- ^ "Browse Development – We remain committed to the earliest commercial development of the world-class Browse resources". www.woodside.com.au.
Woodside continues to target the selection of a Browse development concept in H2 2017 and commencement of front-end engineering and design (FEED) in 2019.
- ^ Jump up to: a b "Natural Gas Fuel Conditioning System – BTU Reduction". American Environmental Fabrication & Supply, LLC. Archived from the original on 7 December 2017. Retrieved 23 November 2017.
- ^ Matthew L. Wald (10 April 2013). "New Solar Process Gets More Out of Natural Gas". The New York Times.
- ^ Jump up to: a b c d e "Natural Gas and the Environment". NaturalGas.org. Archived from the original on 3 May 2009. Retrieved 11 June 2013.
- ^ "World Carbon Dioxide Emissions from the Use of Fossil Fuels". U.S. Energy Information Administration (eia). Archived from the original on 23 May 2011. Retrieved 5 February 2016.
- ^ "How much carbon dioxide is produced when different fuels are burned?". U.S. Energy Information Administration (eia).
- ^ Nuwer, Rachel (17 August 2012). "A 20–Year Low in U.S. Carbon Emissions". The New York Times.
- ^ "Biomass drying from CHP heat recovery". Alfagy Limited. Retrieved 2 November 2012.
- ^ "2014 data?" (PDF). International Energy Agency. p. 24. Archived from the original (PDF) on 5 April 2015.
- ^ Zimmerman, Barry E.; Zimmerman, David J. (1995). Nature's Curiosity Shop. Lincolnwood (Chicago), IL: Contemporary books. p. 28. ISBN 978-0-8092-3656-5.
- ^ Jump up to: a b Mulvaney, Dustin (2011). Green Energy: An A-to-Z Guide. SAGE. p. 301. ISBN 978-1-4129-9677-8.
- ^ "Gas Distribution System Code | Essential Services Commission". www.esc.vic.gov.au. Retrieved 22 September 2020.
- ^ "Alternative Fuels Data Center: Natural Gas Vehicle Emissions". afdc.energy.gov. Retrieved 1 September 2019.
- ^ "Worldwide NGV statistics". NGV journal. Archived from the original on 6 February 2015. Retrieved 19 November 2017.
- ^ "Clean Engine Vehicle". ETH Zurich. 22 October 2010. Archived from the original on 24 January 2015. Retrieved 23 January 2015.
- ^ "Take a look at some natural gas-powered airplanes". Well Said. 6 November 2014.
- ^ Jason Paur (31 July 2013). "American Firm Debuts First Airplane to Run on Natural Gas". Wired.
- ^ Le Cheylard France (19 February 2014). "Chomarat Present C-Ply KittyHawk with CNG Potential". NGV Global News.
- ^ "Development of Cryogenic Fuel Aircraft". Tupolev. Archived from the original on 9 December 2010. Retrieved 6 February 2011.
- ^ "BioProtein Production" (PDF). Archived from the original (PDF) on 10 May 2017. Retrieved 31 January 2018.
- ^ "Food made from natural gas will soon feed farm animals – and us". Retrieved 31 January 2018.
- ^ "New venture selects Cargill's Tennessee site to produce Calysta FeedKind® Protein". Retrieved 31 January 2018.
- ^ Le Page, Michael (10 November 2016). "Food made from natural gas will soon feed farm animals – and us". New Scientist. Retrieved 13 December 2016.
- ^ Parfenov, Mikhail V.; Pirutko, Larisa V. (1 August 2019). "Oxidation of ethylene to acetaldehyde by N2O on Na-modified FeZSM-5 zeolite". Reaction Kinetics, Mechanisms and Catalysis. 127 (2): 1025–1038. doi:10.1007/s11144-019-01610-z. ISSN 1878-5204. S2CID 189875484.
- ^ Suzuki, Takashi; Komatsu, Hidekazu; Tajima, So; Onda, Kouki; Ushiki, Ryuji; Tsukamoto, Sayuri; Kuroiwa, Hiroki (1 June 2020). "Preferential formation of 1-butene as a precursor of 2-butene in the induction period of ethene homologation reaction on reduced MoO3/SiO2 catalyst". Reaction Kinetics, Mechanisms and Catalysis. 130 (1): 257–272. doi:10.1007/s11144-020-01773-0. ISSN 1878-5204. S2CID 218513557.
- ^ Ge, Meng; Chen, Xingye; Li, Yanyong; Wang, Jiameng; Xu, Yanhong; Zhang, Lihong (1 June 2020). "Perovskite-derived cobalt-based catalyst for catalytic propane dehydrogenation". Reaction Kinetics, Mechanisms and Catalysis. 130 (1): 241–256. doi:10.1007/s11144-020-01779-8. ISSN 1878-5204. S2CID 218496057.
- ^ Li, Qian; Yang, Gongbing; Wang, Kang; Wang, Xitao (1 April 2020). "Preparation of carbon-doped alumina beads and their application as the supports of Pt–Sn–K catalysts for the dehydrogenation of propane". Reaction Kinetics, Mechanisms and Catalysis. 129 (2): 805–817. doi:10.1007/s11144-020-01753-4. ISSN 1878-5204. S2CID 212406355.
- ^ Hävecker, Michael; Wrabetz, Sabine; Kröhnert, Jutta; Csepei, Lenard-Istvan; Naumann d'Alnoncourt, Raoul; Kolen'Ko, Yury V.; Girgsdies, Frank; Schlögl, Robert; Trunschke, Annette (2012). "Surface chemistry of phase-pure M1 MoVTeNb oxide during operation in selective oxidation of propane to acrylic acid". J. Catal. 285: 48–60. doi:10.1016/j.jcat.2011.09.012. hdl:11858/00-001M-0000-0012-1BEB-F.
- ^ Naumann d'Alnoncourt, Raoul; Csepei, Lénárd-István; Hävecker, Michael; Girgsdies, Frank; Schuster, Manfred E.; Schlögl, Robert; Trunschke, Annette (2014). "The reaction network in propane oxidation over phase-pure MoVTeNb M1 oxide catalysts". J. Catal. 311: 369–385. doi:10.1016/j.jcat.2013.12.008. hdl:11858/00-001M-0000-0014-F434-5.
- ^ Kinetic studies of propane oxidation on Mo and V based mixed oxide catalysts (PDF). Technical University Berlin. 2011.
- ^ ● "Climate Change Indicators: Climate Forcing". EPA.gov. United States Environmental Protection Agency. 2021. Archived from the original on 9 May 2021.
● EPA credits data from "NOAA's Annual Greenhouse Gas Index (An Introduction)". NOAA.gov. National Oceanographic and Atmospheric Administration (Global Monitoring Laboratory, Earth System Research Laboratories). December 2020. Archived from the original on 13 May 2021. - ^ "Methane, explained". National Geographic. nationalgeographic.com. 23 January 2019. Retrieved 24 April 2020.
- ^ "Global Carbon Project (GCP)". www.globalcarbonproject.org. Retrieved 24 April 2020.
- ^ Jump up to: a b Myhre, G., D. Shindell, F.-M. Bréon, W. Collins, J. Fuglestvedt, J. Huang, D. Koch, J.-F. Lamarque, D. Lee, B. Mendoza, T. Nakajima, A. Robock, G. Stephens, T. Takemura and H. Zhang (2013) "Anthropogenic and Natural Radiative Forcing". Table 8.7 on page 714. In: Climate Change 2013: The Physical Science Basis. Contribution of Working Group I to the Fifth Assessment Report of the Intergovernmental Panel on Climate Change. Stocker, T.F., D. Qin, G.-K. Plattner, M. Tignor, S.K. Allen, J. Boschung, A. Nauels, Y. Xia, V. Bex and P.M. Midgley (eds.). Cambridge University Press, Cambridge, United Kingdom and New York, NY, USA. Anthropogenic and Natural Radiative Forcing
- ^ Jump up to: a b "Global Methane Emissions and Mitigation Opportunities" (PDF). Global Methane Initiative. Retrieved 24 April 2020.
- ^ Caroline Gramling (19 February 2020). "Fossil fuel use may emit 40 percent more methane than we thought". Science News. Retrieved 24 April 2020.
- ^ Stanley Manahan (2010). Environmental Chemistry (9th ed.). CRC press. ISBN 978-1420059205.
- ^ Gavin Schmidt (September 2004). "Methane: A Scientific Journey from Obscurity to Climate Super-Stardom". National Aeronautics and Space Administration. Goddard Institute for Space Studies. Retrieved 11 June 2013.
- ^ "Curbing Emissions by Sealing Gas Leaks". The New York Times. 14 October 2009. Retrieved 11 June 2013.
- ^ Jump up to: a b Mikkal Herberg. "Natural Gas in Asia: History and Prospects" (PDF). The National Bureau of Asian Research. (written for 2011 Pacific Energy Summit).
- ^ Cooney et al. (2014): Life Cycle Greenhouse Gas Perspective on Exporting Liquefied Natural Gas from the United States. National Energy Technology Laboratory, US Department of Energy.
- ^ Ritchie, Hannah; Roser, Max (11 May 2020). "CO2 emissions by fuel". Our World in Data. Retrieved 22 January 2021.
- ^ "Methane Tracker 2020 – Analysis". IEA. Retrieved 22 January 2021.
- ^ "Emissions Scenarios". IPCC. Retrieved 24 April 2020.
- ^ "North American drilling boom threatens big blow to climate efforts, study finds". The Guardian. 25 April 2019.
- ^ "Gulf Coast Express Pipeline placed in service ahead of schedule". Business Wire. 24 September 2019. Retrieved 31 December 2019.
- ^ "Natural Gas Flaring and Venting: State and Federal Regulatory Overview, Trends, and Impacts" (PDF). U.S. Department of Energy. 1 June 2019. Retrieved 29 December 2019.
- ^ "Van der Pekbuurt gaat als eerste Amsterdamse wijk van het aardgas af" (in Dutch). 1 October 2018.
- ^ Dozens Of US Cities Are Banning Natural Gas Hookups In New Buildings — #CancelGas #ElectrifyEverything
- ^ "Heat in Buildings". Retrieved 9 August 2021.
- ^ Jeff Brady; Dan Charles (22 February 2021). "As Cities Grapple With Climate Change, Gas Utilities Fight To Stay In Business". NPR.
- ^ "Gas vs Coal". global greenhouse warming. Retrieved 6 February 2011.
- ^ "Naturally Occurring Radioactive Materials (NORM)". World Nuclear Association. December 2016. Retrieved 22 November 2017.
- ^ "CDC - NIOSH - NORA Oil and Gas Extraction Council". www.cdc.gov. 12 February 2019. Retrieved 14 March 2019.
- ^ "NORA Oil and Gas Extraction Council - Research Agenda". www.cdc.gov. 12 February 2019. Retrieved 14 March 2019.
- ^ "Processing Natural Gas". NaturalGas.org. Archived from the original on 1 January 2011. Retrieved 6 February 2011.
- ^ Chiras, Daniel (2012). Environmental Science. Jones & Bartlett Learning. p. 283. ISBN 978-1-4496-1486-7 – via Google Books.
However, natural gas extraction can cause subsidence in the vicinity of the well. One notable example is in the Los Angeles–Long Beach harbor area, where extensive oil and gas extraction began in 1928 and has caused the ground to drop 9 meters (30 feet) in some areas.
- ^ National Petroleum Council (September 2011). Prudent Development: Realizing the Potential of North America's Abundant Natural Gas and Oil Resources (Report). Retrieved 24 November 2017. Lay summary (PDF).
- ^ Brantley, Susan L.; Meyendorff, Anna (13 March 2013). "The Facts on Fracking". The New York Times.
- ^ Fitzgerald, Timothy. "Frackonomics: Some Economics of Hydraulic Fracturing." Case Western Reserve Law Review 63.4 (2013). Web. 1 Sept. 2015.
- ^ Chojna, J., Losoncz, M., & Suni, P. (2013, November). Shale Energy Shapes Global Energy Markets. National Institute Economic Review.
- ^ Yeboah, N.N.N.; Burns, S.E. (2011). "Geological Disposal of Energy-Related Waste". KSCE Journal of Civil Engineering. 15 (4): 701–702. doi:10.1007/s12205-011-0010-x. S2CID 109840417.
- ^ Gallegos, Tanya J.; Varela, Brian A. (2015). Trends in Hydraulic Fracturing Distributions and Treatment Fluids, Additives, Proppants, and Water Volumes Applied to Wells Drilled in the United States through 1947 through 2010—Data Analysis and Comparison to the Literature (PDF) (Report). 11. U.S. Geological Survey. Scientific Investigations Report 2014.5131.
- ^ "Our responsibility: Limit the impact of our industrial operations". Total.com. Total.
- ^ "Shale Gas and Other Unconventional Sources of Natural Gas". Union of Concerned Scientists.
- ^ "How is Shale Gas Produced?" (PDF). Energy.gov.
- ^ "U.S. Average Depth of Natural Gas Developmental Wells Drilled". U.S. Energy Information Administration (eia).
- ^ "The Environmental and Occupational Health Impacts of High-Volume Hydraulic Fracturing of Unconventional Gas Reserves". APHA. 30 October 2012.
- ^ "Documents Reveal Billions of Gallons of Oil Industry Wastewater Illegally Injected into Central California Aquifers". Center for Biological Diversity. 6 October 2014.
- ^ Keranen, K.M.; Weingarten, M.; Abers, G.A.; Bekins, B.A.; Ge, S. (25 July 2014). "Sharp increase in central Oklahoma seismicity since 2008 induced by massive wastewater injection". Science. 345 (6195): 448–451. Bibcode:2014Sci...345..448K. doi:10.1126/science.1255802. PMID 24993347. S2CID 206558853.
- ^ Osborn, Stephen G.; Vengosh, Avner; Warner, Nathaniel R.; Jackson, Robert B. (17 May 2011). "Methane contamination of drinking water accompanying gas-well drilling and hydraulic fracturing". Proceedings of the National Academy of Sciences. 108 (20): 8172–8176. Bibcode:2011PNAS..108.8172O. doi:10.1073/pnas.1100682108. PMC 3100993. PMID 21555547.
- ^ "Quality Assurance Project Plan for the Chemical Characterization of Select Constituents Relevant to Hydraulic Fracturing" (PDF). U.S. Environmental Protection Agency. 18 October 2012. Retrieved 22 November 2017.
- ^ Howarth, Robert W. (15 September 2011). "Should Fracking Stop?". Nature. 477 (7364): 271–275. doi:10.1038/477271a. PMID 21921896. S2CID 205067220.
- ^ Josh Harkinson (1 September 2011). "As Texas Withers, Gas Industry Guzzles". Mother Jones. Retrieved 22 November 2017.
- ^ Rawson, Nancy; Quraishi, Ali; Bruno, Thomas J. (2011). "Findings and Recommendations From the Joint NIST—AGA Workshop on Odor Masking". Journal of Research of the National Institute of Standards and Technology. 116 (6): 839–848. doi:10.6028/jres.116.026. PMC 4551224. PMID 26989604.
- ^ "Data and Statistics Overview". United States Department of Transport Pipeline and Hazardous Materials Safety Administration. Retrieved 22 July 2021.
- ^ US Consumer Product Safety Commission, Non-Fire Carbon Monoxide Deaths, 2011 Annual Estimate, September 2014.
- ^ "Gas Density, Molecular Weight and Density" (PDF). teknopoli.
- ^ Goldman, David (30 August 2015). "Natural gas discovery could be largest ever". CNN Money.
- ^ "Energy Prices Report". Europe's Energy Portal. Retrieved 11 June 2015.
- ^ "Market analysis". European Commission. Retrieved 11 June 2015.
- ^ Farah, Paolo Davide (2015). "Offshore Natural Gas Resources in the Eastern Mediterranean in the Relations to the European Union: A Legal Perspective through the Lenses of MedReg". Journal of World Energy Law and Business. 8 (8). SSRN 2695964.
- ^ Heat value definitions. WSU website. Retrieved 2008-05-19.
- ^ James L. Williams (2 October 1998). "NYMEX Natural Gas Futures". WTRG Economics. Retrieved 22 November 2017.
- ^ "U.S. Natural Gas Prices". U.S. Energy Information Agency. Retrieved 21 August 2012.
- ^ "Adsorbed Natural Gas". scopeWe – a Virtual Engineer. Archived from the original on 9 November 2013. Retrieved 11 June 2015.
Further reading[]
- Blanchard, Charles. The Extraction State: A History of Natural Gas in America (U of Pittsburgh Press, 2020) online review
- Mincicova V.S. (2021) Possible Medium-Term Scenarios of Dynamics of Russia’s Energy Resource Exports After the Economic Crisis of 2020. In: Shakirova O.G., Bashkov O.V., Khusainov A.A. (eds) Current Problems and Ways of Industry Development: Equipment and Technologies. Lecture Notes in Networks and Systems, vol 200. Springer, Cham. https://doi.org/10.1007/978-3-030-69421-0_92
External links[]

| show Authority control |
|---|
- Natural gas
- Chinese inventions
- Fuel gas