Atmospheric methane
This article's factual accuracy may be compromised due to out-of-date information. The reason given is: New results show that anthropogenic emissions were underestimated, and natural emission of methane is an order of magnitude lower than previously thought. (February 2020) |

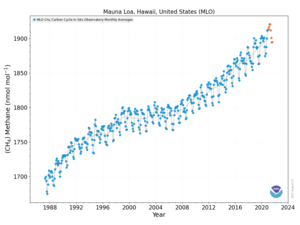


Atmospheric methane is the methane present in Earth's atmosphere.[3] Atmospheric methane concentrations are of interest because it is one of the most potent greenhouse gases in Earth's atmosphere. Atmospheric methane is rising.[4]
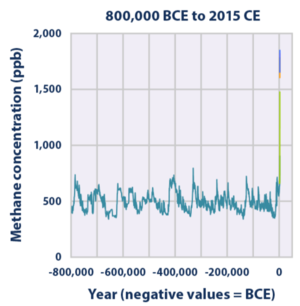
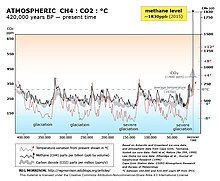
The 20-year global warming potential of methane is 84.[5][6] That is, over a 20-year period, it traps 84 times more heat per mass unit than carbon dioxide (CO2) and 105 times the effect when accounting for aerosol interactions.[7] Global methane concentrations rose from 722 parts per billion (ppb) in pre-industrial times to 1879 ppb by 2020,[8] an increase by a factor of 2.5 and the highest value in at least 800,000 years.[9] Its concentration is higher in the Northern Hemisphere since most sources (both natural and human) are located on land and the Northern Hemisphere has more land mass.[10] The concentrations vary seasonally, with, for example, a minimum in the northern tropics during April−May mainly due to removal by the hydroxyl radical.[11] It remains in the atmosphere for 12 years.[12]
Early in the Earth's history carbon dioxide and methane likely produced a greenhouse effect. The carbon dioxide would have been produced by volcanoes and the methane by early microbes. During this time, Earth's earliest life appeared.[13] These first, ancient bacteria added to the methane concentration by converting hydrogen and carbon dioxide into methane and water. Oxygen did not become a major part of the atmosphere until photosynthetic organisms evolved later in Earth's history. With no oxygen, methane stayed in the atmosphere longer and at higher concentrations than it does today.[14]
The known sources of methane are predominantly located near the Earth's surface.[15] In combination with vertical atmospheric motions and methane's relatively long lifetime, methane is considered to be a well-mixed gas.[16] In other words, the concentration of methane is taken to be constant with respect to height within the troposphere. The dominant sink of methane in the troposphere is reaction with hydroxyl radicals that are formed by reaction of singlet oxygen atoms with water vapor.[17] Methane is also present in the stratosphere, where methane's concentration decreases with height.[17]
Methane as a greenhouse gas[]
Methane in the Earth's atmosphere is a strong greenhouse gas with a global warming potential (GWP) 84 times greater than CO2 in a 20-year time frame; methane is not as persistent a gas as CO2 (assuming no change in carbon sequestration rates) and tails off to about GWP of 28 for a 100-year time frame.[18][19][page needed][20] This means that a methane emission is projected to have 28 times the impact on temperature of a carbon dioxide emission of the same mass over the following 100 years assuming no change in the rates of carbon sequestration. Methane has a large effect but for a relatively brief period, having an estimated mean half-life of 9.1 years in the atmosphere,[19] whereas carbon dioxide is currently given an estimated mean lifetime of over 100 years.
The globally averaged concentration of methane in Earth's atmosphere increased by about 150% from 722 ± 25 ppb in 1750 to 1803.2 ± 1.2 ppb in 2011.[19][page needed] As of 2011, methane contributed radiative forcing of 0.48 ± 0.05 Wm−2 , or about 17% of the total radiative forcing from all of the long-lived and globally mixed greenhouse gases.[19][page needed] According to NOAA, the atmospheric methane concentration has continued to increase since 2011 to an average global concentration of 1892.2 ppb as of December 2020.[21] The March 2019 peak was 1866.2 ppb, while the April 2020 peak was 1876.0 ppb, a .5% increase.[21]
Emissions accounting of methane[]
The balance between sources and sinks of methane is not yet fully understood. The IPCC Working Group I stated in chapter 2 of the Fourth Assessment Report that there are "large uncertainties in the current bottom-up estimates of components of the global source", and the balance between sources and sinks is not yet well known. The most important sink in the methane cycle is reaction with the hydroxyl radical, which is produced photochemically in the atmosphere. Production of this radical is not fully understood and has a large effect on atmospheric concentrations. This uncertainty is exemplified by observations that have shown between the year 2000 and 2006 increases in atmospheric concentration of methane ceased, for reasons still being investigated.[22]
Various research groups give the following values for methane emissions:
| Reference: | Fung et al. (1991) | Hein et al. (1997) | Lelieveld et al. (1998) | Houweling et al. (1999) | Bousquet et al. (2006)[24] | Saunois et al. (2016)[25][26] | Saunois et al. (2020)[27] |
|---|---|---|---|---|---|---|---|
| Base year: | 1980s | – | 1992 | – | – | 2003–2012 | 2008-2017 |
| Natural emission sources | |||||||
| Wetlands | 115 | 237 | 225[nb 1] | 145 | 147±15 | 167 (127–202) | 181 (159-200) |
| Termites | 20 | – | 20 | 20 | 23±4 | 64 (21–132) | 37 (21–50) |
| Ocean | 10 | – | 15 | 15 | 19±6 | ||
| Hydrates | 5 | – | 10 | – | – | ||
| Anthropogenic emission sources | |||||||
| Energy | 75 | 97 | 110 | 89 | 110±13 | 105 (77–133) | 111 (81-131) |
| Landfills | 40 | 35 | 40 | 73 | 55±11[nb 2] | 188 (115-243) | 217 (207-240) |
| Ruminants (livestock) | 80 | 90[nb 3] | 115 | 93 | |||
| Waste treatment | – | [nb 3] | 25 | – | [nb 2] | ||
| Rice agriculture | 100 | 88 | [nb 1] | – | 31±5 | ||
| Biomass burning | 55 | 40 | 40 | – | 50±8 | 34 (15–53) | 30 (22-36) |
| Other | – | – | – | 20 | 90±14[nb 4] | ||
| Sinks | |||||||
| Soils | 10 | 30 | 40 | 21±3 | 33 (28–38) | 38 (27-45) | |
| Tropospheric OH | 450 | 489 | 510 | 448±1 | 515 | 518 (474–532) | |
| Stratospheric loss | 46 | 40 | 37±1 | ||||
| Source versus sink imbalance | |||||||
| Total source | 500 | 587 | 600 | 525±8 | 558 (540–568) | 576 (550-594) | |
| Total sink | 460 | 535 | 580 | 506 | 548 | 556 (501–574) | |


Natural sources of atmospheric methane[]
Any process that results in the production of methane and its release into the atmosphere can be considered a "source". The two main processes that are responsible for methane production occur as a result of microorganisms anaerobically converting organic compounds into methane.
Methanogenesis[]
Most ecological emissions of methane relate directly to methanogens generating methane in warm, moist soils as well as in the digestive tracts of certain animals. Methanogens are methane producing microorganisms. In order to produce energy, they use an anaerobic process called methanogenesis. This process is used in lieu of aerobic, or with oxygen, processes because methanogens are unable to metabolise in the presence of even small concentrations of oxygen. When acetate is broken down in methanogenesis, the result is the release of methane into the surrounding environment.
Methanogenesis, the scientific term for methane production, occurs primarily in anaerobic conditions because of the lack of availability of other oxidants. In these conditions, microscopic organisms called archaea use acetate and hydrogen to break down essential resources[vague] in a process called fermentation.
Acetoclastic methanogenesis – certain archaea cleave acetate produced during anaerobic fermentation to yield methane and carbon dioxide.
- H3C-COOH → CH4 + CO2
Hydrogenotrophic methanogenesis – archaea oxidize hydrogen with carbon dioxide to yield methane and water.
- 4H2 + CO2 → CH4 + 2H2O
While acetoclastic methanogenesis and hydrogenotrophic methanogenesis are the two major source reactions for atmospheric methane, other minor biological methane source reactions also occur. For example, it has been discovered that leaf surface wax exposed to UV radiation in the presence of oxygen is an aerobic source of methane.[29]
Wetlands[]
Wetlands account for approximately 20 percent of atmospheric methane through emissions from soils and plants.[30] Wetlands counteract the sinking action that normally occurs with soil because of the high water table. The level of the water table represents the boundary between anaerobic methane production and aerobic methane consumption. When the water table is low, the methane generated within the wetland soil has to come up through the soil and get past a deeper layer of methanotrophic bacteria, thereby reducing emission. Methane transport by vascular plants can bypass this aerobic layer, thus increasing emission.[31][32]
Animals[]
Ruminant animals, particularly cows and sheep, contain bacteria in their gastrointestinal systems that help to break down plant material. Some of these microorganisms use the acetate from the plant material to produce methane, and because these bacteria live in the stomachs and intestines of ruminants, whenever the animal "burps" or defecates, it emits methane as well. Based upon a study in the Snowy Mountains region, the amount of methane emitted by one cow is equivalent to the amount of methane that around 3.4 hectares of methanotrophic bacteria can consume.[33]
Termites also contain methanogenic microorganisms in their gut. However, some of these microorganisms are so unique that they live nowhere else in the world except in the third gut of termites. These microorganisms also break down biotic components to produce ethanol, as well as methane byproduct. However, unlike ruminants who lose 20 percent of the energy from the plants they eat, termites only lose 2 percent of their energy in the process.[34] Thus comparatively, termites do not have to eat as much food as ruminants to obtain the same amount of energy, and give off proportionally less methane.
Plants[]
Living plants (e.g. forests) have recently been identified as a potentially important source of methane, possibly being responsible for approximately 10 to 30 percent of atmospheric methane.[35] A 2006 paper calculated emissions of 62–236 Tg a−1, and "this newly identified source may have important implications".[36][37] However the authors stress "our findings are preliminary with regard to the methane emission strength".[38]
These findings have been called into question in a 2007 paper which found "there is no evidence for substantial aerobic methane emission by terrestrial plants, maximally 0.3% of the previously published values".[39]
While the details of plant methane emissions have yet to be confirmed, plants as a significant methane source would help fill in the gaps of previous global methane budgets as well as explain large plumes of methane that have been observed over the tropics.[35][40]
In wetlands, where the rate of methane production is high, plants help methane travel into the atmosphere—acting like inverted lightning rods as they direct the gas up through the soil and into the air. They are also suspected to produce methane themselves, but because the plants would have to use aerobic conditions to produce methane, the process itself is still unidentified.[41]
Methane gas from methane clathrates[]
At high pressures, such as are found on the bottom of the ocean, methane forms a solid clathrate with water, known as methane hydrate. An unknown, but possibly very large quantity of methane is trapped in this form in ocean sediments. The release of large volumes of methane gas from such sediments into the atmosphere has been suggested as a possible cause for rapid global warming events in the Earth's distant past, such as the Paleocene–Eocene Thermal Maximum of 55 million years ago,[42] and the Great Dying.[43]
Theories suggest that should global warming cause them to heat up sufficiently, all of this methane gas could again be released into the atmosphere. Since methane gas is twenty-five times stronger (for a given weight, averaged over 100 years) than CO
2 as a greenhouse gas; this would immensely magnify the greenhouse effect. However, most of this reservoir of hydrates appears isolated from changes to the surface climate, so any such release is likely to happen over geological timescales of a millennium or more.[44]
Permafrost[]

Methane that gets frozen in permafrost – land that is frozen for several years at a time – is slowly released from bogs as the permafrost melts. With rising global temperatures, the amount of permafrost melting and releasing methane continues to increase.
Although records of permafrost are limited, recent years (1999 to 2007) have seen record thawing of permafrost in Alaska and Siberia. Measurements during 2006 in Siberia show that the methane released is five times greater than previously estimated.[45] Melting yedoma, a type of permafrost, is a significant source of atmospheric methane (about 4 Tg of CH4 per year).[46]
The Woods Hole Research Center, citing two 2015 studies on permafrost carbon says there may be a self-reinforcing tipping point where an estimated equivalent of 205 gigatons of carbon dioxide in the form of methane could cause up to 0.5 °C (up to 0.9 °F) warming by the end of the century, which would trigger more warming. Permafrost contains almost twice as much carbon as is present in the atmosphere. Some researchers claim that the Intergovernmental Panel on Climate Change does not adequately account for arctic methane in permafrost.[47]
More recently, Dyonisius et al. (2020) found that methane emissions from old, cold-region carbon reservoirs like permafrost and methane hydrates were minor during the last deglaciation. They analyzed the carbon isotopic composition of atmospheric methane trapped in bubbles in Antarctic ice and found that methane emissions from those old carbon sources during the warming interval were small. They argue that this finding suggests that methane emissions in response to future warming likely will not be as large as some have suggested.).[48]
Anthropogenic sources of atmospheric methane[]
Slightly over half of the total emission is due to human activity.[49] Since the Industrial Revolution humans have had a major impact on concentrations of atmospheric methane, increasing atmospheric concentrations roughly 250%.[50] According to the 2021 IPCC report, 30 - 50 percent of the current rise in temperatures is caused by emissions of methane,[51]and reducing methane is a fast way of climate change mitigation.[52]
Ecological conversion[]
Conversion of forests and natural environments into agricultural plots increases the amount of nitrogen in the soil, which inhibits methane oxidation, weakening the ability of the methanotrophic bacteria in the soil to act as sinks.[53] Additionally, by changing the level of the water table, humans can directly affect the soil's ability to act as a source or sink. The relationship between water table levels and methane emission is explained in the wetlands section of natural sources.
Farm animals[]
A 2006 UN FAO report reported that livestock generate more greenhouse gases as measured in CO2 equivalents than the entire transportation sector. Livestock accounts for 9 percent of anthropogenic CO2, 65 percent of anthropogenic nitrous oxide and 37 percent of anthropogenic methane. A senior UN official and co-author of the report, Henning Steinfeld, said "Livestock are one of the most significant contributors to today's most serious environmental problems."[54]
Recent NASA research has confirmed the vital role of enteric fermentation in livestock on global warming. "We understand that other greenhouse gases apart from carbon dioxide are important for climate change today," said Gavin Schmidt, the lead author of the study and a researcher at NASA's Goddard Institute for Space Studies in New York City and Columbia University's Center for Climate Systems Research.[55] Other recent peer reviewed NASA research published in the journal Science has also indicated that the contribution of methane to global warming has been underestimated.[56][57]
Nicholas Stern, the author of the 2006 Stern Review on climate change has stated "people will need to turn vegetarian if the world is to conquer climate change".[58] President of the National Academy of Sciences Ralph Cicerone (an atmospheric scientist), has indicated the contribution of methane by livestock flatulence and eructation to global warming is a "serious topic". Cicerone states "Methane is the second-most-important greenhouse gas in the atmosphere now. The population of beef cattle and dairy cattle has grown so much that methane from cows now is big. This is not a trivial issue."[59]
Approximately 5% of the methane is released via the flatus, whereas the other 95% is released via eructation. Vaccines are under development to reduce the amount introduced through eructation.[60] Asparagopsis seaweed as a livestock feed additive has reduced methane emissions by more than 80%.[61]
Rice agriculture[]
Due to a continuously growing world population, rice agriculture has become one of the most significant anthropogenic sources of methane. With warm weather and water-logged soil, rice paddies act like wetlands, but are generated by humans for the purpose of food production. Due to the swamp-like environment of rice fields, these paddies yield 50–100 million metric tons of methane emission each year.[62] This means that rice agriculture is responsible for approximately 15 to 20 percent of anthropogenic methane emissions.[63] An article written by William F. Ruddiman explores the possibility that methane emissions began to rise as a result of anthropogenic activity 5000 years ago when ancient cultures started to settle and use agriculture, rice irrigation in particular, as a primary food source.[64]
Landfills[]
Due to the large collections of organic matter and availability of anaerobic conditions, landfills are the third largest source of atmospheric methane in the United States, accounting for roughly 18.2% of methane emissions globally in 2014.[65] When waste is first added to a landfill, oxygen is abundant and thus undergoes aerobic decomposition; during which time very little methane is produced. However, generally within a year oxygen levels are depleted and anaerobic conditions dominate the landfill allowing methanogens to takeover the decomposition process. These methanogens emit methane into the atmosphere and even after the landfill is closed, the mass amount of decaying matter allows the methanogens to continue producing methane for years.[66]
Waste water treatment[]
Waste water treatment facilities act to remove organic matter, solids, pathogens, and chemical hazards as a result of human contamination. Methane emission in waste treatment facilities occurs as a result of anaerobic treatments of organic compounds and anaerobic biodegradation of sludge.[67]
Biomass burning[]
Incomplete burning of both living and dead organic matter results in the emission of methane. While natural wildfires can contribute to methane emissions, the bulk majority of biomass burning occurs as a result of humans – including everything from accidental burnings by civilians to deliberate burnings used to clear out land to biomass burnings occurring as a result of destroying waste.[40]
Oil and natural gas supply chain[]
Methane is a primary component of natural gas, and thus during the production, processing, storage, transmission, and distribution of natural gas, a significant amount of methane is lost into the atmosphere.[67]
According to the EPA Inventory of U.S Greenhouse Gas Emissions and Sinks: 1990–2015 report, 2015 methane emissions from natural gas and petroleum systems totaled 8.1 Tg per year in the United States. Individually, the EPA estimates that the natural gas system emitted 6.5 Tg per year of methane while petroleum systems emitted 1.6 Tg per year of methane.[68] Methane emissions occur in all sectors of the natural gas industry, from drilling and production, through gathering and processing and transmission, to distribution. These emissions occur through normal operation, routine maintenance, fugitive leaks, system upsets, and venting of equipment. In the oil industry, some underground crude contains natural gas that is entrained in the oil at high reservoir pressures. When oil is removed from the reservoir, associated gas is produced.
However, a review of methane emissions studies reveals that the EPA Inventory of Greenhouse Gas Emissions and Sinks: 1990–2015 report likely significantly underestimated 2015 methane emissions from the oil and natural gas supply chain. The review concluded that in 2015 the oil and natural gas supply chain emitted 13 Tg per year of methane, which is about 60% more than the EPA report for the same time period. The authors write that the most likely cause for the discrepancy is an under sampling by the EPA of so-called "abnormal operating conditions", during which large quantities of methane can be emitted.[69]
| Supply Chain Segment | EPA Inventory of US Greenhouse Gas
Emissions and Sinks: 1990–2015 report[68] |
Alvarez et al. 2018[69] |
|---|---|---|
| Oil and natural gas production | 3.5 | 7.6 |
| Natural gas gathering | 2.3 | 2.6 |
| Natural gas transmission and storage | 1.4 | 1.8 |
| Natural gas processing | 0.44 | 0.72 |
| Natural gas local distribution | 0.44 | 0.44 |
| Oil refining and transportation | 0.034 | 0.034 |
| Total (95% confidence interval) | 8.1 (6.7–10.2) | 13 (11.3–15.1) |
Methane slip from gas engines[]
The use of natural gas and biogas in ICE (Internal combustion engine) for such applications as electricity production / cogeneration / CHP (Combined Heat and Power) and heavy vehicles or marine vessels such as LNG carriers using the boil off gas for propulsion, emits a certain percentage of UHC, unburned hydrocarbon of which 85% is methane. The climate issues of using gas to fuel ICE may offset or even cancel out the advantages of less CO2 and particle emissions is described in this 2016 EU Issue Paper on methane slip from marine engines: "Emissions of unburnt methane (known as the 'methane slip') were around 7 g per kg LNG at higher engine loads, rising to 23–36 g at lower loads. This increase could be due to slow combustion at lower temperatures, which allows small quantities of gas to avoid the combustion process". Road vehicles run more on low load than marine engines causing relatively higher methane slip.
Coal mining[]
In 2014 NASA researchers reported the discovery of a 2,500 square miles (6,500 km2) methane cloud floating over the Four Corners region of the south-west United States. The discovery was based on data from the European Space Agency's Scanning Imaging Absorption Spectrometer for Atmospheric Chartography instrument from 2002 to 2012.[70]
The report concluded that "the source is likely from established gas, coal, and coalbed methane mining and processing." The region emitted 590,000 metric tons of methane every year between 2002 and 2012—almost 3.5 times the widely used estimates in the European Union's Emissions Database for Global Atmospheric Research.[70] In 2019, the International Energy Agency (IEA) estimated that the methane emissions leaking from the world's coalmines are warming the global climate at the same rate as the shipping and aviation industries combined.[71]
Removal processes[]
Any process that consumes methane from the atmosphere can be considered a "sink" of atmospheric methane. The most prominent of these processes occur as a result of methane either being destroyed in the atmosphere or broken down in soil. Humans have yet to act as any significant sink of atmospheric methane.
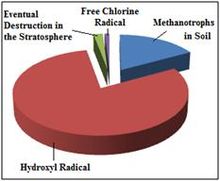
Reaction with the hydroxyl radical – The major removal mechanism of methane from the atmosphere involves radical chemistry; it reacts with the hydroxyl radical (·OH) in the troposphere or stratosphere to create the ·CH3 radical and water vapor. In addition to being the largest known sink for atmospheric methane, this reaction is one of the most important sources of water vapor in the upper atmosphere. Following the reaction of methane with the hydroxyl radical, two dominant pathways of methane oxidation exist: [A] which leads to a net production of ozone, and [B] which causes no net ozone change. For methane oxidation to take the pathway that leads to net ozone production, nitric oxide (NO) must be available to react with CH3O2·. Otherwise, CH3O2· reacts with the hydroperoxyl radical (HO2·), and the oxidation takes the pathway with no net ozone change. Both oxidation pathways lead to a net production of formaldehyde and water vapor.
[A] Net production of O3
CH4 + ·OH → CH3· + H2O
CH3· + O2 + M → CH3O2· + M
CH3O2· + NO → NO2 + CH3O·
CH3O· + O2 → HO2· + HCHO
HO2· + NO → NO2 + ·OH
(2x) NO2 + hv → O(3P) + NO
(2x) O(3P) + O2 + M → O3 + M
[NET: CH4 + 4O2 → HCHO + 2O3 + H2O]
[B] No net change of O3
CH4 + ·OH → CH3· + H2O
CH3· + O2 + M → CH3O2· + M
CH3O2· + HO2· + M → CH3O2H + O2 + M
CH3O2H + hv → CH3O· + ·OH
CH3O· + O2 → HO2· + HCHO
[NET: CH4 + O2 → HCHO + H2O]
Note that for the second reaction, there will be a net loss of radicals in the case where CH3O2H is lost to wet deposition before it can undergo photolysis such that: CH3O2H + H2O → wet deposition. Also note that M represents a random molecule that facilitates energy transfer during the reaction.[17] This reaction in the troposphere gives a methane mean lifetime of 9.6 years. Two more minor sinks are soil sinks (160-year mean lifetime) and stratospheric loss by reaction with ·OH, ·Cl and ·O1D in the stratosphere (120-year mean lifetime), giving a net mean lifetime of 8.4 years.[23] Oxidation of methane is the main source of water vapor in the upper stratosphere (beginning at pressure levels around 10 kPa).
The methyl radical formed in the above reaction will, during normal daytime conditions in the troposphere, usually react with another hydroxyl radical to form formaldehyde. Note that this is not strictly oxidative pyrolysis as described previously. Formaldehyde can react again with a hydroxyl radical to form carbon dioxide and more water vapor. Sidechains in these reactions may interact with nitrogen compounds that will likely produce ozone, thus supplanting radicals required in the initial reaction.[72]
Natural sinks of atmospheric methane[]
Most natural sinks occur as a result of chemical reactions in the atmosphere as well as oxidation by methane consuming bacteria in Earth's soils.
Methanotrophs in soils[]
Soils act as a major sink for atmospheric methane through the methanotrophic bacteria that reside within them. This occurs with two different types of bacteria. "High capacity-low affinity" methanotrophic bacteria grow in areas of high methane concentration, such as waterlogged soils in wetlands and other moist environments. And in areas of low methane concentration, "low capacity-high affinity" methanotrophic bacteria make use of the methane in the atmosphere to grow, rather than relying on methane in their immediate environment.[73]
Forest soils act as good sinks for atmospheric methane because soils are optimally moist for methanotroph activity, and the movement of gases between soil and atmosphere (soil diffusivity) is high.[73] With a lower water table, any methane in the soil has to make it past the methanotrophic bacteria before it can reach the atmosphere.
Wetland soils, however, are often sources of atmospheric methane rather than sinks because the water table is much higher, and the methane can be diffused fairly easily into the air without having to compete with the soil's methanotrophs.
Methanotrophic bacteria in soils – Methanotrophic bacteria that reside within soil use methane as a source of carbon in methane oxidation.[73] Methane oxidation allows methanotrophic bacteria to use methane as a source of energy, reacting methane with oxygen and as a result producing carbon dioxide and water.
- CH4 + 2O2 → CO2 + 2H2O
Troposphere[]
The most effective sink of atmospheric methane is the hydroxyl radical in the troposphere, or the lowest portion of Earth's atmosphere. As methane rises into the air, it reacts with the hydroxyl radical to create water vapor and carbon dioxide. The mean lifespan of methane in the atmosphere was estimated at 9.6 years as of 2001; however, increasing emissions of methane over time reduce the concentration of the hydroxyl radical in the atmosphere.[40] With less OH˚ to react with, the lifespan of methane could also increase, resulting in greater concentrations of atmospheric methane.[74]
Stratosphere[]
If it is not destroyed in the troposphere, methane will last approximately 120 years before it is eventually destroyed in Earth's next atmospheric layer: the stratosphere. Destruction in the stratosphere occurs the same way that it does in the troposphere: methane is oxidized to produce carbon dioxide and water vapor. Based on balloon-borne measurements since 1978, the abundance of stratospheric methane has increased by 13.4%±3.6% between 1978 and 2003.[75]
Reaction with free chlorine[]
The reaction of methane and chlorine atoms acts as a primary sink of Cl atoms and is a primary source of hydrochloric acid (HCl) in the stratosphere.[17]
CH4 + Cl → CH3 + HCl
The HCl produced in this reaction leads to catalytic ozone destruction in the stratosphere.[76]
Removal of methane in the lower troposphere may be achieved by chlorine radicals produced by iron salt aerosols, which could be artificially increased without risk to stratospheric ozone.[77]
Trends in methane levels over time[]
Since the 1800s, atmospheric methane concentrations have increased annually at a rate of about 0.9%.[30]
Global trends in methane levels[]
Long term atmospheric measurements of methane by NOAA show that the build up of methane leveled off during the decade prior to 2006, after nearly tripling since pre-industrial times.[78] Although scientists have yet to determine what caused this reduction in the rate of accumulation of atmospheric methane, it appears it could be due to reduced industrial emissions and drought in wetland areas.
Exceptions to this drop in growth rate occurred in 1991 and 1998 when growth rates increased suddenly to 14–15 nmol/mol per year for those years, nearly double the growth rates of the years before.[35]
The 1991 spike is understood to be due to the volcanic eruption of Mt. Pinatubo in June of that year. Volcanoes affect atmospheric methane emissions when they erupt, releasing ash and sulfur dioxide into the air. As a result, photochemistry of plants is affected and the removal of methane via the tropospheric hydroxyl radical is reduced. However, growth rates quickly fell due to lower temperatures and global reduction in rainfall.
The cause of the 1998 spike is unresolved, but scientists are currently attributing it to a combination of increased wetland and rice field emissions as well as an increased amount of biomass burning. 1998 was also the warmest year since surface temperatures were first recorded, suggesting that anomalously high temperatures can induce elevated methane emission.[79]
Data from 2007 suggested methane concentrations were beginning to rise again.[80] This was confirmed in 2010 when a study showed methane levels were on the rise for the 3 years 2007 to 2009. After a decade of near-zero growth in methane levels, "globally averaged atmospheric methane increased by [approximately] 7 nmol/mol per year during 2007 and 2008. During the first half of 2009, globally averaged atmospheric CH4 was [approximately] 7 nmol/mol greater than it was in 2008, suggesting that the increase will continue in 2009."[81] From 2015 to 2019 sharp rises in levels of atmospheric methane have been recorded.[82]
Methane emissions levels vary greatly depending on the local geography. For both natural and anthropogenic sources, higher temperatures and higher water levels result in the anaerobic environment that is necessary for methane production.
Natural methane cycles[]
Emissions of methane into the atmosphere are directly related to temperature and moisture. Thus, the natural environmental changes that occur during seasonal change act as a major control of methane emission. Additionally, even changes in temperature during the day can affect the amount of methane that is produced and consumed.
For example, plants that produce methane can emit as much as two to four times more methane during the day than during the night.[30] This is directly related to the fact that plants tend to rely on solar energy to enact chemical processes.
Additionally, methane emissions are affected by the level of water sources. Seasonal flooding during the spring and summer naturally increases the amount of methane released into the air.
Changes due to human activity[]
| Part of a series on the |
| Carbon cycle |
|---|
 |
Changes due to pre-industrial human activity[]
The most clearly identified rise in atmospheric methane as a result of human activity occurred in the 1700s during the industrial revolution. As technology increased at a considerable rate, humans began to build factories and plants, burn fossil fuels for energy, and clear out forests and other vegetation for the purpose of building and agriculture. This growth continued to rise at a rate of almost 1 percent per year until around 1990 when growth rates dropped to almost zero.[35]
A 2003 article from William F. Ruddiman, however, indicates that the anthropogenic change in methane may have started 5000 years prior to the industrial revolution.[64] The methane insolation cycles of the ice core remained stable and predictable until 5000 years ago, most likely due to some anthropogenic effect.[64] Ruddiman suggests that the transition of humans from hunter gatherers into agricultural farming was the first instance of humans affecting methane concentration in the atmosphere. Ruddiman's hypothesis is supported by the fact that early rice irrigation occurred approximately 5000 years ago—the same time the ice core cycles lost their predictability. Due to the inefficiency of humans first learning how to grow rice, extensive rice paddies would have been needed to feed even a small population. These, over-flooded and filled with weeds, would have resulted in huge methane emitting wetlands.[64]
Changes due to industrial human activity[]

Increases in methane levels due to modern human activities arise from a number of specific sources.
- Methane emissions from industrial activity
- Methane emissions from extraction of oil and natural gas from underground reserves[84]
- Methane emissions from transportation via pipeline of oil and natural gas
- Methane emissions from melting permafrost in Arctic regions, due to global warming which is caused by human use of fossil fuels
Emissions due to oil and gas extraction[]
Natural gas pipelines[]
One source of methane emissions has been identified as pipelines that transport natural gas; one example is pipelines from Russia to customers in Europe. Near Yamburg and Urengoy exist gas fields with a methane concentration of 97 percent.[85] The gas obtained from these fields is taken and exported to Western and Central Europe through an extensive pipeline system known as the Trans-Siberian natural gas pipeline system. In accordance with the IPCC and other natural gas emissions control groups, measurements had to be taken throughout the pipeline to measure methane emissions from technological discharges and leaks at the pipeline fittings and vents. Although the majority of the natural gas leaks were carbon dioxide, a significant amount of methane was also being consistently released from the pipeline as a result of leaks and breakdowns. In 2001, natural gas emissions from the pipeline and natural gas transportation system accounted for 1 percent of the natural gas produced.[85] Fortunately, between 2001 and 2005, this number reduced to 0.7 percent, and even the 2001 value is still significantly less than that of 1996.[85]
General industrial causes[]
However, pipeline transportation is only one part of the problem. Howarth[86] et al. have argued that:
We believe the preponderance of evidence indicates shale gas has a larger GHG [green house gas] footprint than conventional gas, considered over any time scale. The GHG footprint of shale gas also exceeds that of oil or coal when considered at decadal time scales, […]
For subsequent works confirming these results see Howarth's "A bridge to nowhere: methane emissions and the greenhouse gas footprint of natural gas",[87] "Methane emissions and climatic warming risk from hydraulic fracturing and shale gas development: implications for policy".[88] A 2013 study[89] by Miller et al. indicates that current greenhouse gas reduction policies in the US are based on what appear to be significant underestimates of anthropogenic methane emissions. The authors state:
We find greenhouse gas emissions from agriculture and fossil fuel extraction and processing (i.e., oil and/or natural gas) are likely a factor of two or greater than cited in existing studies.
Release of stored arctic methane due to global warming[]
Global warming due to fossil fuel emissions has caused Arctic methane release, i.e. the release of methane from seas and soils in permafrost regions of the Arctic. Although in the long term, this is a natural process, methane release is being exacerbated and accelerated by global warming. This results in negative effects, as methane is itself a powerful greenhouse gas.
The Arctic region is one of the many natural sources of the greenhouse gas methane.[90] Global warming accelerates its release, due to both release of methane from existing stores, and from methanogenesis in rotting biomass.[91] Large quantities of methane are stored in the Arctic in natural gas deposits, permafrost, and as undersea clathrates. Permafrost and clathrates degrade on warming,[92] thus large releases of methane from these sources may arise as a result of global warming.[93][94][95] Other sources of methane include submarine taliks, river transport, ice complex retreat, submarine permafrost and decaying gas hydrate deposits.[96]
Atmospheric impacts[]
The direct radiative greenhouse gas forcing effect has been estimated at 0.5 W/m2.[97]
Methane is a strong GHG with a global warming potential 84 times greater than CO2 in a 20-year time frame. Methane is not as persistent a gas and tails off to about 28 times greater than CO2 for a 100-year time frame.[6]
In addition to the direct heating effect and the normal feedbacks, the methane breaks down to carbon dioxide and water. This water is often above the tropopause where little water usually reaches. Ramanathan (1988)[99] notes that both water and ice clouds, when formed at cold lower stratospheric temperatures, are extremely efficient in enhancing the atmospheric greenhouse effect. He also notes that there is a distinct possibility that large increases in future methane may lead to a surface warming that increases nonlinearly with the methane concentration.
Ozone layer[]
Methane also affects the degradation of the ozone layer, when methane is transformed into water in the stratosphere. This process is enhanced by global warming, because warmer air holds more water vapor than colder air, so the amount of water vapor in the atmosphere increases as it is warmed by the greenhouse effect. Climate models also indicate that greenhouse gases such as carbon dioxide and methane may enhance the transport of water into the stratosphere; though this is not fully understood.[100]
Methane management techniques[]
In an effort to mitigate climate change, humans have started to develop alternative methods and medicines.
For example, in order to counteract the amount of methane that ruminants give off, a type of drug called monensin (marketed as rumensin™) has been developed. This drug is classified as an ionophore, which is an antibiotic that is naturally produced by a harmless bacteria strain. This drug not only improves feed efficiency but also reduces the amount of methane gas emitted from the animal and its manure.[101]
In addition to medicine, specific manure management techniques have been developed to counteract emissions from livestock manure. Educational resources have begun to be provided for small farms. Management techniques include daily pickup and storage of manure in a completely closed off storage facility that will prevent runoff from making it into bodies of water. The manure can then be kept in storage until it is either reused for fertilizer or taken away and stored in an offsite compost. Nutrient levels of various animal manures are provided for optimal use as compost for gardens and agriculture.[102]
In order to reduce effects on methane oxidation in soil, several steps can be taken. Controlling the usage of nitrogen enhancing fertilizer and reducing the amount of nitrogen pollution into the air can both lower inhibition of methane oxidation. Additionally, using drier growing conditions for crops such as rice and selecting strains of crops that produce more food per unit area can reduce the amount of land with ideal conditions for methanogenesis. Careful selection of areas of land conversion (for example, plowing down forests to create agricultural fields) can also reduce the destruction of major areas of methane oxidation.
To counteract methane emissions from landfills, on March 12, 1996, the EPA (Environmental Protection Agency) added the "Landfill Rule" to the Clean Air Act. This rule requires large landfills that have ever accepted municipal solid waste, have been used as of November 8, 1987, can hold at least 2.5 million metric tons of waste with a volume greater than 2.5 million cubic meters, and/or have nonmethane organic compound (NMOC) emissions of at least 50 metric tons per year to collect and combust emitted landfill gas.[103] This set of requirements excludes 96% of the landfills in the USA. While the direct result of this is landfills reducing emission of non-methane compounds that form smog, the indirect result is reduction of methane emissions as well.
Furthermore, in an attempt to absorb the methane that is already being produced from landfills, experiments in which nutrients were added to the soil to allow methanotrophs to thrive have been conducted. These nutrient supplemented landfills have been shown to act as a small scale methane sink, allowing the abundance of methanotrophs to sponge the methane from the air to use as energy, effectively reducing the landfill's emissions.[104]
To reduce emissions from the natural gas industries, the EPA developed the Natural Gas STAR Program, also known as Gas STAR.[67]
Another program was also developed by the EPA to reduce emissions from coal mining. The Coalbed Methane Outreach Program (CMOP) helps and encourages the mining industry to find ways to use or sell methane that would otherwise be released from the coal mine into the atmosphere.[67]
Methane emissions monitoring[]
A portable methane detector has been developed which, mounted in a vehicle, can detect excess levels of methane in the ambient atmosphere and differentiate between natural methane from rotting vegetation or manure and gas leaks. As of 2013 the technology was being deployed by Pacific Gas & Electric.[105]
The Tropospheric Monitoring Instrument aboard the European Space Agency's Sentinel-5P spacecraft launched in October 2017 provides the most detailed methane emissions monitoring which is publicly available. It has a resolution of about 50 square kilometres.[106]
MethaneSat is under development by the Environmental Defense Fund in partnership with researchers at Harvard University, to monitor methane emissions with an improved resolution of 1 kilometer. MethaneSAT is designed to monitor 50 major oil and gas facilities, and could also be used for monitoring of landfills and agriculture. It receives funding from Audacious Project (a collaboration of TED and the Gates Foundation), and is projected to launch as soon as 2020.[106][107][108]
Measurement of atmospheric methane[]
Gas chromatography[]
Methane is typically measured using gas chromatography. Gas chromatography is a type of chromatography used for separating or analyzing chemical compounds. It is less expensive in general, compared to more advanced methods, but it is more time and labor-intensive.
Spectroscopic method[]
Spectroscopic methods are the preferred method for atmospheric gas measurements due to its sensitivity and precision. Also, spectroscopic methods are the only way of remotely sensing the atmospheric gases. Infrared spectroscopy covers a large spectrum of techniques, one of which detects gases based on absorption spectroscopy. There are various methods for spectroscopic methods, including Differential optical absorption spectroscopy, Laser-induced fluorescence, and Fourier Transform Infrared.
Cavity ring-down spectroscopy[]
Cavity ring-down spectroscopy is most widely used IR absorption technique of detecting methane. It is a form of laser absorption spectroscopy which determines the mole fraction to the order of parts per trillion.[109]
See also[]
- Climate change
- Global warming
Notes[]
- ^ Jump up to: a b Rice included under wetlands.
- ^ Jump up to: a b Landfills total includes domestic sewage and animal waste.
- ^ Jump up to: a b Waste treatment included under ruminants.
- ^ Contains a small amount of natural emissions from wild ruminants
References[]
- ^ "ESRL/GMD FTP Data Finder". Retrieved March 28, 2017.
- ^ [1] GMAO Chemical Forecasts and GEOS–CHEM NRT Simulations for ICARTT (top) and Randy Kawa, NASA GSFC Atmospheric Chemistry and Dynamics Branch (lower).
- ^ Dlugokencky, Ed (December 5, 2016). "Trends in Atmospheric Methane". Global Greenhouse Gas Reference Network. NOAA Earth System Research Laboratory. Retrieved December 22, 2016.
- ^ "Methane in the atmosphere is surging, and that's got scientists worried". Los Angeles Times. March 1, 2019. Retrieved March 1, 2019.
- ^ Methane: The other important greenhouse gas Environmental Defence Fund
- ^ Jump up to: a b Myhre, Gunnar; et al. (2013). Stocker, T.F.; Qin, D.; Plattner, G.-K.; Tignor, M.; Allen, S.K.; Boschung, J.; Nauels, A.; Xia, Y.; Bex, V.; Midgley, P.M. (eds.). Anthropogenic and Natural Radiative Forcing (PDF). Climate Change 2013: The Physical Science Basis. Contribution of Working Group I to the Fifth Assessment Report of the Intergovernmental Panel on Climate Change. Cambridge, United Kingdom and New York, USA: Cambridge University Press. Retrieved December 22, 2016. See Table 8.7.
- ^ Drew T. Shindell; Greg Faluvegi; Dorothy M. Koch; Gavin A. Schmidt; Nadine Unger; Susanne E. Bauer (2009). "Improved attribution of climate forcing to emissions". Science. 326 (5953): 716–718. Bibcode:2009Sci...326..716S. doi:10.1126/science.1174760. PMID 19900930. S2CID 30881469.
- ^ Earth System Research Laboratory Global Monitoring Division, NOAA, September 15, 2021
- ^ IPCC AR5 WG1 (2013). "Climate Change 2013: The Physical Science Basis – Summary for Policymakers" (PDF). Cambridge University Press.
- ^ Volodin, E. M. (May 2015). "Influence of methane sources in Northern Hemisphere high latitudes on the interhemispheric asymmetry of its atmospheric concentration and climate". Izvestiya, Atmospheric and Oceanic Physics. 51 (3): 251–258. Bibcode:2015IzAOP..51..251V. doi:10.1134/S0001433815030123. S2CID 118933772.
- ^ Crevoisier, C.; et al. (September 2012). "The 2007–2011 evolution of tropical methane in the mid-troposphere as seen from space by MetOp-A/IASI" (PDF). Atmospheric Chemistry and Physics Discussions. 12 (9): 23731–23757. Bibcode:2012ACPD...1223731C. doi:10.5194/acpd-12-23731-2012.
- ^ How long do greenhouse gases stay in the air?
- ^ Gale, Joseph (2009). Astrobiology of Earth : the emergence, evolution, and future of life on a planet in turmoil. Oxford: Oxford University Press. ISBN 978-0-19-920580-6.
- ^ Pavlov, Alexander A.; et al. (January 2003). "Methane-rich Proterozoic atmosphere?". Geology. 31 (1): 87–90. Bibcode:2003Geo....31...87P. doi:10.1130/0091-7613(2003)031<0087:MRPA>2.0.CO;2.
- ^ Saunois, Marielle; Bousquet, Philippe; Poulter, Ben; Peregon, Anna; Ciais, Philippe; Canadell, Josep G.; Dlugokencky, Edward J.; Etiope, Giuseppe; Bastviken, David (December 12, 2016). "The global methane budget 2000–2012". Earth System Science Data. 8 (2): 697–751. Bibcode:2016ESSD....8..697S. doi:10.5194/essd-8-697-2016. ISSN 1866-3516.
- ^ Houghton, J.T., ed. (2001). Climate change 2001 : the scientific basis : contribution of Working Group I to the third assessment report of the Intergovernmental Panel on Climate Change. Cambridge: Cambridge University Press. ISBN 978-0521807678. OCLC 46634335.
- ^ Jump up to: a b c d Warneck, Peter (2000). Chemistry of the Natural Atmosphere. Academic Press. ISBN 9780127356327.
- ^ Wedderburn-Bisshop, Gerard et al (2015). "Neglected transformational responses: implications of excluding short lived emissions and near term projections in greenhouse gas accounting". The International Journal of Climate Change: Impacts and Responses. RMIT Common Ground Publishing. Retrieved August 16, 2017.
- ^ Jump up to: a b c d Stocker, Thomas (ed.). Climate change 2013 : the physical science basis : Working Group I contribution to the Fifth Assessment Report of the Intergovernmental Panel on Climate Change. New York. ISBN 978-1-10741-532-4. OCLC 881236891.
- ^ Jain, Atul K.; Briegleb, Bruce P.; Minschwaner, K.; Wuebbles, Donald J. (August 1, 2000). "Radiative forcings and global warming potentials of 39 greenhouse gases". Journal of Geophysical Research: Atmospheres. 105 (D16): 20773–20790. Bibcode:2000JGR...10520773J. doi:10.1029/2000jd900241. ISSN 0148-0227.
- ^ Jump up to: a b Laboratory, US Department of Commerce, NOAA, Earth System Research (September 7, 2021). "ESRL Global Monitoring Division – Global Greenhouse Gas Reference Network". www.esrl.noaa.gov. Retrieved September 16, 2021.
- ^ Kirschke, Stefanie; et al. (September 22, 2013). "Three decades of global methane sources and sinks". Nature Geoscience. 6 (10): 813–823. Bibcode:2013NatGe...6..813K. doi:10.1038/ngeo1955.
- ^ Jump up to: a b "Trace Gases: Current Observations, Trends, and Budgets". Climate Change 2001, IPCC Third Assessment Report. IPCC/United Nations Environment Programme.
- ^ Dlugokencky, E. J.; et al. (May 2011). "Global atmospheric methane: budget, changes and dangers". Philosophical Transactions of the Royal Society A: Mathematical, Physical and Engineering Sciences. 369 (1943): 2058–2072. Bibcode:2011RSPTA.369.2058D. doi:10.1098/rsta.2010.0341. PMID 21502176.
- ^ The growing role of methane in anthropogenic climate change, by M Saunois, R B Jackson, P Bousquet, B Poulter, and J G Canadell (2016), Environmental Research Letters, vol. 11, 120207, DOI: 10.1088/1748-9326/11/12/120207.
- ^ Saunois, M., Bousquet, M., Poulter, B.; et al. (December 12, 2016). "The Global Methane Budget 2000–2012". Earth System Science Data. 8 (2): 697–751. Bibcode:2016ESSD....8..697S. doi:10.5194/essd-8-697-2016. ISSN 1866-3508. Retrieved August 28, 2020.CS1 maint: multiple names: authors list (link)
- ^ Jump up to: a b Saunois, M., Stavert, A.R., Poulter, B.; et al. (July 15, 2020). "The Global Methane Budget 2000–2017". Earth System Science Data. 12 (3): 1561–1623. Bibcode:2020ESSD...12.1561S. doi:10.5194/essd-12-1561-2020. ISSN 1866-3508. Retrieved August 28, 2020.CS1 maint: multiple names: authors list (link)
- ^ Augenbraun, Harvey; Matthews, Elaine; Sarma, David (1997). "The Global Methane Cycle". Website. National Aeronautics and Space Administration, Goddard Institute for Space Studies, GISS Institute on Climate and Planets. Archived from the original on March 4, 2016. Retrieved March 17, 2016.
- ^ Bruhn, D.; et al. (March 2014). "Leaf surface wax is a source of plant methane formation under UV radiation and in the presence of oxygen". Plant Biology. 16 (2): 512–516. doi:10.1111/plb.12137. PMID 24400835.
- ^ Jump up to: a b c Bubier, Jill L.; Moore, Tim R. (December 1994). "An ecological perspective on methane emissions from northern wetlands". Trends in Ecology and Evolution. 9 (12): 460–464. doi:10.1016/0169-5347(94)90309-3. PMID 21236923.
- ^ Macdonald, J. A.; et al. (1998). "Methane emission rates from a northern wetland; response to temperature, water table and transport". Atmospheric Environment. 32 (19): 3219–3227. Bibcode:1998AtmEn..32.3219M. doi:10.1016/S1352-2310(97)00464-0.
- ^ Gedney, N.; et al. (October 2004). "Climate feedback from wetland methane emissions". Geophysical Research Letters. 31 (20): L20503. Bibcode:2004GeoRL..3120503G. doi:10.1029/2004GL020919. L20503.
- ^ Per this source:
:Mason-Jones, David (2012). Should Meat be on the Menu?. Momentum. p. 103. ISBN 978-1743340608.
research in the Snowy Mountains region of Australia showed 8 tonnes of methane oxidized by methanotrophic bacteria per year on a 1,000 hectare farm. 200 cows on the same farm emitted 5.4 tonnes of methane per year. Hence, one cow emitted 27 kg of methane per year, while the bacteria oxidized 8 kg per hectare. The emissions of one cow were oxidized by 27/8 ≈ 3.4 hectare. - ^ Margonelli, Lisa (September 2008). "Gut Reactions". The Atlantic. Retrieved January 16, 2012.
- ^ Jump up to: a b c d "Ch.2 Changes in Atmospheric Constituents and in Radiative Forcing". Climate Change 2007 IPCC Fourth Assessment Report. IPPC. Retrieved January 20, 2017.
- ^ Keppler, Frank; Hamilton, John T. G.; Brass, Marc; Rockman, Thomas (November 3, 2005). "Methane emissions from terrestrial plants under aerobic conditions". Nature. 439 (7073): 187–191. Bibcode:2006Natur.439..187K. doi:10.1038/nature04420. ISSN 0028-0836. PMID 16407949. S2CID 2870347.
- ^ Hirsch, Tim (January 11, 2006). "Plants revealed as methane source". BBC News. Archived from the original on October 13, 2006. Retrieved September 7, 2006.
- ^ Keppler, Frank; Hamilton, John T. G.; Brass, Marc; Rockman, Thomas (January 18, 2006). "Global warming – the blame is not with the plants". EurekAlert!. American Association for the Advancement of Science. Archived from the original on September 1, 2006. Retrieved September 6, 2006.
- ^ Duek, Tom A.; Ries de Visser; Hendrik Poorter; Stefan Persijn; Antonie Gorissen; Willem de Visser; Ad Schapendonk; Jan Verhagen; Jan Snel; Frans J. M. Harren; Anthony K. Y. Ngai; Francel Verstappen; Harro Bouwmeester; Laurentius A. C. J. Voesenek; Adrie van der Werf (March 30, 2007). "No evidence for substantial aerobic methane emission by terrestrial plants: a 13C-labelling approach". New Phytologist. 175 (1): 29–35. doi:10.1111/j.1469-8137.2007.02103.x. PMID 17547664.
- ^ Jump up to: a b c "Methane and Nitrous Oxide Emissions From Natural Sources" (PDF). USA Environmental Protection Agency Office of Atmospheric Programs. April 2010. Archived from the original (PDF) on December 2, 2012. Retrieved January 20, 2017.
- ^ Carmichael, J.; et al. (June 2014). "The role of vegetation in methane flux to the atmosphere: should vegetation be included as a distinct category in the global methane budget?". Biogeochemistry. 119 (1): 1–24. doi:10.1007/s10533-014-9974-1. S2CID 13533695.
- ^ Bowen, Gabriel J.; et al. (December 15, 2014). "Two massive, rapid releases of carbon during the onset of the Palaeocene–Eocene thermal maximum". Nature Geoscience. 8 (1): 44–47. Bibcode:2015NatGe...8...44B. doi:10.1038/ngeo2316.
- ^ Benton, Michael J.; Twitchett, Richard J. (July 2003). "How to kill (almost) all life: the end-Permian extinction event". Trends in Ecology & Evolution. 18 (7): 358–365. doi:10.1016/S0169-5347(03)00093-4.
- ^ Archer, D. (July 2007). "Methane hydrate stability and anthropogenic climate change". Biogeosciences. 4 (4): 521–544. Bibcode:2007BGeo....4..521A. doi:10.5194/bg-4-521-2007.
- ^ "Methane bubbles climate trouble". BBC News. September 7, 2006. Retrieved September 7, 2006.
- ^ Walter, K. M.; et al. (September 2006). "Methane bubbling from Siberian thaw lakes as a positive feedback to climate warming". Nature. 443 (7107): 71–75. Bibcode:2006Natur.443...71W. doi:10.1038/nature05040. PMID 16957728. S2CID 4415304.
- ^ Abraham, John (October 13, 2015). "Methane release from melting permafrost could trigger dangerous global warming". Newspaper. The Guardian. Retrieved October 13, 2015.
- ^ Dyonisius, M. N. (February 2020). "Old carbon reservoirs were not important in the deglacial methane budget" (PDF). Science. 367 (6480): 907–910. Bibcode:2020Sci...367..907D. doi:10.1126/science.aax0504. PMID 32079770. S2CID 211230350.
- ^ "Technical summary". Climate Change 2001. United Nations Environment Programme.
- ^ Mitchell, Logan; et al. (November 2013). "Constraints on the Late Holocene Anthropogenic Contribution to the Atmospheric Methane Budget". Science. 342 (6161): 964–966. Bibcode:2013Sci...342..964M. doi:10.1126/science.1238920. PMID 24264988. S2CID 39963336.
- ^ McGrath, Matt (August 11, 2021). "Climate change: Curbing methane emissions will 'buy us time'". BBC News. Retrieved August 11, 2021.
- ^ Ramirez, Rachel. "Scientists say this invisible gas could seal our fate on climate change". CNN. Retrieved August 11, 2021.
- ^ Nazaries, Loïc; et al. (September 2013). "Methane, microbes and models: fundamental understanding of the soil methane cycle for future predictions". Environmental Microbiology. 15 (9): 2395–2417. doi:10.1111/1462-2920.12149. PMID 23718889.
- ^ "Livestock a major threat to environment". United Nations Food and Agriculture Organization. November 29, 2006. Retrieved November 4, 2011.
- ^ "Methane Explosion Warmed the Prehistoric Earth". NASA GISS: Research News. December 10, 2010. Retrieved November 3, 2011.
- ^ Shindell, 2 Greg; Faluvegi, G.; Koch, Dorothy M.; Schmidt, Gavin A.; Unger, Nadine; Bauer, Susanne E. (October 30, 2009). "Improved Attribution of Climate Forcing to Emissions". Science. 326 (5953): 716–718. Bibcode:2009Sci...326..716S. doi:10.1126/science.1174760. PMID 19900930. S2CID 30881469.
- ^ Vergano, Dan (October 29, 2009). "Methane's role in global warming underestimated". USA Today.
- ^ Pagnamenta, Robin (October 27, 2009). "Climate chief Lord Stern give up meat to save the planet". The Times. London.
- ^ Gary Polakovic (June 7, 2003). "Getting the Cows to Cool It". The Los Angeles Times. Retrieved November 4, 2011.
- ^ Rachel Nowak (September 25, 2004). "Burp vaccine cuts greenhouse gas emissions". New Scientist. Retrieved November 4, 2011.
- ^ "New company to reduce cows' methane using feed additive made from the seaweed". The Cattle Site. September 22, 2020.
- ^ "Methane Sources – Rice Paddies". GreenHouse Gas Online.org. 2008. Retrieved November 11, 2011.
- ^ "Methane emission and rice agriculture" (PDF). www.ias.ac.in. Indian Academy of Sciences. Retrieved October 11, 2016.
- ^ Jump up to: a b c d Ruddiman, William F. (December 2003). "The Anthropogenic Greenhouse Era Began Thousands of Years Ago". Climatic Change. 61 (3): 261–293. CiteSeerX 10.1.1.651.2119. doi:10.1023/B:CLIM.0000004577.17928.fa. S2CID 2501894.
- ^ "Greenhouse Gas Emissions". United States Environmental Protection Agency. Retrieved March 21, 2013.
- ^ Themelis, Nickolas J.; Ulloa, Priscilla A. (June 2007). "Methane generation in landfills". Renewable Energy. 32 (7): 1243–1257. doi:10.1016/j.renene.2006.04.020. Retrieved December 31, 2016.
- ^ Jump up to: a b c d "Sources and Emissions". US Environmental Protection Agency. July 12, 2006. Archived from the original on July 12, 2006. Retrieved January 20, 2017.
- ^ Jump up to: a b "Inventory of U.S. Greenhouse Gas Emissions and Sinks: 1990–2015" (PDF).
- ^ Jump up to: a b Alvarez, Ramón A.; Zavala-Araiza, Daniel; Lyon, David R.; Allen, David T.; Barkley, Zachary R.; Brandt, Adam R.; Davis, Kenneth J.; Herndon, Scott C.; Jacob, Daniel J. (July 13, 2018). "Assessment of methane emissions from the U.S. oil and gas supply chain". Science. 361 (6398): 186–188. Bibcode:2018Sci...361..186A. doi:10.1126/science.aar7204. ISSN 0036-8075. PMC 6223263. PMID 29930092.
- ^ Jump up to: a b Gass, Henry (October 10, 2014). "How scientists overlooked a 2,500-square-mile cloud of methane over the Southwest". Christian Science Monitor. Retrieved October 24, 2014.
- ^ Ambrose, Jillian (November 15, 2019). "Methane emissions from coalmines could stoke climate crisis – study". The Guardian. ISSN 0261-3077. Retrieved November 15, 2019.
- ^ Loïc Jounot (2006). "Tropospheric Chemistry". University of Toronto Atmospheric Physics Department. Archived from the original on June 17, 2008. Retrieved July 18, 2008.
- ^ Jump up to: a b c Reay, Dave. "Methane Sinks − Soils". Greenhouse Gas Online. Retrieved December 22, 2016.
- ^ Holmes, C. D.; et al. (January 2013). "Future methane, hydroxyl, and their uncertainties: key climate and emission parameters for future predictions" (PDF). Atmospheric Chemistry and Physics. 13 (1): 285–302. Bibcode:2013ACP....13..285H. doi:10.5194/acp-13-285-2013. See Table 2.
- ^ Rohs, S.; Schiller, C.; Riese, M.; Engel, A.; Schmidt, U.; Wetter, T.; Levin, I.; Nakazawa, T. (July 2006). "Long-term changes of methane and hydrogen in the stratosphere in the period 1978–2003 and their impact on the abundance of stratospheric water vapor" (PDF). Journal of Geophysical Research: Atmospheres. 111 (D14): D14315. Bibcode:2006JGRD..11114315R. doi:10.1029/2005JD006877. D14315.
- ^ Rohs, S.; Schiller, C.; Riese, M.; Engel, A.; Schmidt, U.; Wetter, T.; Levin, I.; Nakazawa, T.; Aoki, S. (2006). "Long-term changes of methane and hydrogen in the stratosphere in the period 1978–2003 and their impact on the abundance of stratospheric water vapor" (PDF). Journal of Geophysical Research. 111 (D14): D14315. Bibcode:2006JGRD..11114315R. doi:10.1029/2005jd006877. ISSN 0148-0227.
- ^ Oeste, F. D., de Richter, R., Ming, T., and Caillol, S.: Climate engineering by mimicking natural dust climate control: the iron salt aerosol method, Earth Syst. Dynam., 8, 1–54, https://doi.org/10.5194/esd-8-1-2017, 2017.
- ^ "Scientists pinpoint cause of slowing methane emissions". National Oceanic & Atmospheric Administration news Online. September 28, 2006. Archived from the original on May 26, 2007. Retrieved May 23, 2007.
- ^ Denman, K.L.; et al. "7. Couplings Between Changes in the Climate System and Biogeochemistry". IPCC AR4 WG1 2007. Retrieved November 4, 2011.
- ^ "Annual Greenhouse Gas Index (AGGI) Indicates Sharp Rise in Carbon Dioxide and Methane in 2007". National Oceanic & Atmospheric Administration – Earth System Research Laboratory. April 23, 2008. Retrieved June 16, 2008.
- ^ Heidi Blake (February 22, 2010). "Climate change could be accelerated by 'methane time bomb'". The Telegraph. Archived from the original on February 25, 2010.
- ^ McKie, Robin (February 17, 2019). "Sharp rise in methane levels threatens world climate targets". The Observer. ISSN 0029-7712. Retrieved July 14, 2019.
- ^ ● "Climate Change Indicators: Climate Forcing". EPA.gov. United States Environmental Protection Agency. 2021. Archived from the original on May 9, 2021.
● EPA credits data from "NOAA's Annual Greenhouse Gas Index (An Introduction)". NOAA.gov. National Oceanographic and Atmospheric Administration (Global Monitoring Laboratory, Earth System Research Laboratories). December 2020. Archived from the original on May 13, 2021. - ^ "Fracking boom tied to methane spike in Earth's atmosphere". National Geographic. August 15, 2019. Retrieved August 20, 2019.
- ^ Jump up to: a b c Lechtenböhmer, Stephan; et al. (2005). "Greenhouse Gas Emissions from the Russian Natural Gas Export Pipeline System" (PDF). Wuppertal Institute for Climate, Environment and Energy. Archived from the original (PDF) on March 14, 2012. Retrieved December 31, 2016.
- ^ Howarth, Robert W.; Santoro, Renee; Ingraffea, Anthony (January 10, 2012). "Venting and leaking of methane from shale gas development: response to Cathles et al" (PDF). Climatic Change. 113 (2): 537–549. Bibcode:2012ClCh..113..537H. doi:10.1007/s10584-012-0401-0. S2CID 154324540. Retrieved December 22, 2016.
- ^ Howarth, Robert W. (June 1, 2014). "A bridge to nowhere: methane emissions and the greenhouse gas footprint of natural gas". Energy Sci Eng. 2 (2): 47–60. doi:10.1002/ese3.35.
- ^ Howarth, Robert (October 8, 2015). "Methane emissions and climatic warming risk from hydraulic fracturing and shale gas development: implications for policy". Energy and Emission Control Technologies. 3: 45. doi:10.2147/EECT.S61539.
- ^ Miller, Scot M.; Wofsy, Steven C.; Michalak, Anna M.; Kort, Eric A.; Andrews, Arlyn E.; Biraud, Sebastien C.; Dlugokencky, Edward J.; Eluszkiewicz, Janusz; Fischer, Marc L.; Janssens-Maenhout, Greet; Miller, Ben R.; Miller, John B.; Montzka, Stephen A.; Nehrkorn, Thomas; Sweeney, Colm (December 10, 2013). "Anthropogenic emissions of methane in the United States". PNAS. 110 (50): 20018–20022. Bibcode:2013PNAS..11020018M. doi:10.1073/pnas.1314392110. PMC 3864315. PMID 24277804.
- ^ Bloom, A. A.; Palmer, P. I.; Fraser, A.; Reay, D. S.; Frankenberg, C. (2010). "Large-Scale Controls of Methanogenesis Inferred from Methane and Gravity Spaceborne Data" (PDF). Science. 327 (5963): 322–325. Bibcode:2010Sci...327..322B. doi:10.1126/science.1175176. PMID 20075250. S2CID 28268515.
- ^ Walter, K. M.; Chanton, J. P.; Chapin, F. S.; Schuur, E. A. G.; Zimov, S. A. (2008). "Methane production and bubble emissions from arctic lakes: Isotopic implications for source pathways and ages". Journal of Geophysical Research. 113 (G3): G00A08. Bibcode:2008JGRG..113.0A08W. doi:10.1029/2007JG000569.
- ^ Carrington, Damian, First active leak of sea-bed methane discovered in Antarctica, The Guardian, July 21, 2020
- ^ Zimov, Sa; Schuur, Ea; Chapin, Fs 3Rd (June 2006). "Climate change. Permafrost and the global carbon budget". Science. 312 (5780): 1612–3. doi:10.1126/science.1128908. ISSN 0036-8075. PMID 16778046. S2CID 129667039.
- ^ Shakhova, Natalia (2005). "The distribution of methane on the Siberian Arctic shelves: Implications for the marine methane cycle". Geophysical Research Letters. 32 (9): L09601. Bibcode:2005GeoRL..32.9601S. doi:10.1029/2005GL022751.
- ^ Reuters (June 18, 2019). "Scientists shocked by Arctic permafrost thawing 70 years sooner than predicted". The Guardian. ISSN 0261-3077. Retrieved July 14, 2019.
- ^ Shakhova, Natalia; Semiletov, Igor (2007). "Methane release and coastal environment in the East Siberian Arctic shelf". Journal of Marine Systems. 66 (1–4): 227–243. Bibcode:2007JMS....66..227S. CiteSeerX 10.1.1.371.4677. doi:10.1016/j.jmarsys.2006.06.006.
- ^ "AR4 Fig 2.4". Climate Change 2007. United Nations Environment Programme.
- ^ "Methane | Reg Morrison". regmorrison.edublogs.org. Retrieved November 24, 2018.
- ^ "Ramanathan". Trace-Gas Greenhouse Effect and Global Warming: Underlying Principles and Outstanding Issues. Ambio-Royal Swedish Academy of sciences.
- ^ Drew Shindell (2001). "Wetter Upper Atmosphere May Delay Global Ozone Recovery". NASA.
- ^ Hutjens, Mike (August 21, 2012). "Use of Rumensin in Dairy Diets". eXtension. Archived from the original on July 9, 2010. Retrieved February 27, 2011.
- ^ Bradley, Athena Lee (June 2008). "Manure Management for Small and Hobby Farms" (PDF). Northeast Recycling Council, Inc. Retrieved December 31, 2016.
- ^ "Landfill Methane Energy Recovery". Power Partners. December 11, 2009. Archived from the original on September 29, 2015. Retrieved December 31, 2016.
- ^ Lizik, William; Im, Jeongdae; Semrau, Jeremy D.; Barcelona, Michael J. (2013). "A field trial of nutrient stimulation of methanotrophs to reduce greenhouse gas emissions from landfill cover soils". Journal of the Air & Waste Management Association. 63 (3): 300–309. doi:10.1080/10962247.2012.755137. PMID 23556240.
- ^ Wald, Matthew L. (August 6, 2013). "New Tools Pinpoint Natural Gas Leaks, Maximizing a Fuel's Green Qualities". The New York Times. Retrieved August 7, 2013.
- ^ Jump up to: a b Tollefson, Jeff (April 11, 2018). "US environmental group wins millions to develop methane-monitoring satellite". Nature. 556 (7701): 283. Bibcode:2018Natur.556..283T. doi:10.1038/d41586-018-04478-6. PMID 29666485.
- ^ Carrington, Damian (April 12, 2018). "New satellite to spot planet-warming industrial methane leaks". The Guardian. ISSN 0261-3077. Retrieved December 19, 2019.
- ^ Foust, Jeff (January 11, 2019). "Ball and SSL win study contracts for methane emission tracking satellite". SpaceNews.com. Retrieved December 19, 2019.
- ^ Nakaema, Walter M.; Hao, Zuo-Qiang; Rohwetter, Philipp; Wöste, Ludger; Stelmaszczyk, Kamil (January 27, 2011). "PCF-Based Cavity Enhanced Spectroscopic Sensors for Simultaneous Multicomponent Trace Gas Analysis". Sensors. 11 (2): 1620–1640. Bibcode:2011Senso..11.1620N. doi:10.3390/s110201620. ISSN 1424-8220. PMC 3274003. PMID 22319372.
External links[]
- Global Methane Assessment: Benefits and Costs of Mitigating Methane Emissions By UN Environment Programme, 2021.
- "Methane in tundra and oceans to be released in atmosphere"
- "Methane hydrate stability and anthropogenic climate change" Biogeosciences Discussions, 4, 993–1057, 2007
- "Methane: A Scientific Journey from Obscurity to Climate Super-Stardom" September 2004 background report from NASA Goddard Institute for Space Studies (GISS)
- Methane's Role In Climate Change:Whether natural gas is a savior or destroyer of climate depends on how much is leaking into the atmosphere, By Jeff Johnson, Chemical & Engineering News.
- Study Suggests EPA May Seriously Underestimate Methane Gas Emissions
- Methane Levels Are Rising, and Scientists Don't Know Why, By Roni Dengler | June 6, 2019
- Very Strong Atmospheric Methane Growth in the 4 Years 2014–2017: Implications for the Paris Agreement, February 5, 2019.
- Why is methane rising?, Julia Fahrenkamp-Uppenbrink, Jun 7, 2019.
- Methane emissions from oil and gas exploration are under-reported June 26, 2019.
| show Climate change |
|---|
- Methane
- Atmosphere
- Greenhouse gases