Climate change in the Arctic
Climate change in the Arctic is causing major environmental issues. These range from the well known, such as the loss of sea ice or melting of the Greenland ice sheet, to more obscure, but deeply significant issues, such as permafrost thaw,[1] social consequences for locals and the geopolitical ramifications of these changes.[2]
These effects are wide-ranging and can be seen in many Arctic systems, from fauna and flora to territorial claims.[2] Temperatures in the region are rising twice as fast as elsewhere on Earth, leading to these effects worsening year on year and causing significant concern. The changing Arctic has global repercussions, perhaps via ocean circulation changes[3] or arctic amplification.[4]
Rising temperatures[]

According to the Intergovernmental Panel on Climate Change, "surface air temperatures (SATs) in the Arctic have warmed at approximately twice the global rate".[5] The period of 1995–2005 was the warmest decade in the Arctic since at least the 17th century, with temperatures 2 °C (3.6 °F) above the 1951–1990 average.[6] In addition, since 2013, Arctic annual mean SAT has been at least 1 °C (1.8 °F) warmer than the 1981-2010 mean. With 2020 having the second warmest SAT anomaly after 2016, being 1.9 °C (3.4 °F) warmer than the 1981-2010 average.[7]
Some regions within the Arctic have warmed even more rapidly, with Alaska and western Canada's temperature rising by 3 to 4 °C (5.40 to 7.20 °F).[8] This warming has been caused not only by the rise in greenhouse gas concentration, but also the deposition of soot on Arctic ice.[9] A 2013 article published in Geophysical Research Letters has shown that temperatures in the region haven't been as high as they currently are since at least 44,000 years ago and perhaps as long as 120,000 years ago. The authors conclude that "anthropogenic increases in greenhouse gases have led to unprecedented regional warmth."[10][11]
On 20 June 2020, for the first time, a temperature measurement was made inside the Arctic Circle of 38 °C, more than 100 °F. This kind of weather was expected in the region only by 2100. In March, April and May the average temperature in the Arctic was 10 °C higher than normal.[12][13] This heat wave, without human - induced warming, could happen only one time in 80,000 years, according to an attribution study published in July 2020. It is the strongest link of a weather event to anthropogenic climate change that had been ever found, for now.[14] Such heat waves are generally a result of an unusual state of the jet stream. Some scientists suggest that climate change will slow the jet stream by reducing the difference in temperature between the Arctic and more southern territories, because the Arctic is warming faster. This can facilitate the occurring of such heat waves.[15] The scientists do not know if the 2020 heat wave is the result of such change.[16]
Arctic amplification[]
The poles of the Earth are more sensitive to any change in the planet's climate than the rest of the planet. In the face of ongoing global warming, the poles are warming faster than lower latitudes. The Arctic is warming more than twice as fast as the global average, process known as Arctic amplification (AA). The primary cause of this phenomenon is ice–albedo feedback where, by melting, ice uncovers darker land or ocean beneath, which then absorbs more sunlight, causing more heating.[17][18][19][20] A study from 2019 identified sea-ice loss under increasing CO
2 as a main driver for large AA. Thus, large AA only occurs from October to April in areas suffering from important sea-ice loss, because of the "Increased outgoing longwave radiation and heat fluxes from the newly opened waters".[21]
Arctic amplification has been argued to have significant effects on midlatitude weather, contributing to more persistent hot-dry extremes and winter continental cooling.[22][20]
Black carbon[]
Black carbon deposits (from the combustion of heavy fuel oil (HFO) of Arctic shipping) absorb solar radiation in the atmosphere and strongly reduce the albedo when deposited on snow and ice, thus accelerating the effect of the melting of snow and sea ice.[23] A 2013 study quantified that gas flaring at petroleum extraction sites contributed over 40% of the black carbon deposited in the Arctic.[24][25] Recent studies attributed the majority (56%) of Arctic surface black carbon to emissions from Russia, followed by European emissions, and Asia also being a large source.[26][23]
According to a 2015 study, reductions in black carbon emissions and other minor greenhouse gases, by roughly 60 percent, could cool the Arctic up to 0.2 °C by 2050.[27] However, a 2019 study indicates that "Black carbon emissions will continuously rise due to increased shipping activities", specifically fishing vessels.[28]
Decline of sea ice[]

Sea ice in the arctic is currently in decline in area, extent, and volume, and has been accelerating during the early twenty‐first century, with a decline rate of −4.7% per decade (it has declined over 50% since the first satellite records).[29][30][31] It is also thought that summertime sea ice may cease to exist sometime during the 21st century. This sea ice loss constitutes one of the main drivers for surface-based Arctic amplification. Sea ice area refers to the total area covered by ice, whereas sea ice extent is the area of ocean with at least 15% sea ice, while the volume is the total amount of ice in the Arctic.[32]
Changes in extent and area[]
Reliable measurement of sea ice edges began with the satellite era in the late 1970s. Before this time, sea ice area and extent were monitored less precisely by a combination of ships, buoys and aircraft.[33] The data show a long-term negative trend in recent years, attributed to global warming, although there is also a considerable amount of variation from year to year.[34] Some of this variation may be related to effects such as the Arctic oscillation, which may itself be related to global warming.[35]
The rate of the decline in entire Arctic ice coverage is accelerating. From 1979 to 1996, the average per decade decline in entire ice coverage was a 2.2% decline in ice extent and a 3% decline in ice area. For the decade ending 2008, these values have risen to 10.1% and 10.7%, respectively. These are comparable to the September to September loss rates in year-round ice (i.e., perennial ice, which survives throughout the year), which averaged a retreat of 10.2% and 11.4% per decade, respectively, for the period 1979–2007.[36]
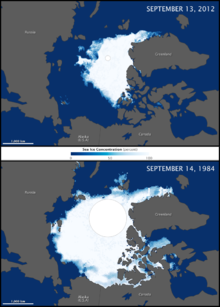
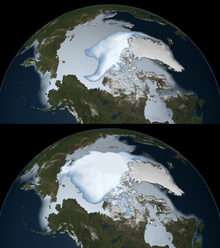
The Arctic sea ice September minimum extent (SIE) (i.e., area with at least 15% sea ice coverage) reached new record lows in 2002, 2005, 2007, 2012 (5.32 million km2), 2016 and 2019 (5.65 million km2).[37][38][31] The 2007 melt season let to a minimum 39% below the 1979–2000 average, and for the first time in human memory, the fabled Northwest Passage opened completely.[39] During July 2019 the warmest month in the Arctic was recorded, reaching the lowest SIE (7.5 million km2) and sea ice volume (8900 km3). Setting a decadal trend of SIE decline of -13%.[31] As for now, the SIE has shrink by 50% since the 1970s.[30]
From 2008 to 2011, Arctic sea ice minimum extent was higher than 2007, but it did not return to the levels of previous years.[40][41] In 2012 however, the 2007 record low was broken in late August with three weeks still left in the melt season.[42] It continued to fall, bottoming out on 16 September 2012 at 3.42 million square kilometers (1.32 million square miles), or 760,000 square kilometers (293,000 square miles) below the previous low set on 18 September 2007 and 50% below the 1979–2000 average.[43][44]
Changes in volume[]
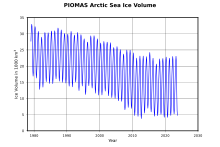
The sea ice thickness field and accordingly the ice volume and mass, is much more difficult to determine than the extension. Exact measurements can be made only at a limited number of points. Because of large variations in ice and snow thickness and consistency air- and spaceborne-measurements have to be evaluated carefully. Nevertheless, the studies made support the assumption of a dramatic decline in ice age and thickness.[40] While the Arctic ice area and extent show an accelerating downward trend, arctic ice volume shows an even sharper decline than the ice coverage. Since 1979, the ice volume has shrunk by 80% and in just the past decade the volume declined by 36% in the autumn and 9% in the winter.[46] And currently, 70% of the winter sea ice has turned into seasonal ice.[30]
An end to summer sea ice?[]
The IPCC's Fourth Assessment Report in 2007 summarized the current state of sea ice projections: "the projected reduction [in global sea ice cover] is accelerated in the Arctic, where some models project summer sea ice cover to disappear entirely in the high-emission A2 scenario in the latter part of the 21st century.″ [42] However, current climate models frequently underestimate the rate of sea ice retreat.[34] A summertime ice-free Arctic would be unprecedented in recent geologic history, as currently scientific evidence does not indicate an ice-free polar sea anytime in the last 700,000 years.[47][48]
The Arctic ocean will likely be free of summer sea ice before the year 2100, but many different dates have been projected, with models showing near-complete to complete loss in September from 2035 to some time around 2067.[49][50]
Permafrost thaw[]


Permafrost is an important component of hydrological systems and ecosystems within the Arctic landscape.[51] In the Northern Hemisphere the terrestrial permafrost domain comprises around 18 million km2.[52] Whitin this permafrost region, the total soil organic carbon (SOC) stock is estimated to be 1,460-1,600 Pg (where 1 Pg = 1 billion tons), which constitutes double the amount of carbon currently contained in the amosphere.[53][54]
Human caused climate change leads to higher temperatures that cause permafrost thawing in the Arctic. The thawing of the various types of Arctic permafrost could release large amounts of carbon into the atmosphere.[55]
The 2019 Arctic report card estimated that Arctic permafrost releases 0.3 Pg C per year. However, a recent study increased this estimate to 0.6 Pg, since the carbon emitted across the northern permafrost domain during the Arctic winter offsets the average carbon uptake during the growing season in that amount. Under a business-as-usual emissions scenario RCP 8.5, winter CO
2 emissions from the norther permafrost domain is predicted to increase 41% by 2100, and 17% under the moderate scenario RCP 4.5.[56]
Abrupt thaw[]
Permafrost thaw not only occurs gradually when climate warming increases permafrost temperature from the surface and gradually moves down. But abrupt thaw exists in <20% of the permafrost region, affecting half of the permafrost stored carbon. In contrast to gradual permafrost thaw (which extends over decades since warming of the soil surface slowly affects cm by cm), abrupt thaw rapidly affects wide areas of permafrost in a matter of years or even days.Thus, compared to just gradual thaw, abrupt thaw increases carbon emissions by ~125–190%.[57][58]
Until now Permafrost carbon feedback (PCF) modeling had mainly focussed on gradual permafrost thaw, rather than taking abrupt thaw also into consideration, and therefore greatly underestimating thawing permafrost carbon release.[57] Nevertheless, a study from 2018, by using field observations, radiocarbon dating, and remote sensing to account for thermokarst lakes, determined that abrupt thaw will more than double permafrost carbon emissions by 2100.[58] And a second study from 2020, showed that under a high RCP 8.5 scenario, abrupt thaw carbon emissions across 2.5 million km2 are projected to provide the same feedback as gradual thaw of near-surface permafrost across the whole 18 million km2 it occupies.[57]
Thawing permafrost represents a threat to industrial infrastructure. In May 2020, permafrost melting due to climate change caused the worst oil spill to date in the Arctic. The melting of permafrost caused a collapse of a fuel tank, spilling 6,000 tonnes of diesel into the land, 15,000 into the water. The rivers Ambarnaya, Daldykan and many smaller rivers were polluted. The pollution reached the lake Pyasino that is important to the water supply of the entire Taimyr Peninsula. State of emergency at the federal level was declared. Many buildings and infrastructure are built on permafrost, which cover 65% of Russian territory, and all those can be damaged as it melts. The thawing can also cause leakage of toxic elements from sites of buried toxic waste.[59][60]
Subsea permafrost[]
Subsea permafrost occurs beneath the seabed and exists in the continental shelves of the polar regions.[61] Thus, it can be defined as "the unglaciated continental shelf areas exposed during the Last Glacial Maximum (LGM, ~26 500 BP) that are currently inundated". Large stocks of organic matter (OM) and methane (CH
4) are accumulated below and within the subsea permafrost deposits.This source of methane is different from methane clathrates, but contributes to the overall outcome and feedbacks in the Earth's climate system.[52]
Sea ice serves to stabilise methane deposits on and near the shoreline,[19] preventing the clathrate breaking down and venting into the water column and eventually reaching the atmosphere. Methane is released through bubbles from the subsea permafrost into the Ocean (a process called ebullition). During storms, methane levels in the water column drop dramatically, when wind-driven air-sea gas exchange accelerates the ebullition process into the atmosphere. This observed pathway suggests that methane from seabed permafrost will progress rather slowly, instead of abrupt changes. However, Arctic cyclones, fueled by global warming and further accumulation of greenhouse gases in the atmosphere could contribute to more release from this methane cache, which is really important for the Arctic.[62] An update to the mechanisms of this permafrost degradation was published in 2017.[63]
The size of today's subsea permafrost has been estimated on around 2 million km2 (~1/5 of the terrestrial permafrost domain size), which constitutes a 30-50% reduction since the LGM. Containing around 560 GtC in OM and 45 GtC in CH4, with a current release of 18 and 38 MtC per year respectively. Which is due to the warming and thawing that the subsea permafrost domain has been experiencing since after the LGM (~14000 years ago). In fact, because the subsea permafrost systems responds at millennial timescales to climate warming, the current carbon fluxes it is emitting to the water are in response to climatic changes occurring after the LGM. Therefore, human-driven climate change effects on subsea permafrost will only be seen hundreds or thousands of years from today. According to predictions under a business-as-usual emissions scenario RCP 8.5, by 2100, 43 GtC could be released from the subsea permafrost domain, and 190 GtC by the year 2300. Whereas for the low emissions scenario RCP 2.6, 30% less emissions are estimated. This constitutes an alarming antropogenic-driven acceleration of C release in the upcoming centuries.[52]
Changes in vegetation[]


Climate change is expected to have a strong effect on the Arctic's flora, some of which is already being seen. These changes in vegetation are associated with the increases in landscape scale methane emissions,[64] as well as increases in CO
2, Tº and the disruption of ecological cycles which affect patterns in nutrient cycling, humidity and other key ecological factors that help shape plant communities.[65]
A large source of information for how vegetation has adapted to climate change over the last years comes from satellite records, which help quantify shifts in vegetation in the Arctic region. For decades, NASA and NOAA satellites have continuously monitored vegetation from space. The Moderate Resolution Imaging Spectroradiometer (MODIS) and Advanced Very High-Resolution Radiometer (AVHRR) instruments, as well as others, measure the intensity of visible and near-infrared light reflecting off of plant leaves.[66] Scientists use this information to calculate the Normalized Difference Vegetation Index (NDVI),[67] an indicator of photosynthetic activity or “greenness” of the landscape, which is most often used. There also exist other indicies, such as the Enhanced Vegetation Index (EVI) or Soil-Adjusted Vegetation Index (SAVI).[67]
These indicies can be used as proxies for vegetation productivity, and their shifts over time can provide information on how vegetation changes over time. One of the two most used ways to define shifts in vegetation in the Arctic are the concepts of Arctic greening and Arctic browning. The former refers to a positive trend in the aforementioned greenness indices, indicating increases in plant cover or biomass whereas browning can be broadly understood as a negative trend, with decreases in those variables.[67]
Recent studies have allowed us to get an idea of how these two processes have progressed in recent years. It has been found that from 1985 to 2016, greening has occurred in 37.3% of all sites sampled in the tundra, whereas browning was observed only in 4.7% of them.[68] Certain variables influenced this distribution, as greening was mostly associated with sites with higher summer air temperature, soil temperature and soil moisture.[68] On the other hand, browning was found to be linked with colder sites that were experiencing cooling and drying.[68] Overall, this paints the picture of widespread greening occurring throughout significant portions of the arctic tundra, as a consequence of increases in plant productivity, height, biomass and shrub dominance in the area.
This expansion of vegetation in the Arctic is not equivalent across types of vegetation. One of the most dramatic changes arctic tundras are currently facing is the expansion of shrubs,[69] which, thanks to increases in air temperature and, to a lesser extent, precipitation have contributed to an Arctic-wide trend known as "shrubification", where shrub type plants are taking over areas previously dominated by moss and lichens. This change contributes to the consideration that the tundra biome is currently experiencing the most rapid change of any terrestrial biomes on the planet.[70]
The direct impact on mosses and lichens is unclear as there exist very few studies at species level, but climate change is more likely to cause increased fluctuation and more frequent extreme events.[71] The expansion of shrubs could affect permafrost dynamics, but the picture is quite unclear at the moment. In the winter, shrubs trap more snow, which insulates the permafrost from extreme cold spells, but in the summer they shade the ground from direct sunlight, how these two effects counter and balance each other is not yet well understood.[72] Warming is likely to cause changes in plant communities overall, contributing to the rapid changes tundra ecosystems are facing. While shrubs may increase in range and biomass, warming may also cause a decline in cushion plants such as moss campion, and since cushion plants act as facilitator species across trophic levels and fill important ecological niches in several environments, this could cause cascading effects in these ecosystems that could severely affect the way in which they function and are structured.[73]
The expansion of these shrubs can also have strong effects on other important ecological dynamics, such as the albedo effect.[74] These shrubs change the winter surface of the tundra from undisturbed, uniform snow to mixed surface with protruding branches disrupting the snow cover,[75] this type of snow cover has a lower albedo effect, with reductions of up to 55%, which contributes to a positive feedback loop on regional and global climate warming.[75] This reduction of the albedo effect means that more radiation is absorbed by plants, and thus, surface temperatures increase, which could disrupt current surface-atmosphere energy exchanges and affect thermal regimes of permafrost.[75] Carbon cycling is also being affected by these changes in vegetation, as parts of the tundra increase their shrub cover, they behave more like boreal forests in terms of carbon cycling.[76] This is speeding up the carbon cycle, as warmer temperatures lead to increased permafrost thawing and carbon release, but also carbon capturing from plants that have increased growth.[76] It is not certain whether this balance will go in one direction or the other, but studies have found that it is more likely that this will eventually lead to increased CO
2 in the atmosphere.[76]
For a more graphic and geographically focused overview of the situation, maps above show the Arctic Vegetation Index Trend between July 1982 and December 2011 in the Arctic Circle. Shades of green depict areas where plant productivity and abundance increased; shades of brown show where photosynthetic activity declined, both according to the NDVI index. The maps show a ring of greening in the treeless tundra ecosystems of the circumpolar Arctic—the northernmost parts of Canada, Russia, and Scandinavia. Tall shrubs and trees started to grow in areas that were previously dominated by tundra grasses, as part of the previously mentioned "shrubification" of the tundra. Researchers concluded that plant growth had increased by 7% to 10% overall.
However, boreal forests, particularly those in North America, showed a different response to warming. Many boreal forests greened, but the trend was not as strong as it was for tundra of the circumpolar Arctic, mostly characterized by shrub expansion and increased growth.[77] In North America, some boreal forests actually experienced browning over the study period. Droughts, increased forest fire activity, animal behavior, industrial pollution, and a number of other factors may have contributed to browning.[67]
Another important change affecting flora in the arctic is the increase of wildfires in the Arctic Circle, which in 2020 broke its record of CO
2 emissions, peaking at 244 megatonnes of carbon dioxide emitted.[78] This is due to the burning of peatlands, carbon-rich soils that originate from the accumulation of waterlogged plants which are mostly found at Arctic latitudes.[78] These peatlands are becoming more likely to burn as temperatures increase, but their own burning and releasing of CO
2 contributes to their own likelihood of burning in a positive feedback loop.[78]
In terms of aquatic vegetation, reduction of sea ice has boosted the productivity of phytoplankton by about twenty percent over the past thirty years. However, the effect on marine ecosystems is unclear, since the larger types of phytoplankton, which are the preferred food source of most zooplankton, do not appear to have increased as much as the smaller types. So far, Arctic phytoplankton have not had a significant impact on the global carbon cycle.[79] In summer, the melt ponds on young and thin ice have allowed sunlight to penetrate the ice, in turn allowing phytoplankton to bloom in unexpected concentrations, although it is unknown just how long this phenomenon has been occurring, or what its effect on broader ecological cycles is.[80]
Changes for animals[]

The northward shift of the subarctic climate zone is allowing animals that are adapted to that climate to move into the far north, where they are replacing species that are more adapted to a pure Arctic climate. Where the Arctic species are not being replaced outright, they are often interbreeding with their southern relations. Among slow-breeding vertebrate species, this usually has the effect of reducing the genetic diversity of the genus. Another concern is the spread of infectious diseases, such as brucellosis or phocine distemper virus, to previously untouched populations. This is a particular danger among marine mammals who were previously segregated by sea ice.[81]
3 April 2007, the National Wildlife Federation urged the United States Congress to place polar bears under the Endangered Species Act.[82] Four months later, the United States Geological Survey completed a year-long study[83] which concluded in part that the floating Arctic sea ice will continue its rapid shrinkage over the next 50 years, consequently wiping out much of the polar bear habitat. The bears would disappear from Alaska, but would continue to exist in the Canadian Arctic Archipelago and areas off the northern Greenland coast.[84] Secondary ecological effects are also resultant from the shrinkage of sea ice; for example, polar bears are denied their historic length of seal hunting season due to late formation and early thaw of pack ice.
Similarly, Arctic warming negatively affects the foraging and breeding ecology many other species of arctic marine mammals, such as walruses,[85] seals, foxes or reindeers.[86] In July 2019, 200 Svalbard reindeer were found starved to death apparently due to low precipitation related to climate change.[87]
In the short-term, climate warming may have neutral or positive effects on the nesting cycle of many Arctic-breeding shorebirds.[88]
Melting of the Greenland ice sheet[]

Models predict a sea-level contribution of about 5 centimetres (2 in) from melting of the Greenland ice sheet during the 21st century.[89] It is also predicted that Greenland will become warm enough by 2100 to begin an almost complete melt during the next 1,000 years or more.[43][90] In early July 2012, 97% percent of the ice sheet experienced some form of surface melt, including the summits.[91]
Ice thickness measurements from the GRACE satellite indicate that ice mass loss is accelerating. For the period 2002–2009, the rate of loss increased from 137 Gt/yr to 286 Gt/yr, with every year seeing on average 30 gigatonnes more mass lost than in the preceding year.[92] The rate of melting was 4 times higher in 2019 than in 2003. In the year 2019 the melting contributed 2.2 millimeters to sea level rise in just 2 months.[93][94] Overall, the signs are overwhelming that melting is not only occurring, but accelerating year on year.

According to a study published in "Nature Communications Earth and Environment" the Greenland ice sheet is possibly past the point of no return, meaning that even if the rise in temperature were to completely stop and even if the climate were to become a little colder the melting would continue. This is because the movement of ice from the middle of Greenland to the coast creates a larger contact between the ice and the warm water that leads to more melting and calving. Another climate scientist says that after all the ice near the coast melts, the contact between the seawater and the ice will stop what can prevent further warming.[93][94]
In September 2020, satellite imagery showed that a big chunk of ice shattered into many small pieces from the last remaining ice shelf in Nioghalvfjerdsfjorden, Greenland.[95] This ice sheet is connected to the interior ice sheet, and could prove a hotspot for deglaciation in coming years.
Another unexpected effect of this melting relates to activities by the United States military in the area. Specifically, Camp Century, a nuclear powered base which has been producing nuclear waste over the years[96] In 2016, a group of scientists evaluated the environmental impact and estimated that due to changing weather patterns over the next few decades, melt water could release the nuclear waste, 20,000 liters of chemical waste and 24 million liters of untreated sewage into the environment. However, so far neither US or Denmark has taken responsibility for the clean-up.[97]
Effect on ocean circulation[]
Although this is now thought unlikely in the near future, it has also been suggested that there could be a shutdown of thermohaline circulation, similar to that which is believed to have driven the Younger Dryas, an abrupt climate change event.[98] Even if a full shutdown is unlikely, a slowing down of this current and a weakening of its effects on climate has already been seen, with a 2015 study finding that the Atlantic meridional overturning circulation (AMOC) has weakened by 15% to 20% over the last 100 years.[3] This slowing could lead to cooling in the North Atlantic, although this could be mitigated by global warming, but it is not clear up to what extent.[99] Additional effects of this would be felt around the globe, with changes in tropical patterns, stronger storms in the North Atlantic and reduced European crop productivity among the potential repercussions.[99]
There is also potentially a possibility of a more general disruption of ocean circulation, which may lead to an ocean anoxic event; these are believed to be much more common in the distant past. It is unclear whether the appropriate pre-conditions for such an event exist today, but these ocean anoxic events are thought to have been mainly caused by nutrient run-off, which was driven by increased CO
2 emissions in the distant past.[100] This draws an unsettling parallel with current climate change, but the amount of CO
2 that's thought to have caused these events is far higher than the levels we're currently facing, so effects of this magnitude are considered unlikely on a short time scale.[101]
Territorial claims[]
Growing evidence that global warming is shrinking polar ice has added to the urgency of several nations' Arctic territorial claims in hopes of establishing resource development and new shipping lanes, in addition to protecting sovereign rights.[102]
As ice sea coverage decreases more and more, year on year, Arctic countries (Russia, Canada, Finland, Iceland, Norway, Sweden, the United States and Denmark representing Greenland) are making moves on the geopolitical stage to ensure access to potential new shipping lanes, oil and gas reserves, leading to overlapping claims across the region.[103] However, there is only one single land border dispute in the Arctic, with all others relating to the sea, that is Hans Island.[104] This small uninhabited island lies in the Nares strait, between Canada's Ellesmere Island and the northern coast of Greenland. Its status comes from its geographical position, right between the equidistant boundaries determined in a 1973 treaty between Canada and Denmark.[104] Even though both countries have acknowledged the possibility of splitting the island, no agreement on the island has been reached, with both nations still claiming it for themselves.[104]
There is more activity in terms of maritime boundaries between countries, where overlapping claims for internal waters, territorial seas and particularly Exclusive Economic Zones (EEZs) can cause frictions between nations. Currently, official maritime borders have an unclaimed triangle of international waters lying between them, that is at the centerpoint of international disputes.[103]
This unclaimed land can be obtainable by submitting a claim to the United Nations Convention on the Law of the Sea, these claims can be based on geological evidence that continental shelves extend beyond their current maritime borders and into international waters.[103]
Some overlapping claims are still pending resolution by international bodies, such as a large portion containing the north pole that is both claimed by Denmark and Russia, with some parts of it also contested by Canada.[103] Another example is that of the Northwest Passage, globally recognized as international waters, but technically in Canadian waters.[103] This has led to Canada wanting to limit the number of ships that can go through for environmental reasons but the United States disputes that they have the authority to do so, favouring unlimited passage of vessels.[103]
Social impacts[]
As climate change speeds up, it is having more and more of a direct impact on societies around the world. This is particularly true of people that live in the Arctic, where increases in temperature are occurring at faster rates than at other latitudes in the world, and where traditional ways of living, deeply connected with the natural arctic environment are at particular risk of environmental disruption caused by these changes.[105]
The warming of the atmosphere and ecological changes that come alongside it presents challenges to local communities such as the Inuit. Hunting, which is a major way of survival for some small communities, will be changed with increasing temperatures.[106] The reduction of sea ice will cause certain species populations to decline or even become extinct.[105] Inuit communities are deeply reliant on seal hunting, which is dependent on sea ice flats, where seals are hunted.[107]
Unsuspected changes in river and snow conditions will cause herds of animals, including reindeer, to change migration patterns, calving grounds, and forage availability.[105] In good years, some communities are fully employed by the commercial harvest of certain animals.[106] The harvest of different animals fluctuates each year and with the rise of temperatures it is likely to continue changing and creating issues for Inuit hunters, as unpredictability and disruption of ecological cycles further complicate life in these communities, which already face significant problems, such as Inuit communities being the poorest and most unemployed of North America.[107]
Other forms of transportation in the Arctic have seen negative impacts from the current warming, with some transportation routes and pipelines on land being disrupted by the melting of ice.[105] Many Arctic communities rely on frozen roadways to transport supplies and travel from area to area.[105] The changing landscape and unpredictability of weather is creating new challenges in the Arctic.[108] Researchers have documented historical and current trails created by the Inuit in the Pan Inuit Trails Atlas, finding that the change in sea ice formation and breakup has resulted in changes to the routes of trails created by the Inuit.[109]
[]
The Transpolar Sea Route is a future Arctic shipping lane running from the Atlantic Ocean to the Pacific Ocean across the center of the Arctic Ocean. The route is also sometimes called Trans-Arctic Route. In contrast to the Northeast Passage (including the Northern Sea Route) and the North-West Passage it largely avoids the territorial waters of Arctic states and lies in international high seas.[110]
Governments and private industry have shown a growing interest in the Arctic.[111] Major new shipping lanes are opening up: the northern sea route had 34 passages in 2011 while the Northwest Passage had 22 traverses, more than any time in history.[112] Shipping companies may benefit from the shortened distance of these northern routes. Access to natural resources will increase, including valuable minerals and offshore oil and gas.[105] Finding and controlling these resources will be difficult with the continually moving ice.[105] Tourism may also increase as less sea ice will improve safety and accessibility to the Arctic.[105]
The melting of Arctic ice caps is likely to increase traffic in and the commercial viability of the Northern Sea Route. One study, for instance, projects, "remarkable shifts in trade flows between Asia and Europe, diversion of trade within Europe, heavy shipping traffic in the Arctic and a substantial drop in Suez traffic. Projected shifts in trade also imply substantial pressure on an already threatened Arctic ecosystem."[113]
Research[]
National[]
Individual countries within the Arctic zone, Canada, Denmark (Greenland), Finland, Iceland, Norway, Russia, Sweden, and the United States (Alaska) conduct independent research through a variety of organizations and agencies, public and private, such as Russia's Arctic and Antarctic Research Institute. Countries who do not have Arctic claims, but are close neighbors, conduct Arctic research as well, such as the Chinese Arctic and Antarctic Administration (CAA). The United States's National Oceanic and Atmospheric Administration (NOAA) produces an Arctic Report Card annually, containing peer-reviewed information on recent observations of environmental conditions in the Arctic relative to historical records.[114][115]
International[]
International cooperative research between nations has become increasingly important:
- Arctic climate change is summarized by the Intergovernmental Panel on Climate Change (IPCC) in its series of Assessment Reports and the Arctic Climate Impact Assessment.
- European Space Agency (ESA) launched CryoSat-2 on 8 April 2010. It provides satellite data on Arctic ice cover change rates.[116]
- International Arctic Buoy Program: deploys and maintains buoys that provide real-time position, pressure, temperature, and interpolated ice velocity data
- International Arctic Research Center: Main participants are the United States and Japan.
- International Arctic Science Committee: non-governmental organization (NGO) with diverse membership, including 23 countries from 3 continents.
- 'Role of the Arctic Region', in conjunction with the International Polar Year, was the focus of the second international conference on Global Change Research, held in Nynäshamn, Sweden, October 2007.[117]
- SEARCH (Study of Environmental Arctic Change): A research framework originally promoted by several US agencies; an international extension is ISAC (the International Study of Arctic Change[118]).
See also[]
- Arctic cooperation and politics
- Arctic haze
- Arctic sea ice ecology and history
- Climate of the Arctic
- Climate and vegetation interactions in the Arctic
- Long-term effects of global warming
- Northern Sea Route
- Ozone depletion and climate change
References[]
- ^ Kessler, Louise (May 2017). "Estimating the Economic Impact of the Permafrost Carbon Feedback". Climate Change Economics. 08 (2): 1750008. doi:10.1142/s2010007817500087. ISSN 2010-0078.
- ^ Jump up to: a b Arvelo, Juan (2011). "An Under-Ice Arctic Geophysical Exploration Sonar System Concept To Resolve International Territorial Claims". Proceedings of Meetings on Acoustics. 12 (1). Acoustical Society of America: 070002. doi:10.1121/1.3626896. Cite journal requires
|journal=(help) - ^ Jump up to: a b "Atlantic Ocean circulation shows "exceptional" slowdown". Physics Today. 2015. doi:10.1063/pt.5.028751. ISSN 1945-0699.
- ^ Francis, Jennifer A.; Vavrus, Stephen J. (17 March 2012). "Evidence linking Arctic amplification to extreme weather in mid-latitudes". Geophysical Research Letters. 39 (6): n/a. Bibcode:2012GeoRL..39.6801F. doi:10.1029/2012gl051000. ISSN 0094-8276.
- ^ "Polar Regions (Arctic and Antarctic) — IPCC". Retrieved 18 May 2021.
- ^ Przybylak, Rajmund (2007). "Recent air-temperature changes in the Arctic" (PDF). Annals of Glaciology. 46 (1): 316–324. Bibcode:2007AnGla..46..316P. doi:10.3189/172756407782871666. S2CID 129155170.
- ^ "Surface Air Temperature". Arctic Program. Retrieved 18 May 2021.
- ^ Arctic Climate Impact Assessment (2004): Arctic Climate Impact Assessment. Cambridge University Press, ISBN 0-521-61778-2, siehe online Archived 28 June 2013 at the Wayback Machine
- ^ Quinn, P.K., T. S. Bates, E. Baum et al. (2007): Short-lived pollutants in the Arctic: their climate impact and possible mitigation strategies, in: Atmospheric Chemistry and Physics, Vol. 7, S. 15669–15692, siehe online
- ^ Arctic Temperatures Highest in at Least 44,000 Years, Livescience, 24 October 2013
- ^ Miller, G. H.; Lehman, S. J.; Refsnider, K. A.; Southon, J. R.; Zhong, Y. (2013). "Unprecedented recent summer warmth in Arctic Canada". Geophysical Research Letters. 40 (21): 5745–5751. Bibcode:2013GeoRL..40.5745M. doi:10.1002/2013GL057188.
- ^ Rosane, Olivia (22 June 2020). "A Siberian Town Just Hit 100 F Degrees". Ecowatch. Retrieved 23 June 2020.
- ^ King, Simon; Rowlatt, Justin (22 June 2020). "Arctic Circle sees 'highest-ever' recorded temperatures". BBC. Retrieved 23 June 2020.
- ^ Rowlatt, Justin (15 July 2020). "Climate change: Siberian heatwave 'clear evidence' of warming". BBC. Retrieved 17 July 2020.
- ^ Kuebler, Martin; Schauenberg, Tim (13 July 2020). "Record heat wave in Siberia: What happens when climate change goes extreme?". Deutch Welle. Retrieved 28 July 2020.
- ^ Serreze, Mark. "5 ways the extreme Arctic heat wave follows a disturbing pattern". Phys.org. Retrieved 28 July 2020.
- ^ Cecilia Bitz (2006): Polar Amplification, in: RealClimate.org
- ^ Archer, D.; Buffett, B. (2005). "Time-dependent response of the global ocean clathrate reservoir to climatic and anthropogenic forcing" (PDF). Geochemistry Geophysics Geosystems. 6 (3): Q03002. Bibcode:2005GGG.....603002A. doi:10.1029/2004GC000854.
- ^ Jump up to: a b Shakhova, N.; Semiletov, I.; Panteleev, G. (2005). "The distribution of methane on the Siberian Arctic shelves: Implications for the marine methane cycle". Geophysical Research Letters. 32 (9): L09601. Bibcode:2005GeoRL..32.9601S. doi:10.1029/2005GL022751.
- ^ Jump up to: a b J., Cohen, J. Zhang, X. Francis, J. Jung, T. Kwok, R. Overland, J. Ballinger, T. J. Bhatt, U. S. Chen, H. W. Coumou, D. Feldstein, S. Gu, H. Handorf, D. Henderson, G. Ionita, M. Kretschmer, M. Laliberte, F. Lee, S. Linderholm, H. W. Maslowski, W. Peings, Y. Pfeiffer, K. Rigor, I. Semmler, T. Stroeve, J. Taylor, P. C. Vavrus, S. Vihma, T. Wang, S. Wendisch, M. Wu, Y. Yoon (2020). Divergent consensuses on Arctic amplification influence on midlatitude severe winter weather. OCLC 1231551014.
- ^ Dai, Aiguo; Luo, Dehai; Song, Mirong; Liu, Jiping (10 January 2019). "Arctic amplification is caused by sea-ice loss under increasing CO2". Nature Communications. 10 (1): 121. Bibcode:2019NatCo..10..121D. doi:10.1038/s41467-018-07954-9. ISSN 2041-1723. PMC 6328634. PMID 30631051.
- ^ Coumou, D.; Di Capua, G.; Vavrus, S.; Wang, L.; Wang, S. (20 August 2018). "The influence of Arctic amplification on mid-latitude summer circulation". Nature Communications. 9 (1): 2959. Bibcode:2018NatCo...9.2959C. doi:10.1038/s41467-018-05256-8. ISSN 2041-1723. PMC 6102303. PMID 30127423.
- ^ Jump up to: a b Qi, Ling; Wang, Shuxiao (November 2019). "Sources of black carbon in the atmosphere and in snow in the Arctic". Science of the Total Environment. 691: 442–454. Bibcode:2019ScTEn.691..442Q. doi:10.1016/j.scitotenv.2019.07.073. ISSN 0048-9697. PMID 31323589.
- ^ Stohl, A.; Klimont, Z.; Eckhardt, S.; Kupiainen, K.; Chevchenko, V.P.; Kopeikin, V.M.; Novigatsky, A.N. (2013), "Black carbon in the Arctic: the underestimated role of gas flaring and residential combustion emissions", Atmos. Chem. Phys., 13 (17): 8833–8855, Bibcode:2013ACP....13.8833S, doi:10.5194/acp-13-8833-2013
- ^ Michael Stanley (10 December 2018). "Gas flaring: An industry practice faces increasing global attention" (PDF). World Bank. Archived from the original (PDF) on 15 February 2019. Retrieved 20 January 2020.
- ^ Zhu, Chunmao; Kanaya, Yugo; Takigawa, Masayuki; Ikeda, Kohei; Tanimoto, Hiroshi; Taketani, Fumikazu; Miyakawa, Takuma; Kobayashi, Hideki; Pisso, Ignacio (24 September 2019). "Flexpart v10.1 simulation of source contributions to Arctic black carbon". dx.doi.org. doi:10.5194/acp-2019-590. Retrieved 18 May 2021.
- ^ "The Race to Understand Black Carbon's Climate Impact". ClimateCentral. 2017.
- ^ Zhang, Qiang; Wan, Zheng; Hemmings, Bill; Abbasov, Faig (December 2019). "Reducing black carbon emissions from Arctic shipping: Solutions and policy implications". Journal of Cleaner Production. 241: 118261. doi:10.1016/j.jclepro.2019.118261. ISSN 0959-6526.
- ^ Huang, Yiyi; Dong, Xiquan; Bailey, David A.; Holland, Marika M.; Xi, Baike; DuVivier, Alice K.; Kay, Jennifer E.; Landrum, Laura L.; Deng, Yi (19 June 2019). "Thicker Clouds and Accelerated Arctic Sea Ice Decline: The Atmosphere‐Sea Ice Interactions in Spring". Geophysical Research Letters. 46 (12): 6980–6989. Bibcode:2019GeoRL..46.6980H. doi:10.1029/2019gl082791. ISSN 0094-8276.
- ^ Jump up to: a b c Senftleben, Daniel; Lauer, Axel; Karpechko, Alexey (15 February 2020). "Constraining Uncertainties in CMIP5 Projections of September Arctic Sea Ice Extent with Observations". Journal of Climate. 33 (4): 1487–1503. Bibcode:2020JCli...33.1487S. doi:10.1175/jcli-d-19-0075.1. ISSN 0894-8755.
- ^ Jump up to: a b c Yadav, Juhi; Kumar, Avinash; Mohan, Rahul (21 May 2020). "Dramatic decline of Arctic sea ice linked to global warming". Natural Hazards. 103 (2): 2617–2621. doi:10.1007/s11069-020-04064-y. ISSN 0921-030X. S2CID 218762126.
- ^ "Daily Updated Time series of Arctic sea ice area and extent derived from SSMI data provided by NERSC". Archived from the original on 10 September 2013. Retrieved 14 September 2013.
- ^ Lawrence, D. M.; Slater, A. (2005). "A projection of severe near-surface permafrost degradation during the 21st century". Geophysical Research Letters. 32 (24): L24401. Bibcode:2005GeoRL..3224401L. doi:10.1029/2005GL025080. S2CID 128425266.
- ^ Jump up to: a b Stroeve, J.; Holland, M. M.; Meier, W.; Scambos, T.; Serreze, M. (2007). "Arctic sea ice decline: Faster than forecast". Geophysical Research Letters. 34 (9): L09501. Bibcode:2007GeoRL..3409501S. doi:10.1029/2007GL029703.
- ^ Comiso, Josefino C.; Parkinson, Claire L.; Gersten, Robert; Stock, Larry (2008). "Accelerated decline in Arctic sea ice cover". Geophysical Research Letters. 35 (1): L01703. Bibcode:2008GeoRL..35.1703C. doi:10.1029/2007GL031972. S2CID 129445545.
- ^ Comiso, Josefino C.; Parkinson, Claire L.; Gersten, Robert; Stock, Larry (3 January 2008). "Accelerated decline in the Arctic sea ice cover". Geophysical Research Letters. 35 (1): L01703. Bibcode:2008GeoRL..35.1703C. doi:10.1029/2007gl031972. ISSN 0094-8276.
- ^ "Record Arctic sea ice minimum confirmed by NSIDC". Archived from the original on 29 July 2013.
- ^ Petty, Alek A.; Stroeve, Julienne C.; Holland, Paul R.; Boisvert, Linette N.; Bliss, Angela C.; Kimura, Noriaki; Meier, Walter N. (6 February 2018). "The Arctic sea ice cover of 2016: a year of record-low highs and higher-than-expected lows". The Cryosphere. 12 (2): 433–452. Bibcode:2018TCry...12..433P. doi:10.5194/tc-12-433-2018. ISSN 1994-0424.
- ^ "Arctic summer sea ice loss may not 'tip' over the edge". environmentalresearchweb. 30 January 2009. Archived from the original on 2 February 2009. Retrieved 26 July 2010.
- ^ Jump up to: a b "Arctic sea ice extent remains low; 2009 sees third-lowest mark". NSIDC. 6 October 2009. Retrieved 26 July 2010.
- ^ Black, Richard (18 May 2007). "Earth – melting in the heat?". BBC News. Retrieved 3 January 2008.
- ^ Jump up to: a b Meehl, G.A.; et al. (2007). Climate Change 2007: The Physical Science Basis. Contribution of Working Group I to the Fourth Assessment Report of the Intergovernmental Panel on Climate Change, Chapter 10 (PDF). New York: Cambridge University Press.
- ^ Jump up to: a b Gregory JM; Huybrechts P; Raper SC (April 2004). "Climatology: threatened loss of the Greenland ice-sheet" (PDF). Nature. 428 (6983): 616. Bibcode:2004Natur.428..616G. doi:10.1038/428616a. PMID 15071587. S2CID 4421590.
The Greenland ice-sheet would melt faster in a warmer climate and is likely to be eliminated — except for residual glaciers in the mountains — if the annual average temperature in Greenland increases by more than about 3 °C. This would raise the global average sea-level by 7 metres over a period of 1000 years or more. We show here that concentrations of greenhouse gasses will probably have reached levels before the year 2100 that are sufficient to raise the temperature past this warming threshold.
- ^ Record Arctic sea ice minimum confirmed by NSIDC
- ^ Zhang, Jinlun; D.A. Rothrock (2003). "Modeling global sea ice with a thickness and enthalpy distribution model in generalized curvilinear coordinates". Mon. Wea. Rev. 131 (5): 681–697. Bibcode:2003MWRv..131..845Z. CiteSeerX 10.1.1.167.1046. doi:10.1175/1520-0493(2003)131<0845:MGSIWA>2.0.CO;2.
- ^ Masters, Jeff (19 February 2013). "Arctic sea ice volume now one-fifth its 1979 level". weather underground. Archived from the original on 19 December 2013. Retrieved 14 September 2013.
- ^ Overpeck, Jonathan T.; Sturm, Matthew; Francis, Jennifer A.; et al. (23 August 2005). "Arctic System on Trajectory to New, Seasonally Ice-Free State". Eos, Transactions, American Geophysical Union. 86 (34): 309–316. Bibcode:2005EOSTr..86..309O. doi:10.1029/2005EO340001.
- ^ Butt, F. A.; H. Drange; A. Elverhoi; O. H. Ottera; A. Solheim (2002). "The Sensitivity of the North Atlantic Arctic Climate System to Isostatic Elevation Changes, Freshwater and Solar Forcings" (PDF). 21 (14–15). Quaternary Science Reviews: 1643–1660. OCLC 108566094. Archived from the original (PDF) on 10 September 2008. Cite journal requires
|journal=(help) - ^ Reich, Katharine (15 November 2019). "Arctic Ocean could be ice-free for part of the year as soon as 2044". phys.org. Retrieved 3 September 2020.
- ^ Kirby, Alex (11 August 2020). "End of Arctic sea ice by 2035 possible, study finds". Climate News Network. Retrieved 3 September 2020.
- ^ "Terrestrial Permafrost". Arctic Program. Retrieved 18 May 2021.
- ^ Jump up to: a b c Sayedi, Sayedeh Sara; Abbott, Benjamin W; Thornton, Brett F; Frederick, Jennifer M; Vonk, Jorien E; Overduin, Paul; Schädel, Christina; Schuur, Edward A G; Bourbonnais, Annie; Demidov, Nikita; Gavrilov, Anatoly (1 December 2020). "Subsea permafrost carbon stocks and climate change sensitivity estimated by expert assessment". Environmental Research Letters. 15 (12): B027-08. Bibcode:2020AGUFMB027...08S. doi:10.1088/1748-9326/abcc29. ISSN 1748-9326.
- ^ Hugelius, G.; Strauss, J.; Zubrzycki, S.; Harden, J. W.; Schuur, E. A. G.; Ping, C.-L.; Schirrmeister, L.; Grosse, G.; Michaelson, G. J.; Koven, C. D.; O'Donnell, J. A. (1 December 2014). "Estimated stocks of circumpolar permafrost carbon with quantified uncertainty ranges and identified data gaps". Biogeosciences. 11 (23): 6573–6593. Bibcode:2014BGeo...11.6573H. doi:10.5194/bg-11-6573-2014. ISSN 1726-4189.
- ^ "Permafrost and the Global Carbon Cycle". Arctic Program. Retrieved 18 May 2021.
- ^ Edwards, Tamsin (25 June 2020). "The Arctic heatwave: here's what we know". The Guardian. Retrieved 2 July 2020.
- ^ Natali, Susan M.; Watts, Jennifer D.; Rogers, Brendan M.; Potter, Stefano; Ludwig, Sarah M.; Selbmann, Anne-Katrin; Sullivan, Patrick F.; Abbott, Benjamin W.; Arndt, Kyle A.; Birch, Leah; Björkman, Mats P. (21 October 2019). "Large loss of CO2 in winter observed across the northern permafrost region". Nature Climate Change. 9 (11): 852–857. Bibcode:2019NatCC...9..852N. doi:10.1038/s41558-019-0592-8. hdl:10037/17795. ISSN 1758-678X. S2CID 204812327.
- ^ Jump up to: a b c Turetsky, Merritt R.; Abbott, Benjamin W.; Jones, Miriam C.; Anthony, Katey Walter; Olefeldt, David; Schuur, Edward A. G.; Grosse, Guido; Kuhry, Peter; Hugelius, Gustaf; Koven, Charles; Lawrence, David M. (February 2020). "Carbon release through abrupt permafrost thaw". Nature Geoscience. 13 (2): 138–143. Bibcode:2020NatGe..13..138T. doi:10.1038/s41561-019-0526-0. ISSN 1752-0894. S2CID 213348269.
- ^ Jump up to: a b Walter Anthony, Katey; Schneider von Deimling, Thomas; Nitze, Ingmar; Frolking, Steve; Emond, Abraham; Daanen, Ronald; Anthony, Peter; Lindgren, Prajna; Jones, Benjamin; Grosse, Guido (15 August 2018). "21st-century modeled permafrost carbon emissions accelerated by abrupt thaw beneath lakes". Nature Communications. 9 (1): 3262. Bibcode:2018NatCo...9.3262W. doi:10.1038/s41467-018-05738-9. ISSN 2041-1723. PMC 6093858. PMID 30111815.
- ^ Ivan Nechepurenko (5 June 2020), "Russia Declares Emergency After Arctic Oil Spill", The New York Times
- ^ ANTONOVA, MARIA (5 June 2020). "Russia Says Melting Permafrost Is Behind The Massive Arctic Fuel Spill". Science Daily. Retrieved 19 July 2020.
- ^ IPCC AR4 (2007). "Climate Change 2007: Working Group I: The Physical Science Basis". Archived from the original on 13 April 2014. Retrieved 12 April 2014.
- ^ Shakhova, Natalia; Semiletov, Igor; Leifer, Ira; Sergienko, Valentin; Salyuk, Anatoly; Kosmach, Denis; Chernykh, Denis; Stubbs, Chris; Nicolsky, Dmitry; Tumskoy, Vladimir; Gustafsson, Örjan (24 November 2013). "Ebullition and storm-induced methane release from the East Siberian Arctic Shelf" (PDF). Nature. 7 (1): 64–70. Bibcode:2014NatGe...7...64S. doi:10.1038/ngeo2007. Retrieved 12 April 2014.
- ^ Shakhova, Natalia; Semiletov, Igor; Gustafsson, Orjan; Sergienko, Valentin; Lobkovsky, Leopold; Dudarev, Oleg; Tumskoy, Vladimir; Grigoriev, Michael; Mazurov, Alexey; Salyuk, Anatoly; Ananiev, Roman; Koshurnikov, Andrey; Kosmach, Denis; Charkin, Alexander; Dmitrevsky, Nicolay; Karnaukh, Victor; Gunar, Alexey; Meluzov, Alexander; Chernykh, Denis (2017). "Current rates and mechanisms of subsea permafrost degradation in the East Siberian Arctic Shelf". Nature Communications. 8: 15872. Bibcode:2017NatCo...815872S. doi:10.1038/ncomms15872. PMC 5489687. PMID 28639616.
- ^ Christensen, Torben R. (2004). "Thawing sub-arctic permafrost: Effects on vegetation and methane emissions". Geophysical Research Letters. 31 (4): L04501. Bibcode:2004GeoRL..31.4501C. doi:10.1029/2003gl018680. ISSN 0094-8276.
- ^ Bjorkman, Anne D.; García Criado, Mariana; Myers-Smith, Isla H.; Ravolainen, Virve; Jónsdóttir, Ingibjörg Svala; Westergaard, Kristine Bakke; Lawler, James P.; Aronsson, Mora; Bennett, Bruce; Gardfjell, Hans; Heiðmarsson, Starri (30 March 2019). "Status and trends in Arctic vegetation: Evidence from experimental warming and long-term monitoring". Ambio. 49 (3): 678–692. doi:10.1007/s13280-019-01161-6. ISSN 0044-7447. PMC 6989703. PMID 30929249.
- ^ Gutman, G.Garik (February 1991). "Vegetation indices from AVHRR: An update and future prospects". Remote Sensing of Environment. 35 (2–3): 121–136. Bibcode:1991RSEnv..35..121G. doi:10.1016/0034-4257(91)90005-q. ISSN 0034-4257.
- ^ Jump up to: a b c d Sonja, Myers-Smith, Isla H. Kerby, Jeffrey T. Phoenix, Gareth K. Bjerke, Jarle W. Epstein, Howard E. Assmann, Jakob J. John, Christian Andreu-Hayles, Laia Angers-Blondin, Sandra Beck, Pieter S. A. Berner, Logan T. Bhatt, Uma S. Bjorkman, Anne D. Blok, Daan Bryn, Anders Christiansen, Casper T. Cornelissen, J. Hans C. Cunliffe, Andrew M. Elmendorf, Sarah C. Forbes, Bruce C. Goetz, Scott J. Hollister, Robert D. de Jong, Rogier Loranty, Michael M. Macias-Fauria, Marc Maseyk, Kadmiel Normand, Signe Olofsson, Johan Parker, Thomas C. Parmentier, Frans-Jan W. Post, Eric Schaepman-Strub, Gabriela Stordal, Frode Sullivan, Patrick F. Thomas, Haydn J. D. Tommervik, Hans Treharne, Rachael Tweedie, Craig E. Walker, Donald A. Wilmking, Martin Wipf (2020). Complexity revealed in the greening of the Arctic. Umeå universitet, Institutionen för ekologi, miljö och geovetenskap. OCLC 1234747430.
- ^ Jump up to: a b c Berner, Logan T.; Massey, Richard; Jantz, Patrick; Forbes, Bruce C.; Macias-Fauria, Marc; Myers-Smith, Isla; Kumpula, Timo; Gauthier, Gilles; Andreu-Hayles, Laia; Gaglioti, Benjamin V.; Burns, Patrick (December 2020). "Summer warming explains widespread but not uniform greening in the Arctic tundra biome". Nature Communications. 11 (1): 4621. Bibcode:2020NatCo..11.4621B. doi:10.1038/s41467-020-18479-5. ISSN 2041-1723. PMC 7509805. PMID 32963240.
- ^ Martin, Andrew; Petrokofsky, Gillian (24 May 2018). "Shrub growth and expansion in the Arctic tundra: an assessment of controlling factors using an evidence-based approach". Proceedings of the 5th European Congress of Conservation Biology. Jyväskylä: Jyvaskyla University Open Science Centre. doi:10.17011/conference/eccb2018/108642.
- ^ Myers-Smith, Isla H.; Hik, David S. (25 September 2017). "Climate warming as a driver of tundra shrubline advance". Journal of Ecology. 106 (2): 547–560. doi:10.1111/1365-2745.12817. hdl:20.500.11820/f12e7d9d-1c24-4b5f-ad86-96715e071c7b. ISSN 0022-0477.
- ^ Alatalo, Juha M.; Jägerbrand, Annika K.; Molau, Ulf (14 August 2014). "Climate change and climatic events: community-, functional- and species-level responses of bryophytes and lichens to constant, stepwise, and pulse experimental warming in an alpine tundra". Alpine Botany. 124 (2): 81–91. doi:10.1007/s00035-014-0133-z. ISSN 1664-2201. S2CID 6665119.
- ^ TAPE, KEN; STURM, MATTHEW; RACINE, CHARLES (24 March 2006). "The evidence for shrub expansion in Northern Alaska and the Pan-Arctic". Global Change Biology. 12 (4): 686–702. Bibcode:2006GCBio..12..686T. doi:10.1111/j.1365-2486.2006.01128.x. ISSN 1354-1013.
- ^ Alatalo, Juha M; Little, Chelsea J (22 March 2014). "Simulated global change: contrasting short and medium term growth and reproductive responses of a common alpine/Arctic cushion plant to experimental warming and nutrient enhancement". SpringerPlus. 3 (1): 157. doi:10.1186/2193-1801-3-157. ISSN 2193-1801. PMC 4000594. PMID 24790813.
- ^ Loranty, Michael M; Goetz, Scott J; Beck, Pieter S A (1 April 2011). "Tundra vegetation effects on pan-Arctic albedo". Environmental Research Letters. 6 (2): 024014. Bibcode:2011ERL.....6b4014L. doi:10.1088/1748-9326/6/2/024014. ISSN 1748-9326.
- ^ Jump up to: a b c Belke-Brea, M.; Domine, F.; Barrere, M.; Picard, G.; Arnaud, L. (15 January 2020). "Impact of Shrubs on Winter Surface Albedo and Snow Specific Surface Area at a Low Arctic Site: In Situ Measurements and Simulations". Journal of Climate. 33 (2): 597–609. Bibcode:2020JCli...33..597B. doi:10.1175/jcli-d-19-0318.1. ISSN 0894-8755.
- ^ Jump up to: a b c Jeong, Su-Jong; Bloom, A. Anthony; Schimel, David; Sweeney, Colm; Parazoo, Nicholas C.; Medvigy, David; Schaepman-Strub, Gabriela; Zheng, Chunmiao; Schwalm, Christopher R.; Huntzinger, Deborah N.; Michalak, Anna M. (July 2018). "Accelerating rates of Arctic carbon cycling revealed by long-term atmospheric CO 2 measurements". Science Advances. 4 (7): eaao1167. Bibcode:2018SciA....4.1167J. doi:10.1126/sciadv.aao1167. ISSN 2375-2548. PMC 6040845. PMID 30009255.
- ^ Martin, Andrew C.; Jeffers, Elizabeth S.; Petrokofsky, Gillian; Myers-Smith, Isla; Macias-Fauria, Marc (August 2017). "ShieldSquare Captcha". Environmental Research Letters. 12 (8): 085007. doi:10.1088/1748-9326/aa7989.
- ^ Jump up to: a b c Witze, Alexandra (10 September 2020). "The Arctic is burning like never before — and that's bad news for climate change". Nature. 585 (7825): 336–337. Bibcode:2020Natur.585..336W. doi:10.1038/d41586-020-02568-y. ISSN 0028-0836. PMID 32913318.
- ^ Lee, Sang H.; Whitledge, Terry E.; Kang, Sung-Ho (25 August 2009). "Carbon Uptake Rates of Sea Ice Algae and Phytoplankton under Different Light Intensities in a Landfast Sea Ice Zone, Barrow, Alaska". Arctic. 61 (3). doi:10.14430/arctic25. ISSN 1923-1245.
- ^ Wu, Qiang (24 December 2019). "Satellite observations of unprecedented phytoplankton blooms in the Southern Ocean". dx.doi.org. doi:10.5194/tc-2019-282-sc1. Retrieved 19 May 2021.
- ^ Struzik, Ed (14 February 2011). "Arctic Roamers: The Move of Southern Species into Far North". Environment360. Yale University. Retrieved 19 July 2016.
Grizzly bears mating with polar bears. Red foxes out-competing Arctic foxes. Exotic diseases making their way into once-isolated polar realms. These are just some of the worrisome phenomena now occurring as Arctic temperatures soar and the Arctic Ocean, a once-impermeable barrier, melts.
- ^ "Protection For Polar Bears Urged By National Wildlife Federation". Science Daily. 3 April 2008. Retrieved 3 April 2008.
- ^ DeWeaver, Eric; U.S. Geological Survey (2007). "Uncertainty in Climate Model Projections of Arctic Sea Ice Decline: An Evaluation Relevant to Polar Bears" (PDF). United States Department of the Interior. OCLC 183412441. Archived from the original (PDF) on 9 May 2009.
- ^ Broder, John; Revkin, Andrew C. (8 July 2007). "Warming Is Seen as Wiping Out Most Polar Bears". The New York Times. Retrieved 23 September 2007.
- ^ "Walruses in a Time of Climate Change". Arctic Program. Retrieved 19 May 2021.
- ^ Descamps, Sébastien; Aars, Jon; Fuglei, Eva; Kovacs, Kit M.; Lydersen, Christian; Pavlova, Olga; Pedersen, Åshild Ø.; Ravolainen, Virve; Strøm, Hallvard (28 June 2016). "Climate change impacts on wildlife in a High Arctic archipelago - Svalbard, Norway". Global Change Biology. 23 (2): 490–502. doi:10.1111/gcb.13381. ISSN 1354-1013. PMID 27250039. S2CID 34897286.
- ^ More Than 200 Reindeer Found Dead in Norway, Starved by Climate Change By Mindy Weisberger. Live Science, July 29, 2019
- ^ Weiser, E.L.; Brown, S.C.; Lanctot, R.B.; River Gates, H.; Abraham, K.F.; et al. (2018). "Effects of environmental conditions on reproductive effort and nest success of Arctic‐breeding shorebirds". Ibis. 160 (3): 608–623. doi:10.1111/ibi.12571. hdl:10919/99313. S2CID 53514207.
- ^ IPCC AR4 chapter 10 [1] Table 10.7
- ^ "Regional Sea Level Change" (Figure 11.16). Intergovernmental Panel on Climate Change.
- ^ "NASA – Satellites See Unprecedented Greenland Ice Sheet Surface Melt". Retrieved 4 November 2012.
- ^ Velicogna, I. (2009). "Increasing rates of ice mass loss from the Greenland and Antarctic ice sheets revealed by GRACE". Geophysical Research Letters. 36 (19): L19503. Bibcode:2009GeoRL..3619503V. CiteSeerX 10.1.1.170.8753. doi:10.1029/2009GL040222.
- ^ Jump up to: a b "Ohio State University. "Warming Greenland ice sheet passes point of no return: Even if the climate cools, study finds, glaciers will continue to shrink."". ScienceDaily. ScienceDaily. Retrieved 1 September 2020.
- ^ Jump up to: a b Pappas, Stephanie. "Nothing will stop Greenland's ice sheet from shrinking now". Live Science. Retrieved 1 September 2020.
- ^ "Climate change: Warmth shatters section of Greenland ice shelf". BBC. 14 September 2020.
- ^ "A Top-Secret US Military Base Will Melt Out of the Greenland Ice Sheet". VICE Magazine. 9 March 2019.
- ^ Laskow, Sarah (27 February 2018). "America's Secret Ice Base Won't Stay Frozen Forever". Wired. ISSN 1059-1028.
- ^ Hill, Christopher (15 June 2015). "Abrupt Climate Change and the Atlantic Meridional Overturning Circulation: sensitivity and non-linear response to Arctic/sub-Arctic freshwater pulses. Collaborative research. Final report". doi:10.2172/1184378. OSTI 1184378. Cite journal requires
|journal=(help) - ^ Jump up to: a b Nelson, Daniel (19 April 2018). "The Gulf Stream May Be Weaker Than It Has Been In 1600 Years, Could Exacerbate Climate Change". Science Trends. doi:10.31988/scitrends.15937.
- ^ Vaughan, Adam (November 2020). "Arctic ice loss could trigger huge extra global warming". New Scientist. 248 (3307): 21. Bibcode:2020NewSc.248...21V. doi:10.1016/s0262-4079(20)31956-4. ISSN 0262-4079.
- ^ Chen, Xi; al., et (12 November 2020). "Supplemental Material: Zinc isotope evidence for paleoenvironmental changes during Cretaceous Oceanic Anoxic Event 2". dx.doi.org. doi:10.1130/geol.s.13232360.v1. Retrieved 19 May 2021.
- ^ Eckel, Mike (20 September 2007). "Russia: Tests Show Arctic Ridge Is Ours". The Washington Post. Associated Press. Retrieved 21 September 2007.[dead link]
- ^ Jump up to: a b c d e f "Territorial Claims in the Arctic Circle: An Explainer". The Observer. Retrieved 19 May 2021.
- ^ Jump up to: a b c "Evolution of Arctic Territorial Claims and Agreements: A Timeline (1903-Present) • Stimson Center". Stimson Center. 15 September 2013. Retrieved 19 May 2021.
- ^ Jump up to: a b c d e f g h Hassol, Susan Joy (2004). Impacts of a warming Arctic (Reprinted ed.). Cambridge, UK: Cambridge University Press. ISBN 978-0-521-61778-9.
- ^ Jump up to: a b "Archived copy" (PDF). Archived from the original (PDF) on 23 September 2013. Retrieved 5 November 2012.CS1 maint: archived copy as title (link)
- ^ Jump up to: a b Farquhar, Samantha D. (18 March 2020). "Inuit Seal Hunting in Canada: Emerging Narratives in an Old Controversy". Arctic. 73 (1): 13–19. doi:10.14430/arctic69833. ISSN 1923-1245.
- ^ Timonin, Andrey (2021). "Climate Change in the Arctic and Future Directions for Adaptation: Views From Non-Arctic States". SSRN Electronic Journal. doi:10.2139/ssrn.3802303. ISSN 1556-5068. S2CID 233756936.
- ^ News, Nunatsiaq (13 June 2014). "New online atlas tracks Nunavut's centuries-old Inuit trails". Nunatsiaq News. Retrieved 19 May 2021.
- ^ Humpert, Malte; Raspotnik, Andreas (2012). "The Future of Shipping Along the Transpolar Sea Route" (PDF). The Arctic Yearbook. 1 (1): 281–307. Archived from the original (PDF) on 21 January 2016. Retrieved 18 November 2015.
- ^ "As The Earth Warms, The Lure Of The Arctic's Natural Resources Grows". 18 March 2019.
- ^ Byers, Michael. "Melting Arctic brings new opportunities". aljazeera.com.
- ^ Bekkers, Eddy; Francois, Joseph F.; Rojas-Romagosa, Hugo (1 December 2016). "Melting Ice Caps and the Economic Impact of Opening the Northern Sea Route" (PDF). The Economic Journal. 128 (610): 1095–1127. doi:10.1111/ecoj.12460. ISSN 1468-0297. S2CID 55162828.
- ^ Andrew Freedman (12 December 2017). "Arctic warming, ice melt 'unprecedented' in at least the past 1,500 years". Mashable.com. Retrieved 13 December 2017.
- ^ "Arctic Report Card: Update for 2017; Arctic shows no sign of returning to reliably frozen region of recent past decades". NOAA.gov. Retrieved 13 December 2017.
- ^ "ESA's ice mission CryoSat-2". esa.int. 11 September 2008. Retrieved 15 June 2009.
- ^ Wininger, Corinne (26 October 2007). "E SF, VR, FORMAS sign MOU to promote Global Environmental Change Research". innovations-report.de. Retrieved 26 November 2007.
- ^ "Arctic Change". International Study of Arctic Change.
External links[]
- Arctic Change website, in near-realtime
- World Wildlife Foundation's International Arctic Programme
- Arctic Sea Ice News & Analysis
- The Arctic ice sheet, satellite map with daily updates.
- NOAA: Arctic Theme Page – A comprehensive resource focused on the Arctic
- NOAA: Arctic Report Card: Update for 2016. "Persistent warming trend and loss of sea ice are triggering extensive Arctic changes."
- Anthrax in the Arctic: why wolves are the least of a reindeer’s worries this Christmas (25 December 2016), by India Bourke, New Statesman
| show Arctic topics |
|---|
| show Climate change |
|---|
- Arctic Ocean
- Arctic research
- Effects of climate change
- Environment of the Arctic
- Sea ice
- Sea lanes
- Regional effects of climate change
- Climate change by country