Representative Concentration Pathway
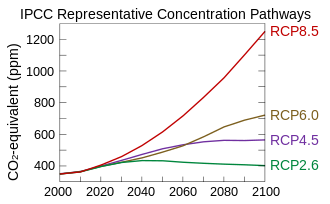
A Representative Concentration Pathway (RCP) is a greenhouse gas concentration (not emissions) trajectory adopted by the IPCC. Four pathways were used for climate modeling and research for the IPCC fifth Assessment Report (AR5) in 2014. The pathways describe different climate futures, all of which are considered possible depending on the volume of greenhouse gases (GHG) emitted in the years to come. The RCPs – originally RCP2.6, RCP4.5, RCP6, and RCP8.5 – are labelled after a possible range of radiative forcing values in the year 2100 (2.6, 4.5, 6, and 8.5 W/m2, respectively).[1][2][3] Since AR5 the original pathways are being considered together with Shared Socioeconomic Pathways: as are new RCPs such as RCP1.9, RCP3.4 and RCP7.[4]
Concentrations[]
The RCPs are consistent with a wide range of possible changes in future anthropogenic (i.e., human) GHG emissions, and aim to represent their atmospheric concentrations.[5] Despite characterizing RCPs in terms of inputs, a key change from the 2007 to the 2014 IPCC report is that the RCPs ignore the carbon cycle by focusing on concentrations of greenhouse gases, not greenhouse gas inputs.[6] The IPCC studies the carbon cycle separately, predicting higher ocean uptake of carbon corresponding to higher concentration pathways, but land carbon uptake is much more uncertain due to the combined effect of climate change and land use changes.[7]
The four RCPs are consistent with certain socio-economic assumptions but are being substituted with the shared socioeconomic pathways which are anticipated to provide flexible descriptions of possible futures within each RCP. The RCP scenarios superseded the Special Report on Emissions Scenarios projections published in 2000 and were based on similar socio-economic models.[8]
RCPs[]
RCP 1.9[]
RCP 1.9 is a pathway that limits global warming to below 1.5 °C, the aspirational goal of the Paris Agreement.[4]
RCP 2.6[]
RCP 2.6 is a "very stringent" pathway.[4] According to the IPCC, RCP 2.6 requires that carbon dioxide (CO2) emissions start declining by 2020 and go to zero by 2100. It also requires that methane emissions (CH4) go to approximately half the CH4 levels of 2020, and that sulphur dioxide (SO2) emissions decline to approximately 10% of those of 1980–1990. Like all the other RCPs, RCP 2.6 requires negative CO2 emissions (such as CO2 absorption by trees). For RCP 2.6, those negative emissions would be on average 2 Gigatons of CO2 per year (GtCO2/yr).[9] RCP 2.6 is likely to keep global temperature rise below 2 °C by 2100.[10]
RCP 3.4[]
This section needs expansion. You can help by . (March 2020) |
RCP 3.4 represents an intermediate pathway between the “very stringent” RCP2.6 and less stringent mitigation efforts associated with RCP4.5.[11] As well as just providing another option a variant of RCP3.4 includes considerable removal of greenhouse gases from the atmosphere.[4]
A 2021 paper suggests that the most plausible projections of cumulative CO2 emissions (having a 0.1% or 0.3% tolerance with historical accuracy) tend to suggest that RCP 3.4 (3.4 W/m^2, 2.0 - 2.4 degrees Celsius warming by 2100 according to study) as the most plausible pathway.[12]
RCP 4.5[]
RCP 4.5 is described by the IPCC as an intermediate scenario.[10] Emissions in RCP 4.5 peak around 2040, then decline.[13] According to resource specialists IPCC emission scenarios are biased towards exaggerated availability of fossil fuels reserves; RCP 4.5 is the most probable baseline scenario (no climate policies) taking into account the exhaustible character of non-renewable fuels.[14][15][16]
According to the IPCC, RCP 4.5 requires that carbon dioxide (CO2) emissions start declining by approximately 2045 to reach roughly half of the levels of 2050 by 2100. It also requires that methane emissions (CH4) stop increasing by 2050 and decline somewhat to about 75% of the CH4 levels of 2040, and that sulphur dioxide (SO2) emissions decline to approximately 20% of those of 1980–1990. Like all the other RCPs, RCP 4.5 requires negative CO2 emissions (such as CO2 absorption by trees). For RCP 4.5, those negative emissions would be 2 Gigatons of CO2 per year (GtCO2/yr).[9] RCP 4.5 is more likely than not to result in global temperature rise between 2 degrees C, and 3 degrees C, by 2100 with a mean sea level rise 35% higher than that of RCP 2.6.[17] Many plant and animal species will be unable to adapt to the effects of RCP 4.5 and higher RCPs.[18]
RCP 6[]
In RCP 6, emissions peak around 2080, then decline.[13]
RCP 7[]
RCP7 is a baseline outcome rather than a mitigation target.[4]
RCP 8.5[]
In RCP 8.5 emissions continue to rise throughout the 21st century.[13] Since AR5 this has been thought to be very unlikely, but still possible as feedbacks are not well understood.[19][20] RCP8.5, generally taken as the basis for worst-case climate change scenarios, was based on what proved to be overestimation of projected coal outputs. It is still used for predicting mid-century (and earlier) emissions based on current and stated policies.[21]
Projections based on the RCPs[]
21st century[]
Mid- and late-21st century (2046–2065 and 2081–2100 averages, respectively) projections of global warming and global mean sea level rise from the IPCC Fifth Assessment Report (IPCC AR5 WG1) are tabulated below. The projections are relative to temperatures and sea levels in the late-20th to early-21st centuries (1986–2005 average). Temperature projections can be converted to a reference period of 1850–1900 or 1980–99 by adding 0.61 or 0.11 °C, respectively.[22]
| Scenario | 2046–2065 | 2081–2100 |
|---|---|---|
| Mean (likely range) | Mean (likely range) | |
| RCP2.6 | 1.0 (0.4 to 1.6) | 1.0 (0.3 to 1.7) |
| RCP4.5 | 1.4 (0.9 to 2.0) | 1.8 (1.1 to 2.6) |
| RCP6 | 1.3 (0.8 to 1.8) | 2.2 (1.4 to 3.1) |
| RCP8.5 | 2.0 (1.4 to 2.6) | 3.7 (2.6 to 4.8) |
Across all RCPs, global mean temperature is projected to rise by 0.3 to 4.8 °C by the late-21st century.
According to a 2021 study in which plausible AR5 and SSP scenarios of CO2 emissions are selected,[12]
| SSP Scenario | Range of Global Mean Temperature Increase (Celsius) - 2100 from pre-Industrial baseline |
|---|---|
| RCP 1.9 | ~1 to ~1.5 |
| RCP 2.6 | ~1.5 to ~2 |
| RCP 3.4 | ~2 to ~2.4 |
| RCP 4.5 | ~2.5 to ~3 |
| RCP 6.0 | ~3 to ~3.5 |
| RCP 7.5 | ~4 |
| RCP 8.5 | ~5 |
| Scenario | 2046–2065 | 2081–2100 |
|---|---|---|
| Mean (likely range) | Mean (likely range) | |
| RCP2.6 | 0.24 (0.17 to 0.32) | 0.40 (0.26 to 0.55) |
| RCP4.5 | 0.26 (0.19 to 0.33) | 0.47 (0.32 to 0.63) |
| RCP6 | 0.25 (0.18 to 0.32) | 0.48 (0.33 to 0.63) |
| RCP8.5 | 0.30 (0.22 to 0.38) | 0.63 (0.45 to 0.82) |
Across all RCPs, global mean sea level is projected to rise by 0.26 to 0.82 m by the late-21st century.
23rd century[]
AR5 also projects changes in climate beyond the 21st century. The extended RCP2.6 pathway assumes sustained net negative anthropogenic GHG emissions after the year 2070.[5] "Negative emissions" means that in total, humans absorb more GHGs from the atmosphere than they release. The extended RCP8.5 pathway assumes continued anthropogenic GHG emissions after 2100.[5] In the extended RCP 2.6 pathway, atmospheric CO2 concentrations reach around 360 ppmv by 2300, while in the extended RCP8.5 pathway, CO2 concentrations reach around 2000 ppmv in 2250, which is nearly seven times the pre-industrial level.[5]
For the extended RCP2.6 scenario, global warming of 0.0 to 1.2 °C is projected for the late-23rd century (2281–2300 average), relative to 1986–2005.[23] For the extended RCP8.5, global warming of 3.0 to 12.6 °C is projected over the same time period.[23]
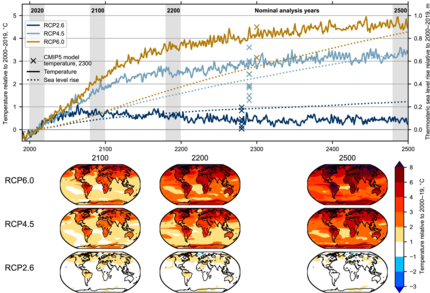
Up to 2500[]
In 2021, researchers who found that projecting effects of greenhouse gas emissions only for up to 2100, as widely practiced in research and policy-making, is short-sighted modelled RCP climate change scenarios and their effects for up to 2500. [24][25]


See also[]
References[]
- ^ "Representative Concentration Pathways (RCPs)". IPCC. Retrieved 13 February 2019.
- ^ Richard Moss; et al. (2008). Towards New Scenarios for Analysis of Emissions, Climate Change, Impacts, and Response Strategies (PDF). Geneva: Intergovernmental Panel on Climate Change. p. 132.
- ^ Weyant, John; Azar, Christian; Kainuma, Mikiko; Kejun, Jiang; Nakicenovic, Nebojsa; Shukla, P.R.; La Rovere, Emilio; Yohe, Gary (April 2009). Report of 2.6 Versus 2.9 Watts/m2 RCPP Evaluation Panel (PDF). Geneva, Switzerland: IPCC Secretariat.
- ^ a b c d e "Explainer: How 'Shared Socioeconomic Pathways' explore future climate change". Carbon Brief. 2018-04-19. Retrieved 2020-03-04.
- ^ a b c d Collins, M., et al.: Section 12.3.1.3 The New Concentration Driven RCP Scenarios, and their Extensions, in: Chapter 12: Long-term Climate Change: Projections, Commitments and Irreversibility (archived 16 July 2014), in: IPCC AR5 WG1 2013, pp. 1045–1047
- ^ IPCC 2013: Technical Summary (PDF) (Report).
the uncertainty is now estimated to be smaller than with the AR4 method for long-term climate change, because the carbon cycle–climate feedbacks are not relevant for the concentration-driven RCP projections
- ^ IPCC AR5- Technical Summary- TFE.7 Carbon Cycle Perturbation and Uncertainties (PDF) (Report).
With very high confidence, ocean carbon uptake of anthropogenic CO2 emissions will continue under all four Representative Concentration Pathways (RCPs) through to 2100, with higher uptake corresponding to higher concentration pathways. The future evolution of the land carbon uptake is much more uncertain, with a majority of models projecting a continued net carbon uptake under all RCPs, but with some models simulating a net loss of carbon by the land due to the combined effect of climate change and land use change. In view of the large spread of model results and incomplete process representation, there is low confidence on the magnitude of modelled future land carbon changes.
- ^ Ward, James D.; Mohr, Steve H.; Myers, Baden R.; Nel, William P. (December 2012). "High estimates of supply constrained emissions scenarios for long-term climate risk assessment". Energy Policy. 51: 598–604. doi:10.1016/j.enpol.2012.09.003.
- ^ a b https://ar5-syr.ipcc.ch/topic_futurechanges.php Box 2.2
- ^ a b https://ar5-syr.ipcc.ch/topic_futurechanges.php Box 2.2, figure 1
- ^ "Explainer: How 'Shared Socioeconomic Pathways' explore future climate change". Carbon Brief. April 19, 2018.
- ^ a b Pielke JR., Roger (April 10, 2021). "Most plausible 2005-2040 emissions scenarios project less than 2.5 degrees C or warming by 2100". osf.io. doi:10.31235/osf.io/m4fdu. Retrieved 2021-04-26.
- ^ a b c Figure 2, in Meinshausen & others 2011, p. 223
- ^ Laherrère, Jean (2019-08-30). "Are there enough fossil fuels to generate the IPCC CO2 baseline scenario?" (PDF). ASPO France. Retrieved 2021-10-10.
Only RCP4.5 is close to the most probable FF production.
- ^ Höök M, Sivertsson A, Aleklett K (2010-02-18). "Validity of the Fossil Fuel Production Outlooks in the IPCC Emission Scenarios". Natural Resources Research. 19: 63–81. doi:10.1007/s11053-010-9113-1. Retrieved 2021-10-10.
It is found that the SRES unnecessarily takes an overoptimistic stance and that future production expectations are leaning toward spectacular increases from present output levels. In summary, we can only encourage the IPCC to involve more resource experts and natural science in future emission scenarios.
- ^ Laherrère, Jean (2001-06-10). "Estimates of Oil Reserves" (PDF). EMF/IEA/IEW meeting. IIASA. Retrieved 2021-10-10.
It is obvious that the IPCC assumptions for oil and gas are based on the assumption of abundant cheap oil and gas. This concept has to be revised.
- ^ https://ar5-syr.ipcc.ch/topic_summary.php table SPM.1
- ^ https://ar5-syr.ipcc.ch/topic_futurechanges.php 2.3.1
- ^ Hausfather, Zeke; Peters, Glen (29 January 2020). "Emissions – the 'business as usual' story is misleading". Nature. 577 (7792): 618–20. Bibcode:2020Natur.577..618H. doi:10.1038/d41586-020-00177-3. PMID 31996825.
- ^ "BBC World Service - The Inquiry, Have our climate models been wrong?". BBC. Retrieved 2020-03-05.
- ^ Schwalm, Christopher R.; Glendon, Spencer; Duffy, Philip B. (2020-08-18). "RCP8.5 tracks cumulative CO2 emissions". Proceedings of the National Academy of Sciences. 117 (33): 19656–19657. Bibcode:2020PNAS..11719656S. doi:10.1073/pnas.2007117117. ISSN 0027-8424. PMC 7443890. PMID 32747549.
- ^ a b c IPCC: Table SPM-2, in: Summary for Policymakers (archived 16 July 2014), in: IPCC AR5 WG1 2013, p. 21
- ^ a b Collins, Matthew, et al.: Executive summary, in: Chapter 12: Long-term Climate Change: Projections, Commitments and Irreversibility (archived 16 July 2014), in: IPCC AR5 WG1 2013, p. 1033
- ^ "By 2500 earth could be alien to humans". Scienmag: Latest Science and Health News. 14 October 2021. Retrieved 18 October 2021.
- ^ Lyon, Christopher; Saupe, Erin E.; Smith, Christopher J.; Hill, Daniel J.; Beckerman, Andrew P.; Stringer, Lindsay C.; Marchant, Robert; McKay, James; Burke, Ariane; O’Higgins, Paul; Dunhill, Alexander M.; Allen, Bethany J.; Riel-Salvatore, Julien; Aze, Tracy (2021). "Climate change research and action must look beyond 2100". Global Change Biology. n/a (n/a). doi:10.1111/gcb.15871. ISSN 1365-2486. PMID 34558764.
Note: The following references are cited in this article using Template:Harvard citation no brackets:
- IPCC AR5 WG1 (2013), Stocker, T.F.; et al. (eds.), Climate Change 2013: The Physical Science Basis. Working Group 1 (WG1) Contribution to the Intergovernmental Panel on Climate Change (IPCC) 5th Assessment Report (AR5), Cambridge University Press, archived from the original on 12 August 2014CS1 maint: bot: original URL status unknown (link). [Archived
- Meinshausen, M.; et al. (November 2011), "The RCP greenhouse gas concentrations and their extensions from 1765 to 2300 (open access)", Climatic Change, 109 (1–2): 213–241, doi:10.1007/s10584-011-0156-z.
External links[]
- RCP Database
- Special Issue: The representative concentration pathways: an overview, Climatic Change, Volume 109, Issue 1–2, November 2011. Most papers in this issue are freely accessible.
- The Guardian: A guide to the IPCC's new RCP emissions pathways
- G.P. Wayne: The Beginner's Guide to Representative Concentration Pathways
- Jubb, I., Canadell, P. and Dix, M. 2013. Representative Concentration Pathways: Australian Climate Change Science Program Information paper
- Climate change assessment and attribution
- Intergovernmental Panel on Climate Change
- Greenhouse gas emissions