Sea level rise
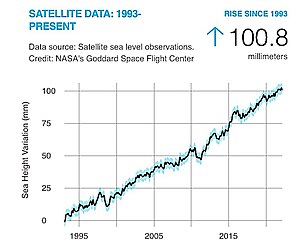
Tide gauge measurements show that the current global sea level rise began at the start of the 20th century. Between 1900 and 2017, the globally averaged sea level rose by 16–21 cm (6.3–8.3 in).[1] More precise data gathered from satellite radar measurements reveal an accelerating rise of 7.5 cm (3.0 in) from 1993 to 2017,[2]: 1554 for an average rate of 31 mm (1.22 in) per decade. This acceleration is due mostly to climate change, which is driving thermal expansion of seawater and the melting of land-based ice sheets and glaciers.[3] Between 1993 and 2018, thermal expansion of the oceans contributed 42% to sea level rise; the melting of temperate glaciers, 21%; Greenland, 15%; and Antarctica, 8%.[2]: 1576 Climate scientists expect the rate to further accelerate during the 21st century, with the latest measurements saying the sea levels are currently rising by 3.6 mm per year.[4]: 62 [5]
Projecting future sea level is challenging, due to the complexity of many aspects of the climate system and to time lags in sea level reactions to Earth temperature changes. As climate research into past and present sea levels leads to improved computer models, projections have consistently increased. In 2007, the Intergovernmental Panel on Climate Change (IPCC) projected a high end estimate of 60 cm (2 ft) through 2099,[6] but their 2014 report raised the high-end estimate to about 90 cm (3 ft).[7] A number of later studies have concluded that a global sea level rise of 200 to 270 cm (6.6 to 8.9 ft) this century is "physically plausible".[8][2][9] A conservative estimate of the long-term projections is that each Celsius degree of temperature rise triggers a sea level rise of approximately 2.3 meters (4.2 ft/degree Fahrenheit) over a period of two millennia (2,000 years): an example of climate inertia.[1] In February 2021, a paper published in Ocean Science suggested that past projections for global sea level rise by 2100 reported by the IPCC were likely conservative, and that sea levels will rise more than previously expected.[10]
The sea level will not rise uniformly everywhere on Earth, and it will even drop slightly in some locations, such as the Arctic.[11] Local factors include tectonic effects and subsidence of the land, tides, currents and storms. Sea level rises can affect human populations considerably in coastal and island regions.[12] Widespread coastal flooding is expected with several degrees of warming sustained for millennia.[13] Further effects are higher storm-surges and more dangerous tsunamis, displacement of populations, loss and degradation of agricultural land and damage in cities.[14][15][16] Natural environments like marine ecosystems are also affected, with fish, birds and plants losing parts of their habitat.[17]
Societies can adapt to sea level rise in three different ways: implement managed retreat, accommodate coastal change, or protect against sea level rise through hard-construction practices like seawalls or soft approaches such as dune rehabilitation and beach nourishment. Sometimes these adaptation strategies go hand in hand, but at other times choices have to be made among different strategies.[18] For some human environments, such as so called sinking cities, adaptation to sea level rise may be compounded by other environmental issues such as subsidence. Natural ecosystems typically adapt to rising sea levels by moving inland; however, they might not always be able to do so, due to natural or artificial barriers.[19]
Past changes[]
Understanding past sea level is important for the analysis of current and future changes. In the recent geological past, changes in land ice and thermal expansion from increased temperatures are the dominant reasons of sea level rise. The last time the Earth was 2 °C (3.6 °F) warmer than pre-industrial temperatures, sea levels were at least 5 metres (16 ft) higher than now:[20] this was when warming because of changes in the amount of sunlight due to slow changes in the Earth's orbit caused the last interglacial. The warming was sustained over a period of thousands of years and the magnitude of the rise in sea level implies a large contribution from the Antarctic and Greenland ice sheets.[21]: 1139 Also, a report by the Royal Netherlands Institute for Sea Research stated that around three million years ago, levels of carbon dioxide in the Earth's atmosphere were similar to today's levels which increased temperature by two to three degrees Celsius and melted one third of Antarctica's ice sheets. This in turn caused sea-levels to rise 20 metres.[22]
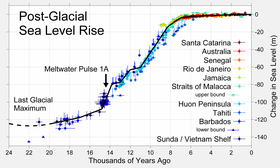
Since the last glacial maximum about 20,000 years ago, the sea level has risen by more than 125 metres (410 ft), with rates varying from less than a mm/year to 40+ mm/year, as a result of melting ice sheets over Canada and Eurasia. Rapid disintegration of ice sheets led to so called 'meltwater pulses', periods during which sea level rose rapidly. The rate of rise started to slow down about 8,200 years before present; the sea level was almost constant in the last 2,500 years, before the recent rising trend that started at the end of the 19th century or in the beginning of the 20th.[23]
Measurement[]


Sea level changes can be driven either by variations in the amount of water in the oceans, the volume of the ocean or by changes of the land compared to the sea surface. The different techniques used to measure changes in sea level do not measure exactly the same level. Tide gauges can only measure relative sea level, whilst satellites can also measure absolute sea level changes.[26] To get precise measurements for sea level, researchers studying the ice and the oceans on our planet factor in ongoing deformations of the solid Earth, in particular due to landmasses still rising from past ice masses retreating, and also the Earth's gravity and rotation.[2]
Satellites[]
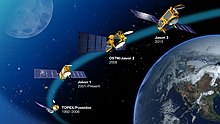
Since the launch of TOPEX/Poseidon in 1992, an overlapping series of altimetric satellites has been continuously recording the changes in sea level.[27] Those satellites can measure the hills and valleys in the sea caused by currents and detect trends in their height. To measure the distance to the sea surface, the satellites send a microwave pulse to the ocean's surface and record the time it takes to return. Microwave radiometers correct the additional delay caused by water vapor in the atmosphere. Combining these data with the precisely known location of the spacecraft makes it possible to determine sea-surface height to within a few centimeters (about one inch).[28] Current rates of sea level rise from satellite altimetry have been estimated to be 3.0 ± 0.4 millimetres (0.118 ± 0.016 in) per year for the period 1993–2017.[29] Earlier satellite measurements were previously slightly at odds with tide gauge measurements. A small calibration error for the Topex/Poseidon satellite was eventually identified as having caused a slight overestimation of the 1992–2005 sea levels, which masked in the satellite measurements the ongoing sea level rise acceleration that was visible in the tide gauge timeseries.[30]
Satellites are useful for measuring regional variations in sea level, such as the substantial rise between 1993 and 2012 in the western tropical Pacific. This sharp rise has been linked to increasing trade winds, which occur when the Pacific Decadal Oscillation (PDO) and the El Niño–Southern Oscillation (ENSO) change from one state to the other.[31] The PDO is a basin-wide climate pattern consisting of two phases, each commonly lasting 10 to 30 years, while the ENSO has a shorter period of 2 to 7 years.[32]
Tide gauges[]

Another important source of sea-level observations is the global network of tide gauges. Compared to the satellite record, this record has major spatial gaps but covers a much longer period of time.[34] Coverage of tide gauges started primarily in the Northern Hemisphere, with data for the Southern Hemisphere remaining scarce up to the 1970s.[34] The longest running sea-level measurements, NAP or Amsterdam Ordnance Datum established in 1675, are recorded in Amsterdam, the Netherlands.[35] In Australia record collection is also quite extensive, including measurements by an amateur meteorologist beginning in 1837 and measurements taken from a sea-level benchmark struck on a small cliff on the Isle of the Dead near the Port Arthur convict settlement in 1841.[36]
This network was used, in combination with satellite altimeter data, to establish that global mean sea-level rose 19.5 cm (7.7 in) between 1870 and 2004 at an average rate of about 1.44 mm/yr (1.7 mm/yr during the 20th century).[37] Data collected by the Commonwealth Scientific and Industrial Research Organisation (CSIRO) in Australia show the current global mean sea level trend to be 3.2 mm (0.13 in) per year, a doubling of the rate during the 20th century.[38][39] This is an important confirmation of climate change simulations which predicted that sea level rise would accelerate in response to climate change.
Some regional differences are also visible in the tide gauge data. Some of the recorded regional differences are due to differences in the actual sea level, while other are due to vertical land movements. In Europe for instance, considerable variation is found because some land areas are rising while others are sinking. Since 1970, most tidal stations have measured higher seas, but sea levels along the northern Baltic Sea have dropped due to post-glacial rebound.[40]
Contributions[]

The three main reasons warming causes global sea level to rise are: oceans expand, ice sheets lose ice faster than it forms from snowfall, and glaciers at higher altitudes also melt. Sea level rise since the start of the 20th century has been dominated by retreat of glaciers and expansion of the ocean, but the contributions of the two large ice sheets (Greenland and Antarctica) are expected to increase in the 21st century.[3] The ice sheets store most of the land ice (∼99.5%), with a sea-level equivalent (SLE) of 7.4 m (24 ft) for Greenland and 58.3 m (191 ft) for Antarctica.[2]
Each year about 8 mm (0.31 in) of precipitation (liquid equivalent) falls on the ice sheets in Antarctica and Greenland, mostly as snow, which accumulates and over time forms glacial ice. Much of this precipitation began as water vapor evaporated from the ocean surface. Some of the snow is blown away by wind or disappears from the ice sheet by melt or by sublimation (directly changing into water vapor). The rest of the snow slowly changes into ice. This ice can flow to the edges of the ice sheet and return to the ocean by melting at the edge or in the form of icebergs. If precipitation, surface processes and ice loss at the edge balance each other, sea level remains the same. However scientists have found that ice is being lost, and at an accelerating rate.[42][43]
Ocean heating[]

Most of the additional heat trapped in the Earth's climate system by climate change is stored in oceans. They store more than 90% of the extra heat and act as a buffer against the effects of climate change. The heat needed to raise an average temperature increase of the entire world ocean by 0.01 °C would increase the atmospheric temperature by approximately 10 °C .[44] Thus, a small change in the mean temperature of the ocean represents a very large change in the total heat content of the climate system.
When the ocean gains heat, the water expands and sea level rises. The amount of expansion varies with both water temperature and pressure. For each degree, warmer water and water under great pressure (due to depth) expand more than cooler water and water under less pressure.[21]: 1161 This means that cold Arctic Ocean water will expand less compared to warm tropical water. Because different climate models have slightly different patterns of ocean heating, they do not agree fully on the predictions for the contribution of ocean heating on sea level rise.[45] Heat gets transported into deeper parts of the ocean by winds and currents, and some of it reaches depths of more than 2,000 m (6,600 ft).[46]
Antarctica[]

The large volume of ice on the Antarctic continent stores around 70% of the world's fresh water.[47] The Antarctic ice sheet mass balance is affected by snowfall accumulations, and ice discharge along the periphery. Under the influence of global warming, melt at the base of the ice sheet increases. Simultaneously, the capacity of the atmosphere to carry precipitation increases with temperature so that precipitation, in the form of snowfall, increases in global and regional models. The additional snowfall causes increased ice flow of the ice sheet into the ocean, so that the mass gain due to snowfall is partially compensated.[48] Snowfall increased over the last two centuries, but no increase was found in the interior of Antarctica over the last four decades.[49] Based on changes of Antarctica's ice mass balance over millions of years, due to natural climate fluctuations, researchers concluded that the sea-ice acts as a barrier for warmer waters surrounding the continent. Consequently, the loss of sea ice is a major driver of the instability of the entire ice sheet.[49]

Different satellite methods for measuring ice mass and change are in good agreement, and combining methods leads to more certainty about how the East Antarctic Ice Sheet, the West Antarctic Ice Sheet, and the Antarctic Peninsula evolve.[50] A 2018 systematic review study estimated that ice loss across the entire continent was 43 gigatons (Gt) per year on average during the period from 1992 to 2002, but has accelerated to an average of 220 Gt per year during the five years from 2012 to 2017.[51] Most of the melt comes from the West Antarctic Ice Sheet, but the Antarctic Peninsula and East Antarctic Ice Sheet also contribute. The sea-level rise due to Antarctica has been estimated to be 0.25 mm per year from 1993 to 2005, and 0.42 mm per year from 2005 to 2015. All datasets generally show an acceleration of mass loss from the Antarctic ice-sheet, but with year-to-year variations.[2]
A May 2021 study projected that limiting global warming to 1.5 °C would reduce the land ice contribution to sea level rise by 2100 from 25 cm to 13 cm (from 10 to 6 in.) compared to current mitigation pledges, with glaciers responsible for half the sea level rise contribution.[52] The physical uncertainty of the Antarctic contribution was more significant than the uncertainty due to the choice of mitigation pathway.[52]
East Antarctica[]
The world's largest potential source of sea level rise is the East Antarctic Ice Sheet, which holds enough ice to raise global sea levels by 53.3 m (175 ft).[53] The ice sheet has historically been considered to be relatively stable and has therefore attracted less scientific attention and observations compared to West Antarctica.[49] A combination of satellite observations of its changing volume, flow and gravitational attraction with modelling of its surface mass balance suggests the overall mass balance of the East Antarctic Ice Sheet was relatively steady or slightly positive for much of the period 1992–2017.[51] A 2019 study, however, using different methodology, concluded that East Antarctica is losing significant amounts of ice mass. The lead scientist Eric Rignot told CNN: "melting is taking place in the most vulnerable parts of Antarctica ... parts that hold the potential for multiple meters of sea level rise in the coming century or two."[49]
Methods agree that the Totten Glacier has lost ice in recent decades in response to ocean warming[54][55] and possibly a reduction in local sea ice cover.[56] Totten Glacier is the primary outlet of the Aurora Subglacial Basin, a major ice reservoir in East Antarctica that could rapidly retreat due to hydrological processes.[57] The global sea level potential of 3.5 m (11 ft) flowing through Totten Glacier alone is of similar magnitude to the entire probable contribution of the West Antarctic Ice Sheet.[58] The other major ice reservoir on East Antarctica that might rapidly retreat is the Wilkes Basin which is subject to marine ice sheet instability.[57] Ice loss from these outlet glaciers is possibly compensated by accumulation gains in other parts of Antarctica.[51]
West Antarctica[]

Even though East Antarctica contains the largest potential source of sea level rise, it is West Antarctica that currently experiences a net outflow of ice, causing sea levels to rise. Using different satellites from 1992 to 2017 shows melt is increasing significantly over this period. Antarctica as a whole has caused a total of 7.6 ± 3.9 mm (0.30 ± 0.15 in) of sea level rise. Considering the mass balance of the East Antarctic Ice Sheet which was relatively steady, the major contributor was West Antarctica.[51] Significant acceleration of outflow glaciers in the Amundsen Sea Embayment may have contributed to this increase.[59] In contrast to East Antarctica and the Antarctic Peninsula, temperatures on West Antarctica have increased significantly with a trend between 0.08 °C (0.14 °F) per decade and 0.96 °C (1.7 °F) per decade between 1976 and 2012.[60]
Multiple types of instability are at play in West Antarctica. One is the Marine Ice Sheet Instability, where the bedrock on which parts of the ice sheet rest is deeper inland.[61] This means that when a part of the ice sheet melts, a thicker part of the ice sheet is exposed to the ocean, which may lead to additional ice loss. Secondly, melting of the ice shelves, the floating extensions of the ice sheet, leads to a process named the Marine Ice Cliff Instability. Because they function as a buttress to the ice sheet, their melt leads to additional ice flow (see animation one minute into video). Melt of ice shelves is accelerated when surface melt creates crevasses and these crevasses cause fracturing.[62]
The Thwaites and Pine Island glaciers have been identified to be potentially prone to these processes, since both glaciers bedrock topography gets deeper farther inland, exposing them to more warm water intrusion at the grounding line. With continued melt and retreat they contribute to raising global sea levels.[63][64] The melting of these 2 glaciers had accelerated at the beginning of the 21st century. It can destabilize the entire West Antarctic Ice Sheet. However, the process will probably not be finished in this century.[65] Most of the bedrock underlying the West Antarctic Ice Sheet lies well below sea level.[57] A rapid collapse of the West Antarctic Ice Sheet could raise sea level by 3.3 metres (11 ft).[66][67]
Greenland[]

Most ice on Greenland is part of the Greenland ice sheet which is 3 km (2 mi) at its thickest. The rest of the ice on Greenland is part of isolated glaciers and ice caps. The sources contributing to sea level rise from Greenland are from ice sheet melting (70%) and from glacier calving (30%). Dust, soot, and microbes and algae living on parts of the ice sheet further enhance melting by darkening its surface and thus absorbing more thermal radiation; these regions grew by 12% between 2000 and 2012, and are likely to expand further.[69] Average annual ice loss in Greenland more than doubled in the early 21st century compared to the 20th century.[70] Some of Greenland's largest outlet glaciers, such as Jakobshavn Isbræ and Kangerlussuaq Glacier, are flowing faster into the ocean.[71][72]
A study published in 2017 concluded that Greenland's peripheral glaciers and ice caps crossed an irreversible tipping point around 1997, and will continue to melt.[73][74] The Greenland ice sheet and its glaciers and ice caps are the largest contributor to sea level rise from land ice sources (excluding thermal expansion), combined accounting for 71 percent, or 1.32 mm per year during the 2012–2016 period.[75][76]
A study published in 2020 estimated that the Greenland Ice Sheet had lost a total of 3,902 gigatons (Gt) of ice between 1992 and 2018, corresponding to a contribution to sea level rise of 10.8 mm. The sea-level rise due to the Greenland Ice Sheet has generally increased over time, rising from 0.07 mm per year between 1992 and 1997 to 0.68 mm per year between 2012 and 2017.[77]
Estimates on future contribution to sea level rise from Greenland range from 0.3 to 3 metres (1 to 10 ft), for the year 2100.[69] By the end of the century, it can contribute 2-10 centimetres annually.[78] The contribution of the Greenland ice sheet on sea level over the next couple of centuries can be very high due to a self-reinforcing cycle (a so-called positive feedback). After an initial period of melting, the height of the ice sheet will have lowered. As air temperature increases closer to the sea surface, more melt starts to occur. This melting may further be accelerated because the color of ice is darker while it is melting. There is a threshold in surface warming beyond which a partial or near-complete melting of the Greenland ice sheet occurs.[79] Different research has put this threshold value as low as 1 °C (2 ℉), and definitely 4 °C (7 ℉), above pre-industrial temperatures.[80][21]: 1170 A 2021 analysis of sub-glacial sediment at the bottom of a 1.4 km Greenland ice core finds that the Greenland ice sheet melted away at least once during the last million year, and therefore strongly suggests that its tipping point is below the 2.5 °C maximum positive temperature excursion over that period.[81][82]
Glaciers[]
Less than 1% of glacier ice is in mountain glaciers, compared to 99% in Greenland and Antarctica. Still, mountain glaciers have contributed appreciably to historical sea level rise and are set to contribute a smaller, but still significant fraction of sea level rise in the 21st century.[83] The roughly 200,000 glaciers on earth are spread out across all continents.[84] Different glaciers respond differently to increasing temperatures. For instance, valley glaciers that have a shallow slope retreat under even mild warming. Every glacier has a height above which there is net gain in mass and under which the glacier loses mass. If that height changes a bit, this has large consequences for glaciers with a shallow slope.[85]: 345 Many glaciers drain into the ocean and ice loss can therefore increase when ocean temperatures increase.[84]
Observational and modelling studies of mass loss from glaciers and ice caps indicate a contribution to sea-level rise of 0.2-0.4 mm per year, averaged over the 20th century.[86] Over the 21st century, this is expected to rise, with glaciers contributing 7 to 24 cm (3 to 9 in) to global sea levels.[21]: 1165 Glaciers contributed around 40% to sea-level rise during the 20th century, with estimates for the 21st century of around 30%.[2]
Sea ice[]
Sea ice melt contributes very slightly to global sea level rise. If the melt water from ice floating in the sea was exactly the same as sea water then, according to Archimedes' principle, no rise would occur. However melted sea ice contains less dissolved salt than sea water and is therefore less dense: in other words although the melted sea ice weighs the same as the sea water it was displacing when it was ice, its volume is still slightly greater. If all floating ice shelves and icebergs were to melt sea level would only rise by about 4 cm (1.6 in).[87]
Land water storage[]

Humans impact how much water is stored on land. Building dams prevents large masses of water from flowing into the sea and therefore increases the storage of water on land. On the other hand, humans extract water from lakes, wetlands and underground reservoirs for food production leading to rising seas. Furthermore, the hydrological cycle is influenced by climate change and deforestation, which can lead to further positive and negative contributions to sea level rise. In the 20th century, these processes roughly balanced, but dam building has slowed down and is expected to stay low for the 21st century.[88][21]: 1155
Projections[]

There are broadly two ways of modelling sea level rise and making future projections. In one approach, scientists use process-based modelling, where all relevant and well-understood physical processes are included in a global physical model. An ice-sheet model is used to calculate the contributions of ice sheets and a general circulation model is used to compute the rising sea temperature and its expansion. A disadvantage of this method is that not all relevant processes might be understood to a sufficient level, but it can predict non-linearities and long delays in the response which studies of the recent past will miss.
In the other approach, scientists use semi-empirical techniques that use geological data from the past to determine likely sea level responses to a warming world in addition to some basic physical modelling.[3] These semi-empirical sea level models rely on statistical techniques, using relationships between observed past (contributions to) global mean sea level and global mean temperature.[90] This type of modelling was partially motivated by most physical models in previous literature assessments by the Intergovernmental Panel on Climate Change (IPCC) having underestimated the amount of sea level rise compared to observations of the 20th century.[21]
Projections for the 21st century[]
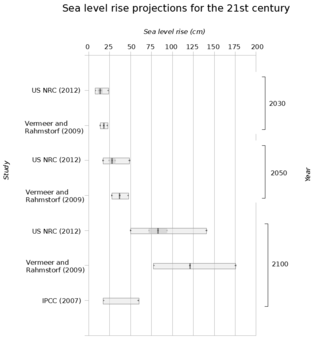
In its fifth assessment report (2013) the Intergovernmental Panel on Climate Change (IPCC) estimated how much sea level is likely to rise in the 21st century based on different levels of greenhouse gas emissions. These projections are based on well-known factors which contribute to sea level rise, but exclude other processes which are less well understood. If countries make rapid cuts to emissions (the RCP2.6 scenario), the IPCC deems it likely that the sea level will rise by 26–55 cm (10–22 in) with a 67% confidence interval. If emissions remain very high, the IPCC projects sea level will rise by 52–98 cm (20–39 in).[21] In August 2020 scientists reported that observed ice-sheet losses in Greenland and Antarctica track worst-case scenarios of the IPCC Fifth Assessment Report's sea-level rise projections.[91][92][93][94]
Since the publication of the 2013 IPCC assessment, attempts have been made to include more physical processes and to develop models that can project sea level rise using paleoclimate data. This typically led to higher estimates of sea level rise.[62][57][95] For instance, a 2016 study led by Jim Hansen concluded that based on past climate change data, sea level rise could accelerate exponentially in the coming decades, with a doubling time of 10, 20 or 40 years, respectively, raising the ocean by several meters in 50, 100 or 200 years.[95] However, Greg Holland from the National Center for Atmospheric Research, who reviewed the study, noted: “There is no doubt that the sea level rise, within the IPCC, is a very conservative number, so the truth lies somewhere between IPCC and Jim.”[96]
In addition, one 2017 study's scenario, assuming high fossil fuel use for combustion and strong economic growth during this century, projects sea level rise of up to 132 cm (4.3 ft) on average — and an extreme scenario with as much as 189 cm (6.2 ft), by 2100. This could mean rapid sea level rise of up to 19 mm (0.75 in) per year by the end of the century. The study also concluded that the Paris climate agreement emissions scenario, if met, would result in a median 52 cm (20 in) of sea level rise by 2100.[97][98]
According to the Fourth (2017) National Climate Assessment (NCA) of the United States it is very likely sea level will rise between 30 and 130 cm (1.0–4.3 feet) in 2100 compared to the year 2000. A rise of 2.4 m (8 feet) is physically possible under a high emission scenario but the authors were unable to say how likely. This worst-case scenario can only come about with a large contribution from Antarctica; a region that is difficult to model.[1]
The possibility of a collapse of the West-Antarctic ice sheet and subsequent rapid sea level rise was suggested back in the 1970s.[62] For instance, Mercer published a study in 1978 predicting that anthropogenic carbon dioxide warming and its potential effects on climate in the 21st century could cause a sea level rise of around 5 metres (16 ft) from melting of the West Antarctic ice-sheet alone.[99][62]
In 2019, a study projected that in low emission scenario, sea level will rise 30 centimeters by 2050 and 69 centimetres by 2100, relative to the level in 2000. In high emission scenario, it will be 34 cm by 2050 and 111 cm by 2100. There is the probability that the rise will be beyond 2 metres by 2100 in the high emission scenario, which will cause displacement of 187 million people.[100]
In September 2019 the Intergovernmental Panel on Climate Change published a report about the impact of climate change on the oceans including sea level rise. The main idea in the report according to one of his authors Michael Oppenheimer is that if humanity will drastically reduce Greenhouse gas emission in the next decades the problem will be tough but manageable. If the rise in emission will continue the problem will become unmanageable.[101]
In February 2021, researchers from Denmark and Norway suggested that past projections for global sea level rise by 2100 reported by the IPCC were likely conservative, and that sea levels will rise more than previously expected.[10]
According to the IPCC Sixth Assessment Report in the very low - emissions scenario, by 2100 the sea level will rise by 28-55 centimetres, in the intermediate scenario by 44-76 centimetres and in the very high emissions scenario by 63-101 centimetres. Rise of approximately 2 metres cannot be ruled out in the very high emissions scenario.[102]
Long-term sea level rise[]

There is a widespread consensus among climate scientists that sea level rise lags well behind the temperature increase that triggers it, and that substantial long-term sea-level rise will continue for centuries to come even if the temperature stabilizes.[103] Models are able to reproduce paleo records of sea level rise, which provides confidence in their application to long-term future change.[21]: 1189
Both the Greenland ice sheet and Antarctica have tipping points for warming levels that could be reached before the end of the 21st century. Crossing such tipping points would mean that ice-sheet changes are potentially irreversible: a decrease to pre-industrial temperatures may not stabilize the ice sheet once the tipping point has been crossed.[104] Quantifying the exact temperature change for which this tipping point is crossed remains controversial. For Greenland, estimates roughly range between 1 and 4 °C (2 to 7 ℉) above pre-industrial.[104][21] As of 2020, the lower of these values has already been passed. A 2021 analysis of sub-glacial sediment at the bottom of a 1.4 km Greenland ice core finds that the Greenland ice sheet melted away at least once during the last million year, and therefore strongly suggests that its tipping point is below the 2.5 °C maximum positive temperature excursion over that period.[81][82]
Melting of the Greenland ice sheet could contribute an additional 4 to 7.5 m (13 to 25 ft) over many thousands of years.[13] A 2013 study estimated that each degree of temperature rise translates to a 2.3 m (7 ft 7 in) commitment to sea level rise within the next 2,000 years.[105] More recent research, especially into Antarctica, indicates that this is probably a conservative estimate and true long-term sea level rise might be higher.[1] Warming beyond the 2 °C (3.6 °F) target potentially lead to rates of sea-level rise dominated by ice loss from Antarctica. Continued carbon dioxide emissions from fossil fuel sources could cause additional tens of metres of sea level rise, over the next millennia, and the available fossil fuel on Earth is even enough to ultimately melt the entire Antarctic ice sheet, causing about 58 m (190 ft) of sea level rise.[106] After 500 years, sea level rise from thermal expansion alone may have reached only half of its eventual level, which models suggest may lie within ranges of 0.5 to 2 m (2 to 7 ft).[107]
According to the IPCC Sixth Assessment Report in the next 2,000 years the sea level will rise by 2-3 metres if the temperature rise will peak at 1.5 degrees, by 2-6 metres if it will peak at 2 degrees and by 19-22 metres if it will peak at 5 degrees.[102]: SPM-28
By region[]
Sea level rise is not uniform around the globe. Some land masses are moving up or down as a consequence of subsidence (land sinking or settling) or post-glacial rebound (land rising due to the loss of the weight of ice after melting), so that local relative sea level rise may be higher or lower than the global average. There are even regions near current and former glaciers and ice sheets where sea level falls. Furthermore, gravitational effects of changing ice masses and spatially varying patterns of warming lead to differences in the distribution of sea water around the globe.[108][21] The gravitational effects comes into play when a large ice sheet melts. With the loss of mass, the gravitational pull becomes less and local water levels might drop. Further away from the ice sheet water levels will increase more than average. In this light, melt in Greenland has a different fingerprint on regional sea level than melt in Antarctica.[26]
Many ports, urban conglomerations, and agricultural regions are built on river deltas, where subsidence of land contributes to a substantially increased relative sea level rise. This is caused by both unsustainable extraction of groundwater (in some places also by extraction of oil and gas), and by levees and other flood management practices that prevent accumulation of sediments from compensating for the natural settling of deltaic soils.[109] Total human-caused subsidence in the Rhine-Meuse-Scheldt delta (Netherlands) is estimated at 3 to 4 m (10 to 13 ft), over 3 m (10 ft) in urban areas of the Mississippi River Delta (New Orleans), and over 9 m (30 ft) in the Sacramento-San Joaquin River Delta.[110] On the other hand, post-glacial isostatic rebound causes relative sea level fall around the Hudson Bay in Canada and the northern Baltic.[111]
The Atlantic is set to warm at a faster pace than the Pacific. This has consequences for Europe and the U.S. East Coast, which received a sea level rise 3–4 times the global average.[112] The downturn of the Atlantic meridional overturning circulation (AMOC) has been also tied to extreme regional sea level rise on the US Northeast Coast.[113]
Effects[]
Current and future sea level rise is set to have a number of impacts, particularly on coastal systems. Such impacts include increased coastal erosion, higher storm-surge flooding, inhibition of primary production processes, more extensive coastal inundation, changes in surface water quality and groundwater characteristics, increased loss of property and coastal habitats, increased flood risk and potential loss of life, loss of non-monetary cultural resources and values, impacts on agriculture and aquaculture through decline in soil and water quality, and loss of tourism, recreation, and transportation functions.[14]: 356 Many of these impacts are detrimental. Owing to the great diversity of coastal environments; regional and local differences in projected relative sea level and climate changes; and differences in the resilience and adaptive capacity of ecosystems, sectors, and countries, the impacts will be highly variable in time and space. River deltas in Africa and Asia and small island states are particularly vulnerable to sea-level rise.[114]
Globally tens of millions of people will be displaced in the latter decades of the century if greenhouse gases are not reduced drastically. Many coastal areas have large population growth, which results in more people at risk from sea level rise. The rising seas pose both a direct risk: unprotected homes can be flooded, and indirect threats of higher storm surges, tsunamis and king tides. Asia has the largest population at risk from sea level with countries such as Bangladesh, China, India, Indonesia, and Vietnam having very densely populated coastal areas.[115] The effects of displacement are very dependent on how successful governments will be in implementing defenses against the rising sea, with concerns for the poorest countries such as sub-Saharan countries and island nations.[116]
A 2019 study found that the number of people impacted from sea level rise during the 21st century is three times higher that was previously thought. By the year 2050, 150 million will be under the water line during high tide and 300 million will live in zones with floodings every year. By the year 2100, those numbers differ sharply depending on the emission scenario. In a low emission scenario, 140 million will be under water during high tide and 280 million will have flooding each year. In high emission scenario, the numbers arrive to 540 million and 640 million respectively. Seventy per cent of them are from eight countries in Asia: China, Bangladesh, India, Indonesia, Thailand, Vietnam, Japan, Philippines.[117][118]
A 2020 review of 33 publications found that "most global estimates are in the order of tens or hundreds of millions of people exposed to coastal inundation and coastal flooding for different timeframes and scenarios" due to sea level rise.[119]
Coastal areas[]

Due to numerous factors, sea levels are rising at an accelerating rate, which poses a great threat to the human environment, both now and in the future. Although this is a slow and continuous process, its long-term cumulative effects on the world, especially in coastal areas, pose a serious threat. In recent years, some coastal areas have already had to cope with effects accumulated over a long period of change. These areas are sensitive to rising sea levels, changes in the frequency and intensity of storms, increased precipitation, and rising ocean temperatures. Ten per cent of the world's population live in coastal areas that are less than 10 metres (33 ft) above sea level. Furthermore, two thirds of the world's cities with over five million people are located in these low-lying coastal areas.[120] In total, approximately 600 million people live directly on the coast around the world.[121] Using remote laser scanning called LiDAR to measure elevation on the Earth’s surface, researchers found that in the year 2021 267 million people worldwide lived on land less than 2 metres above sea level and that with a 1 metre sea level rise and zero population growth, that number could increase to 410 million people.[122][123]
Present effects[]
Rising seas has also been tied to an increased risk from tsunamis, potentially affecting coastal cities in the Pacific and Atlantic Oceans.[15]
One of the areas in danger is Venice which has experienced significant flooding. The city is located on islands in the delta of the Po and Piave rivers. Sea level rise causes an increase in frequency and magnitude of floodings in the city that already spent more than $6 billion on the flood barrier system.[124][125] Similarly, Florida, which is extremely vulnerable to climate change, is experiencing substantial nuisance flooding and king tide flooding.[126]
Food production in coastal areas is affected by rising sea levels as well. Due to flooding and salt water intrusion into the soil, the salinity of agricultural lands near the sea increases, posing problems for crops that are not salt-resistant. Furthermore, salt intrusion in fresh irrigation water poses a second problem for crops that are irrigated. Newly developed salt-resistant crop variants are currently more expensive than the crops they are set to replace.[127] The farmland in the Nile Delta is affected by salt water flooding,[128] and there is now more salt in the soil and irrigation water in the Red River Delta and the Mekong Delta in Vietnam.[127] Bangladesh and China are affected in a similar way, particularly their rice production.[129]
Future effects[]

Future sea level rise could lead to potentially catastrophic difficulties for shore-based communities in the next centuries: for example, millions of people will be affected in cities such as Miami, Rio de Janeiro, Osaka and Shanghai if following the current trajectory of 3 °C (5.4 °F).[16] The Egyptian city Alexandria faces a similar situation, where hundreds of thousands of people living in the low-lying areas may already have to be relocated in the coming decade.[128] However, modest increases in sea level are likely to be offset when cities adapt by constructing sea walls or through relocating.[132]
Nonpartisan think tank Resources for the Future describes Miami as "the most vulnerable major coastal city in the world" to damages associated with storm-related coastal flooding and sea-level rise.[133] Storm surge will be one of the important disasters caused by sea level rise in the future that can cause the largest loss of life and property in the world's coastal areas. Storm surges have been affected in recent years by rising sea levels, which have increased in frequency and intensity. For example, one of the most severely affected areas is New York City, where study simulations show that the impact of sea level rise on the New York area will be reduced from 100-year flooding to 19–68 years by 2050 and 40–60 years by 2080.[134]
Island nations[]
Atolls and low-lying coastal areas on islands are particularly vulnerable to sea level rise. Possible impacts include coastal erosion, flooding and salt intrusion into soils and freshwater. Sea level rise has the potential to devastate tourism and local economies; a sea level rise of 1.0 m (3.3 ft) would cause partial or complete inundation of 29% of coastal resorts in the Caribbean. A further 49–60% of coastal resorts would be at risk from resulting coastal erosion.[135] It is difficult to assess how much of past erosion and floods have been caused by sea level change, compared to other environmental events such as hurricanes. Adaptation to sea level rise is costly for small island nations as a large portion of their population lives in areas that are at risk.[136]
Maldives, Tuvalu, and other low-lying countries are among the areas that are at the highest level of risk. At current rates, sea level would be high enough to make the Maldives uninhabitable by 2100.[137][138] Geomorphological events such as storms tend to have larger impacts on reef island than sea level rise, for instance at one of the Marshall Islands. These effects include the immediate erosion and subsequent regrowth process that may vary in length from decades to centuries, even resulting in land areas larger than pre-storm values. With an expected rise in the frequency and intensity of storms, they may become more significant in determining island shape and size than sea level rise.[139] The Island nation of Fiji is being impacted by sea level rise.[140] Five of the Solomon Islands have disappeared due to the combined effects of sea level rise and stronger trade winds that were pushing water into the Western Pacific.[141]
In the case all islands of an island nation become uninhabitable or completely submerged by the sea, the states themselves would also become dissolved. Once this happens, all rights on the surrounding area (sea) are removed. This area can be significant as rights extend to a radius of 224 nautical miles (415 km; 258 mi) around the entire island state. Any resources, such as fossil oil, minerals and metals, within this area can be freely dug up by anyone and sold without needing to pay any commission to the (now dissolved) island state.[142]
Ecosystems[]

Coastal ecosystems are facing drastic changes as a consequence of rising sea levels. Many systems might ultimately be lost when sea levels rise too much or too fast. Some ecosystems can move land inward with the high-water mark, but many are prevented from migrating due to natural or artificial barriers. This coastal narrowing, sometimes called 'coastal squeeze' when considering human-made barriers, could result in the loss of habitats such as mudflats and marshes.[19][143]
The mangrove ecosystem is one of the ecosystems affected by rising sea levels. It is an ecological whole composed of mangrove plants growing in and around the mudflats of the tropical coast. Its ecological value is high because it is an ideal home for many species. In recent years, mangroves have been moving inland, but their success depends on various environmental information such as topography and geology. The warmer the climate, the bigger they grow. The mangrove's breathing roots or pneumatophores might grow to be half a metre tall.[144][145] Mangroves and tidal marshes adjust to rising sea levels by building vertically using accumulated sediment and organic matter. If sea level rise is too rapid, they will not be able to keep up and will instead be submerged.[146] More specifically, if the rate of mangrove deposition does not keep up with sea level rise, the key to the extinction of the mangrove ecosystem is the relationship between the rate of inland migration and the rate of sea level rise. If sea levels rise faster than the mangroves can move to land, this can lead to the loss of ecosystems.[147] The ability of mangroves to survive sea-level rise events depend on their ability to migrate inland.[145] As both ecosystems protect against storm surges, waves and tsunamis, losing them makes the effects of sea level rise worse.[148][149] Human activities, such as dam building, may restrict sediment supplies to wetlands, and thereby prevent natural adaptation processes. The loss of some tidal marshes is unavoidable as a consequence.[150]
When seawater reaches inland, problems related to contaminated soils may occur. Also, fish, birds, and coastal plants could lose parts of their habitat.[17] Coral, important for bird and fish life, needs to grow vertically to remain close to the sea surface in order to get enough energy from sunlight. It has so far been able to keep up the vertical growth with the rising seas, but might not be able to do so in the future.[151] In 2016, it was reported that the Bramble Cay melomys, which lived on a Great Barrier Reef island, had probably become extinct because of inundation due to sea level rises.[152] This report was confirmed by the federal government of Australia when it declared the Bramble Cay melomys extinct as of February 2019, making this species the first known mammal to go extinct as a result of sea level rise.[153]
Adaptation[]

Adaptation options to sea level rise can be broadly classified into retreat, accommodate and protect. Retreating is moving people and infrastructure to less exposed areas and preventing further development in areas that are at risk. This type of adaptation is potentially disruptive, as displacement of people might lead to tensions. Accommodation options are measurements that make societies more flexible to sea level rise. Examples are the cultivation of food crops that tolerate a high salt content in the soil and making new building standards which require building to be built higher and have less damage in the case a flood does occur. Finally, areas can be protected by the construction of dams, dikes and by improving natural defenses.[18][154] In more detail, the existing problems are divided into two parts: one is water pollution, and the other is storm surges and floods.[155] Besides, storm surges and flooding can be instantaneous and devastating to cities, and some coastal areas have begun investing in storm water valves to cope with more frequent and severe flooding during high tides.[155]
These adaptation options can be further divided into hard and soft. Hard adaptation relies mostly on capital-intensive human-built infrastructure and involves large-scale changes to human societies and ecological systems. Because of its large scale, it is often not flexible. Soft adaptation involves strengthening natural defenses and adaptation strategies in local communities and the use of simple and modular technology, which can be locally owned. The two types of adaptation might be complementary or mutually exclusive.[154][156]

Many countries are developing concrete plans for adaptation. An example is the extension of the Delta Works in the Netherlands, a country that sits partially below sea level and is subsiding.[157] In 2008, the Dutch Delta Commission, advised in a report that the Netherlands would need a massive new building program to strengthen the country's water defenses against the rising sea for the following 190 years. This included drawing up worst-case plans for evacuations. The plan also included more than €100 billion in new spending through to the year 2100 for precautionary measures, such as broadening coastal dunes and strengthening sea and river dikes. The commission said the country must plan for a rise in the North Sea up to 1.3 metres (4 ft 3 in) by 2100 and plan for a 2–4 metres (7–13 ft) m rise by 2200.[158]
To address the sea level rise threat in Bangladesh, the Bangladesh Delta Plan 2100 has been launched in 2018.[159][160] As of 2020, it was seen falling short of most of its initial targets.[161] The progress is being monitored.[162]
U.S. coastal cities conduct beach nourishment, also known as beach replenishment, where mined sand is trucked in and added, in addition to other adaptation measures such as zoning, restrictions on state funding, and building code standards.[163][164] Some island nations, such as the Republic of Maldives, Kiribati and Tuvalu are considering international migration of their population in response to rising seas. Moving to different countries is not an easy solution, as those who move need to have a steady income and social network in their new country. It might be easier to adapt locally by moving further inland and increasing sediment supply needed for natural erosion protection.[165] In the island nation of Fiji, residents are restoring coral reefs and mangroves to protect themselves against flooding and erosion, which is estimated to be more cost-efficient than building sea-walls.[166]
Adaptation to sea level rise often has to account for other environmental issues, such as land-subsidence or habitat destruction. In 2019, the president of Indonesia, Joko Widodo, declared that the city of Jakarta is sinking to a degree that requires him to move the capital to another city.[167] A study conducted between 1982 and 2010 found that some areas of Jakarta have been sinking by as much as 28 cm (11 inches) per year[168] due to ground water drilling and the weight of its buildings, and the problem is now exacerbated by sea level rise. However, there are concerns that building in a new location will increase tropical deforestation.[169][170] Other so called sinking cities, such as Bangkok or Tokyo, are vulnerable to these compounding subsidence with sea level rise.[171]
See also[]
- Climate emergency declaration
- Climate engineering
- Coastal development hazards
- Coastal sediment supply
- Deficit spending
- Effects of climate change on oceans
- Effects of climate change on island nations
- Hydrosphere
- Islands First
- List of countries by average elevation
- Marine transgression
References[]
- ^ a b c d USGCRP (2017). "Climate Science Special Report. Chapter 12: Sea Level Rise". science2017.globalchange.gov. Retrieved 2018-12-27.
- ^ a b c d e f g WCRP Global Sea Level Budget Group (2018). "Global sea-level budget 1993–present". Earth System Science Data. 10 (3): 1551–1590. Bibcode:2018ESSD...10.1551W. doi:10.5194/essd-10-1551-2018.
This corresponds to a mean sea-level rise of about 7.5 cm over the whole altimetry period. More importantly, the GMSL curve shows a net acceleration, estimated to be at 0.08mm/yr2.
- ^ a b c Mengel, Matthias; Levermann, Anders; Frieler, Katja; Robinson, Alexander; Marzeion, Ben; Winkelmann, Ricarda (8 March 2016). "Future sea level rise constrained by observations and long-term commitment". Proceedings of the National Academy of Sciences. 113 (10): 2597–2602. Bibcode:2016PNAS..113.2597M. doi:10.1073/pnas.1500515113. PMC 4791025. PMID 26903648.
- ^ Climate Change 2014 Synthesis Report Fifth Assessment Report, AR5 (Report). Intergovernmental Panel on Climate Change. 2014. Under all RCP scenarios, the rate of sea level rise will very likely exceed the rate of 2.0 [1.7–2.3] mm/yr observed during 1971–2010
- ^ "Chapter 4: Sea Level Rise and Implications for Low-Lying Islands, Coasts and Communities — Special Report on the Ocean and Cryosphere in a Changing Climate". Retrieved 2021-04-18.
- ^ IPCC, "Summary for Policymakers", Contribution of Working Group I to the Fourth Assessment Report of the Intergovernmental Panel on Climate Change, 2007, page 13-14"Models used to date do not include uncertainties in climate-carbon cycle feedback nor do they include the full effects of changes in ice sheet flow, because a basis in published literature is lacking."
- ^ Mooney, Chris. "Scientists keep upping their projections for how much the oceans will rise this century". The Washington Post.
- ^ Bamber, Jonathan L.; Oppenheimer, Michael; Kopp, Robert E.; Aspinall, Willy P.; Cooke, Roger M. (June 4, 2019). "Ice sheet contributions to future sea-level rise from structured expert judgment". Proceedings of the National Academy of Sciences. 116 (23): 11195–11200. Bibcode:2019PNAS..11611195B. doi:10.1073/pnas.1817205116. PMC 6561295. PMID 31110015.
- ^ Global and Regional Sea Level Rise Scenarios for the United States (PDF) (Report) (NOAA Technical Report NOS CO-OPS 083 ed.). National Oceanic and Atmospheric Administration. January 2017. p. vi. Retrieved 24 August 2018."The projections and results presented in several peer-reviewed publications provide evidence to support a physically plausible GMSL rise in the range of 2.0 meters (m) to 2.7 m, and recent results regarding Antarctic ice-sheet instability indicate that such outcomes may be more likely than previously thought."
- ^ a b Grinsted, Aslak; Christensen, Jens Hesselbjerg (2021-02-02). "The transient sensitivity of sea level rise". Ocean Science. 17 (1): 181–186. Bibcode:2021OcSci..17..181G. doi:10.5194/os-17-181-2021. ISSN 1812-0784. S2CID 234353584.
- ^ "The strange science of melting ice sheets: three things you didn't know". The Guardian. 12 September 2018.
- ^ Bindoff, N.L.; Willebrand, J.; Artale, V.; Cazenave, A.; Gregory, J.; Gulev, S.; Hanawa, K.; Le Quéré, C.; Levitus, S.; Nojiri, Y.; Shum, C.K.; Talley L.D.; Unnikrishnan, A. (2007), "Section 5.5.1: Introductory Remarks", in IPCC AR4 WG1 (ed.), Chapter 5: Observations: Ocean Climate Change and Sea Level, ISBN 978-0-521-88009-1, retrieved 25 January 2017
- ^ a b Box SYN-1: Sustained warming could lead to severe impacts, p. 5, in: Synopsis, in National Research Council 2011
- ^ a b TAR Climate Change 2001: The Scientific Basis (PDF) (Report). International Panel on Climate Change, Cambridge University Press. 2001. ISBN 0521-80767-0. Retrieved 23 July 2021.
- ^ a b "Sea level to increase risk of deadly tsunamis". UPI. 2018.
- ^ a b Holder, Josh; Kommenda, Niko; Watts, Jonathan (3 November 2017). "The three-degree world: cities that will be drowned by global warming". The Guardian. Retrieved 2018-12-28.
- ^ a b "Sea Level Rise". National Geographic. January 13, 2017.
- ^ a b Thomsen, Dana C.; Smith, Timothy F.; Keys, Noni (2012). "Adaptation or Manipulation? Unpacking Climate Change Response Strategies". Ecology and Society. 17 (3). doi:10.5751/es-04953-170320. JSTOR 26269087.
- ^ a b "Sea level rise poses a major threat to coastal ecosystems and the biota they support". birdlife.org. Birdlife International. 2015.
- ^ "Scientists discover evidence for past high-level sea rise". phys.org. 2019-08-30. Retrieved 2019-09-07.
- ^ a b c d e f g h i j Church, J.A.; Clark, P.U. (2013). "Sea Level Change". In Stocker, T.F.; et al. (eds.). Climate Change 2013: The Physical Science Basis. Contribution of Working Group I to the Fifth Assessment Report of the Intergovernmental Panel on Climate Change. Cambridge University Press, Cambridge, United Kingdom and New York, NY, USA.
- ^ "Present CO2 levels caused 20-metre-sea-level rise in the past". www.nioz.nl.
- ^ Lambeck, Kurt; Rouby, Hélène; Purcell, Anthony; Sun, Yiying; Sambridge, Malcolm (28 October 2014). "Sea level and global ice volumes from the Last Glacial Maximum to the Holocene". Proceedings of the National Academy of Sciences of the United States of America. 111 (43): 15296–15303. Bibcode:2014PNAS..11115296L. doi:10.1073/pnas.1411762111. PMC 4217469. PMID 25313072.
- ^ Jones, Richard Selwyn (8 July 2019). "One of the most striking trends – over a century of global-average sea level change". Richard Selwyn Jones. Archived from the original on 30 July 2019. (link to image). For sea level change data, Jones cites Church, J. A.; White, N. J. (September 2011). "Sea-Level Rise from the Late 19th to the Early 21st Century". Surv Geophys. Springer Netherlands. 32 (4–5): 585–602. Bibcode:2011SGeo...32..585C. doi:10.1007/s10712-011-9119-1. S2CID 129765935.
- ^ 27-year Sea Level Rise - TOPEX/JASON NASA Visualization Studio, 5 November 2020.
 This article incorporates text from this source, which is in the public domain.
- ^ a b Rovere, Alessio; Stocchi, Paolo; Vacchi, Matteo (2 August 2016). "Eustatic and Relative Sea Level Changes". Current Climate Change Reports. 2 (4): 221–231. doi:10.1007/s40641-016-0045-7. S2CID 131866367.
- ^ "Ocean Surface Topography from Space". NASA/JPL. Archived from the original on 2011-07-22.
- ^ "Jason-3 Satellite - Mission". www.nesdis.noaa.gov. Retrieved 2018-08-22.
- ^ Nerem, R. S.; Beckley, B. D.; Fasullo, J. T.; Hamlington, B. D.; Masters, D.; Mitchum, G. T. (27 February 2018). "Climate-change–driven accelerated sea-level rise detected in the altimeter era". Proceedings of the National Academy of Sciences of the United States of America. 115 (9): 2022–2025. Bibcode:2018PNAS..115.2022N. doi:10.1073/pnas.1717312115. PMC 5834701. PMID 29440401.
- ^ Michael Le Page (11 May 2015). "Apparent slowing of sea level rise is artefact of satellite data".
- ^ Merrifield, Mark A.; Thompson, Philip R.; Lander, Mark (July 2012). "Multidecadal sea level anomalies and trends in the western tropical Pacific". Geophysical Research Letters. 39 (13): n/a. Bibcode:2012GeoRL..3913602M. doi:10.1029/2012gl052032.
- ^ Mantua, Nathan J.; Hare, Steven R.; Zhang, Yuan; Wallace, John M.; Francis, Robert C. (June 1997). "A Pacific Interdecadal Climate Oscillation with Impacts on Salmon Production". Bulletin of the American Meteorological Society. 78 (6): 1069–1079. Bibcode:1997BAMS...78.1069M. doi:10.1175/1520-0477(1997)078<1069:APICOW>2.0.CO;2.
- ^ Lindsey, Rebecca (2019) Climate Change: Global Sea Level NOAA Climate, 19 November 2019.
- ^ a b Rhein, Monika; Rintoul, Stephan (2013). "Observations: Ocean" (PDF). IPCC AR5 WGI. New York: Cambridge University Press. p. 285.
- ^ "Other Long Records not in the PSMSL Data Set". PSMSL. Retrieved 11 May 2015.
- ^ Hunter, John; R. Coleman; D. Pugh (2003). "The Sea Level at Port Arthur, Tasmania, from 1841 to the Present". Geophysical Research Letters. 30 (7): 1401. Bibcode:2003GeoRL..30.1401H. doi:10.1029/2002GL016813.
- ^ Church, J.A.; White, N.J. (2006). "20th century acceleration in global sea-level rise". Geophysical Research Letters. 33 (1): L01602. Bibcode:2006GeoRL..33.1602C. CiteSeerX 10.1.1.192.1792. doi:10.1029/2005GL024826.
- ^ "Historical sea level changes: Last decades". www.cmar.csiro.au. Retrieved 2018-08-26.
- ^ Neil, White. "Historical Sea Level Changes". CSIRO. Retrieved 25 April 2013.
- ^ "Global and European sea level". European Environmental Agency. 27 November 2017. Retrieved 11 January 2019.
- ^ a b Slater, Thomas; Lawrence, Isobel R.; Otosaka, Inès N.; Shepherd, Andrew; et al. (25 January 2021). "Review article: Earth's ice imbalance". The Cryosphere. 15 (1): 233–246. Bibcode:2021TCry...15..233S. doi:10.5194/tc-15-233-2021. ISSN 1994-0416. S2CID 234098716. Fig. 4.
- ^ Lewis, Tanya (23 September 2013). "Sea level rise overflowing estimates". Science News.
- ^ Rignot, Eric; Mouginot, Jérémie; Scheuchl, Bernd; van den Broeke, Michiel; van Wessem, Melchior J.; Morlighem, Mathieu (22 January 2019). "Four decades of Antarctic Ice Sheet mass balance from 1979–2017". Proceedings of the National Academy of Sciences. 116 (4): 1095–1103. Bibcode:2019PNAS..116.1095R. doi:10.1073/pnas.1812883116. PMC 6347714. PMID 30642972.
- ^ Levitus, S., Boyer, T., Antonov, J., Garcia, H., and Locarnini, R. (2005) "Ocean Warming 1955–2003". Archived from the original on 17 July 2009. Poster presented at the U.S. Climate Change Science Program Workshop, 14–16 November 2005, Arlington VA, Climate Science in Support of Decision-Making; Last viewed 22 May 2009.
- ^ Kuhlbrodt, T; Gregory, J.M. (2012). "Ocean heat uptake and its consequences for the magnitude of sea level rise and climate change" (PDF). Geophysical Research Letters. 39 (18): L18608. Bibcode:2012GeoRL..3918608K. doi:10.1029/2012GL052952.
- ^ Upton, John (2016-01-19). "Deep Ocean Waters Are Trapping Vast Stores of Heat". Scientific American. Retrieved 2019-02-01.
- ^ "How Stuff Works: polar ice caps". howstuffworks.com. 2000-09-21. Retrieved 2006-02-12.
- ^ Winkelmann, R.; Levermann, A.; Martin, M. A.; Frieler, K. (12 December 2012). "Increased future ice discharge from Antarctica owing to higher snowfall". Nature. 492 (7428): 239–242. Bibcode:2012Natur.492..239W. doi:10.1038/nature11616. PMID 23235878. S2CID 4425911.
- ^ a b c d "Antarctica ice melt has accelerated by 280% in the last 4 decades". CNN. Retrieved January 14, 2019.
- ^ Shepherd, Andrew; Ivins, Erik; et al. (IMBIE team) (2012). "A Reconciled Estimate of Ice-Sheet Mass Balance". Science. 338 (6111): 1183–1189. Bibcode:2012Sci...338.1183S. doi:10.1126/science.1228102. hdl:2060/20140006608. PMID 23197528. S2CID 32653236.
- ^ a b c d IMBIE team (13 June 2018). "Mass balance of the Antarctic Ice Sheet from 1992 to 2017". Nature. 558 (7709): 219–222. Bibcode:2018Natur.558..219I. doi:10.1038/s41586-018-0179-y. hdl:2268/225208. PMID 29899482. S2CID 49188002. Lay summary – Ars Technica (2018-06-13).
- ^ a b Edwards, Tamsin L.; Nowicki, Sophie; Marzeion, Ben; Hock, Regine; et al. (5 May 2021). "Projected land ice contributions to twenty-first-century sea level rise". Nature. 593 (7857): 74–82. Bibcode:2021Natur.593...74E. doi:10.1038/s41586-021-03302-y. PMID 33953415. S2CID 233871029.
- ^ Fretwell, P.; Pritchard, H. D.; Vaughan, D. G.; Bamber, J. L.; Barrand, N. E.; Bell, R.; Bianchi, C.; Bingham, R. G.; Blankenship, D. D.; Casassa, G.; Catania, G.; Callens, D.; Conway, H.; Cook, A. J.; Corr, H. F. J.; Damaske, D.; Damm, V.; Ferraccioli, F.; Forsberg, R.; Fujita, S.; Gim, Y.; Gogineni, P.; Griggs, J. A.; Hindmarsh, R. C. A.; Holmlund, P.; Holt, J. W.; Jacobel, R. W.; Jenkins, A.; Jokat, W.; Jordan, T.; King, E. C.; Kohler, J.; Krabill, W.; Riger-Kusk, M.; Langley, K. A.; Leitchenkov, G.; Leuschen, C.; Luyendyk, B. P.; Matsuoka, K.; Mouginot, J.; Nitsche, F. O.; Nogi, Y.; Nost, O. A.; Popov, S. V.; Rignot, E.; Rippin, D. M.; Rivera, A.; Roberts, J.; Ross, N.; Siegert, M. J.; Smith, A. M.; Steinhage, D.; Studinger, M.; Sun, B.; Tinto, B. K.; Welch, B. C.; Wilson, D.; Young, D. A.; Xiangbin, C.; Zirizzotti, A. (28 February 2013). "Bedmap2: improved ice bed, surface and thickness datasets for Antarctica". The Cryosphere. 7 (1): 375–393. Bibcode:2013TCry....7..375F. doi:10.5194/tc-7-375-2013.
- ^ Greene, Chad A.; Blankenship, Donald D.; Gwyther, David E.; Silvano, Alessandro; van Wijk, Esmee (1 November 2017). "Wind causes Totten Ice Shelf melt and acceleration". Science Advances. 3 (11): e1701681. Bibcode:2017SciA....3E1681G. doi:10.1126/sciadv.1701681. PMC 5665591. PMID 29109976.
- ^ Roberts, Jason; Galton-Fenzi, Benjamin K.; Paolo, Fernando S.; Donnelly, Claire; Gwyther, David E.; Padman, Laurie; Young, Duncan; Warner, Roland; Greenbaum, Jamin; Fricker, Helen A.; Payne, Antony J.; Cornford, Stephen; Le Brocq, Anne; van Ommen, Tas; Blankenship, Don; Siegert, Martin J. (2018). "Ocean forced variability of Totten Glacier mass loss". Geological Society, London, Special Publications. 461 (1): 175–186. Bibcode:2018GSLSP.461..175R. doi:10.1144/sp461.6. S2CID 55567382.
- ^ Greene, Chad A.; Young, Duncan A.; Gwyther, David E.; Galton-Fenzi, Benjamin K.; Blankenship, Donald D. (6 September 2018). "Seasonal dynamics of Totten Ice Shelf controlled by sea ice buttressing". The Cryosphere. 12 (9): 2869–2882. Bibcode:2018TCry...12.2869G. doi:10.5194/tc-12-2869-2018.
- ^ a b c d Pollard, David; DeConto, Robert M.; Alley, Richard B. (February 2015). "Potential Antarctic Ice Sheet retreat driven by hydrofracturing and ice cliff failure". Earth and Planetary Science Letters. 412: 112–121. Bibcode:2015E&PSL.412..112P. doi:10.1016/j.epsl.2014.12.035.
- ^ Greenbaum, J. S.; Blankenship, D. D.; Young, D. A.; Richter, T. G.; Roberts, J. L.; Aitken, A. R. A.; Legresy, B.; Schroeder, D. M.; Warner, R. C.; van Ommen, T. D.; Siegert, M. J. (16 March 2015). "Ocean access to a cavity beneath Totten Glacier in East Antarctica". Nature Geoscience. 8 (4): 294–298. Bibcode:2015NatGe...8..294G. doi:10.1038/ngeo2388.
- ^ Rignot, Eric; Bamber, Jonathan L.; van den Broeke, Michiel R.; Davis, Curt; Li, Yonghong; van de Berg, Willem Jan; van Meijgaard, Erik (13 January 2008). "Recent Antarctic ice mass loss from radar interferometry and regional climate modelling". Nature Geoscience. 1 (2): 106–110. Bibcode:2008NatGe...1..106R. doi:10.1038/ngeo102.
- ^ Ludescher, Josef; Bunde, Armin; Franzke, Christian L. E.; Schellnhuber, Hans Joachim (16 April 2015). "Long-term persistence enhances uncertainty about anthropogenic warming of Antarctica". Climate Dynamics. 46 (1–2): 263–271. Bibcode:2016ClDy...46..263L. doi:10.1007/s00382-015-2582-5. S2CID 131723421.
- ^ Robel, Alexander A.; Seroussi, Hélène; Roe, Gerard H. (23 July 2019). "Marine ice sheet instability amplifies and skews uncertainty in projections of future sea-level rise". Proceedings of the National Academy of Sciences. 116 (30): 14887–14892. Bibcode:2019PNAS..11614887R. doi:10.1073/pnas.1904822116. PMC 6660720. PMID 31285345.
- ^ a b c d Pattyn, Frank (16 July 2018). "The paradigm shift in Antarctic ice sheet modelling". Nature Communications. 9 (1): 2728. Bibcode:2018NatCo...9.2728P. doi:10.1038/s41467-018-05003-z. PMC 6048022. PMID 30013142.
- ^ "After Decades of Losing Ice, Antarctica Is Now Hemorrhaging It". The Atlantic. 2018.
- ^ "Marine ice sheet instability". AntarcticGlaciers.org. 2014.
- ^ Rosane, Olivia (16 September 2020). "Antarctica's 'Doomsday Glacier' Is Starting to Crack". Proceedings of the National Academy of Sciences. Ecowatch. Retrieved 18 October 2020.
- ^ Bamber, J.L.; Riva, R.E.M.; Vermeersen, B.L.A.; LeBrocq, A.M. (14 May 2009). "Reassessment of the Potential Sea-Level Rise from a Collapse of the West Antarctic Ice Sheet". Science. 324 (5929): 901–903. Bibcode:2009Sci...324..901B. doi:10.1126/science.1169335. PMID 19443778. S2CID 11083712.
- ^ Joughin, Ian; Alley, Richard B. (24 July 2011). "Stability of the West Antarctic ice sheet in a warming world". Nature Geoscience. 4 (8): 506–513. Bibcode:2011NatGe...4..506J. doi:10.1038/ngeo1194.
- ^ "NASA Earth Observatory - Newsroom". earthobservatory.nasa.gov. 18 January 2019.
- ^ a b Bob Berwyn (2018). "What's Eating Away at the Greenland Ice Sheet?". Inside Climate News.
- ^ Kjeldsen, Kristian K.; Korsgaard, Niels J.; Bjørk, Anders A.; Khan, Shfaqat A.; Box, Jason E.; Funder, Svend; Larsen, Nicolaj K.; Bamber, Jonathan L.; Colgan, William; van den Broeke, Michiel; Siggaard-Andersen, Marie-Louise; Nuth, Christopher; Schomacker, Anders; Andresen, Camilla S.; Willerslev, Eske; Kjær, Kurt H. (16 December 2015). "Spatial and temporal distribution of mass loss from the Greenland Ice Sheet since AD 1900". Nature. 528 (7582): 396–400. Bibcode:2015Natur.528..396K. doi:10.1038/nature16183. hdl:10852/50174. PMID 26672555. S2CID 4468824.
- ^ Joughin, Ian; Abdalati, Waleed; Fahnestock, Mark (December 2004). "Large fluctuations in speed on Greenland's Jakobshavn Isbræ glacier". Nature. 432 (7017): 608–610. Bibcode:2004Natur.432..608J. doi:10.1038/nature03130. PMID 15577906. S2CID 4406447.
- ^ Connor, Steve (2005). "Melting Greenland glacier may hasten rise in sea level". The Independent. Retrieved 2010-04-30.
- ^ Noël, B.; van de Berg, W. J; Lhermitte, S.; Wouters, B.; Machguth, H.; Howat, I.; Citterio, M.; Moholdt, G.; Lenaerts, J. T. M.; van den Broeke, M. R. (31 March 2017). "A tipping point in refreezing accelerates mass loss of Greenland's glaciers and ice caps". Nature Communications. 8 (1): 14730. Bibcode:2017NatCo...814730N. doi:10.1038/ncomms14730. PMC 5380968. PMID 28361871.
- ^ Mosbergen, Dominique (2017). "Greenland's Coastal Ice Caps Have Melted Past The Point Of No Return". Huffington Post.
- ^ Bamber, Jonathan L; Westaway, Richard M; Marzeion, Ben; Wouters, Bert (1 June 2018). "The land ice contribution to sea level during the satellite era". Environmental Research Letters. 13 (6): 063008. Bibcode:2018ERL....13f3008B. doi:10.1088/1748-9326/aac2f0.
- ^ "Greenland ice loss is at 'worse-case scenario' levels, study finds". UCI News. 2019-12-19. Retrieved 2019-12-28.
- ^ Shepherd, Andrew; Ivins, Erik; Rignot, Eric; Smith, Ben; van den Broeke, Michiel; Velicogna, Isabella; Whitehouse, Pippa; Briggs, Kate; Joughin, Ian; Krinner, Gerhard; Nowicki, Sophie (2020-03-12). "Mass balance of the Greenland Ice Sheet from 1992 to 2018". Nature. 579 (7798): 233–239. doi:10.1038/s41586-019-1855-2. hdl:2268/242139. ISSN 1476-4687. PMID 31822019. S2CID 219146922.
- ^ Davidson, Jordan (1 October 2020). "Greenland Ice Sheet Melting Faster Than at Any Time in Last 12,000 Years, Study Finds". Ecowatch. Retrieved 18 October 2020.
- ^ Irvalı, Nil; Galaasen, Eirik V.; Ninnemann, Ulysses S.; Rosenthal, Yair; Born, Andreas; Kleiven, Helga (Kikki) F. (2019-12-18). "A low climate threshold for south Greenland Ice Sheet demise during the Late Pleistocene". Proceedings of the National Academy of Sciences. 117 (1): 190–195. doi:10.1073/pnas.1911902116. ISSN 0027-8424. PMC 6955352. PMID 31871153.
- ^ Robinson, Alexander; Calov, Reinhard; Ganopolski, Andrey (11 March 2012). "Multistability and critical thresholds of the Greenland ice sheet". Nature Climate Change. 2 (6): 429–432. Bibcode:2012NatCC...2..429R. doi:10.1038/nclimate1449.
- ^ a b Garric, Audrey (15 March 2021). "La calotte glaciaire du Groenland a déjà fondu au moins une fois au cours du dernier million d'années". Le Monde.
- ^ a b Christ, Andrew J.; Bierman, Paul R.; Schaefer, Joerg M.; Dahl-Jensen, Dorthe; Steffensen, Jørgen P.; Corbett, Lee B.; Peteet, Dorothy M.; Thomas, Elizabeth K.; Steig, Eric J.; Rittenour, Tammy M.; Tison, Jean-Louis; Blard, Pierre-Henri; Perdrial, Nicolas; Dethier, David P.; Lini, Andrea; Hidy, Alan J.; Caffee, Marc W.; Southon, John (30 March 2021). "A multimillion-year-old record of Greenland vegetation and glacial history preserved in sediment beneath 1.4 km of ice at Camp Century". Proceedings of the National Academy of Sciences of the United States. 118 (13): e2021442118. Bibcode:2021PNAS..11821442C. doi:10.1073/pnas.2021442118. PMC 8020747. PMID 33723012.
- ^ Radić, Valentina; Hock, Regine (9 January 2011). "Regionally differentiated contribution of mountain glaciers and ice caps to future sea-level rise". Nature Geoscience. 4 (2): 91–94. Bibcode:2011NatGe...4...91R. doi:10.1038/ngeo1052.
- ^ a b Huss, Matthias; Hock, Regine (30 September 2015). "A new model for global glacier change and sea-level rise". Frontiers in Earth Science. 3: 54. Bibcode:2015FrEaS...3...54H. doi:10.3389/feart.2015.00054. S2CID 3256381.
- ^ Vaughan, David G.; Comiso, Josefino C (2013). "Observations: Cryosphere" (PDF). IPCC AR5 WGI. New York: Cambridge University Press.
- ^ Dyurgerov, Mark (2002). Glacier Mass Balance and Regime Measurements and Analysis, 1945-2003 (Report). doi:10.7265/N52N506F.
- ^ Noerdlinger, Peter D.; Brower, Kay R. (July 2007). "The melting of floating ice raises the ocean level". Geophysical Journal International. 170 (1): 145–150. Bibcode:2007GeoJI.170..145N. doi:10.1111/j.1365-246X.2007.03472.x.
- ^ Wada, Yoshihide; Reager, John T.; Chao, Benjamin F.; Wang, Jida; Lo, Min-Hui; Song, Chunqiao; Li, Yuwen; Gardner, Alex S. (15 November 2016). "Recent Changes in Land Water Storage and its Contribution to Sea Level Variations". Surveys in Geophysics. 38 (1): 131–152. doi:10.1007/s10712-016-9399-6. PMC 7115037. PMID 32269399.
- ^ "January 2017 analysis from NOAA: Global and Regional Sea Level Rise Scenarios for the United States" (PDF).
- ^ Hoegh-Guldberg, O.; Jacob, Daniela; Taylor, Michael (2018). "Impacts of 1.5°C of Global Warming on Natural and Human Systems" (PDF). Special Report: Global Warming of 1.5 ºC. In Press.
- ^ "Sea level rise from ice sheets track worst-case climate change scenario". phys.org. Retrieved 8 September 2020.
- ^ "Earth's ice sheets tracking worst-case climate scenarios". The Japan Times. 1 September 2020. Retrieved 8 September 2020.
- ^ "Ice sheet melt on track with 'worst-case climate scenario'". www.esa.int. Retrieved 8 September 2020.
- ^ Slater, Thomas; Hogg, Anna E.; Mottram, Ruth (31 August 2020). "Ice-sheet losses track high-end sea-level rise projections". Nature Climate Change. 10 (10): 879–881. Bibcode:2020NatCC..10..879S. doi:10.1038/s41558-020-0893-y. ISSN 1758-6798. S2CID 221381924. Archived from the original on 2 September 2020. Retrieved 8 September 2020. Alt URL
- ^ a b Hansen, James; Sato, Makiko; Hearty, Paul; Ruedy, Reto; Kelley, Maxwell; Masson-Delmotte, Valerie; Russell, Gary; Tselioudis, George; Cao, Junji; Rignot, Eric; Velicogna, Isabella; Tormey, Blair; Donovan, Bailey; Kandiano, Evgeniya; von Schuckmann, Karina; Kharecha, Pushker; Legrande, Allegra N.; Bauer, Michael; Lo, Kwok-Wai (22 March 2016). "Ice melt, sea level rise and superstorms: evidence from paleoclimate data, climate modeling, and modern observations that 2 °C global warming could be dangerous". Atmospheric Chemistry and Physics. 16 (6): 3761–3812. arXiv:1602.01393. Bibcode:2016ACP....16.3761H. doi:10.5194/acp-16-3761-2016. S2CID 9410444.
- ^ "James Hansen's controversial sea level rise paper has now been published online". The Washington Post. 2015.
- ^ Chris Mooney (October 26, 2017). "New science suggests the ocean could rise more — and faster — than we thought". The Chicago Tribune.
- ^ Nauels, Alexander; Rogelj, Joeri; Schleussner, Carl-Friedrich; Meinshausen, Malte; Mengel, Matthias (1 November 2017). "Linking sea level rise and socioeconomic indicators under the Shared Socioeconomic Pathways". Environmental Research Letters. 12 (11): 114002. Bibcode:2017ERL....12k4002N. doi:10.1088/1748-9326/aa92b6.
- ^ Mercer, J. H. (January 1978). "West Antarctic ice sheet and CO2 greenhouse effect: a threat of disaster". Nature. 271 (5643): 321–325. Bibcode:1978Natur.271..321M. doi:10.1038/271321a0. S2CID 4149290.
- ^ L. Bamber, Jonathan; Oppenheimer, Michael; E. Kopp, Robert; P. Aspinall, Willy; M. Cooke, Roger (May 2019). "Ice sheet contributions to future sea-level rise from structured expert judgment". Proceedings of the National Academy of Sciences. 116 (23): 11195–11200. Bibcode:2019PNAS..11611195B. doi:10.1073/pnas.1817205116. PMC 6561295. PMID 31110015.
- ^ MEYER, ROBINSON (September 25, 2019). "The Oceans We Know Won't Survive Climate Change". The Atlantic. Retrieved 29 September 2019.
- ^ a b : SPM-28 Masson-Delmotte, Valérie; Zhai, Panmao; Pirani, Anna; Connors, Sarah L.; Péan, Clotilde; Berger, Sophie; Caud, Nada; Chen, Yang; Goldfarb, Leah; Gomis, Melissa I.; Huang, Mengtian; Leitzell, Katherine; Lonnoy, Elisabeth; Matthews, J. B. Robin; Maycock, Tom K.; Waterfield, Tim; Yelekçi, Ozge; Yu, Rong; Zhou, Baiquan, eds. (2021-08-09). "Summary for Policymakers". Climate Change 2021: The Physical Science Basis. Contribution of Working Group I to the Sixth Assessment Report of the Intergovernmental Panel on Climate Change (PDF). IPCC / Cambridge University Press. Archived (PDF) from the original on 2021-08-13. Retrieved 2021-08-09.
- ^ National Research Council (2010). "7 Sea Level Rise and the Coastal Environment". Advancing the Science of Climate Change. Washington, D.C.: The National Academies Press. p. 245. doi:10.17226/12782. ISBN 978-0-309-14588-6. Retrieved 2011-06-17.
- ^ a b Pattyn, Frank; Ritz, Catherine; Hanna, Edward; Asay-Davis, Xylar; DeConto, Rob; Durand, Gaël; Favier, Lionel; Fettweis, Xavier; Goelzer, Heiko; Golledge, Nicholas R.; Kuipers Munneke, Peter; Lenaerts, Jan T. M.; Nowicki, Sophie; Payne, Antony J.; Robinson, Alexander; Seroussi, Hélène; Trusel, Luke D.; van den Broeke, Michiel (12 November 2018). "The Greenland and Antarctic ice sheets under 1.5 °C global warming" (PDF). Nature Climate Change. 8 (12): 1053–1061. Bibcode:2018NatCC...8.1053P. doi:10.1038/s41558-018-0305-8. S2CID 91886763.
- ^ Levermann, Anders; Clark, Peter U.; Marzeion, Ben; Milne, Glenn A.; Pollard, David; Radic, Valentina; Robinson, Alexander (20 August 2013). "The multimillennial sea-level commitment of global warming". Proceedings of the National Academy of Sciences. 110 (34): 13745–13750. Bibcode:2013PNAS..11013745L. doi:10.1073/pnas.1219414110. PMC 3752235. PMID 23858443.
- ^ Winkelmann, Ricarda; Levermann, Anders; Ridgwell, Andy; Caldeira, Ken (11 September 2015). "Combustion of available fossil fuel resources sufficient to eliminate the Antarctic Ice Sheet". Science Advances. 1 (8): e1500589. Bibcode:2015SciA....1E0589W. doi:10.1126/sciadv.1500589. PMC 4643791. PMID 26601273.
- ^ Solomon, Susan; Plattner, Gian-Kasper; Knutti, Reto; Friedlingstein, Pierre (10 February 2009). "Irreversible climate change due to carbon dioxide emissions". Proceedings of the National Academy of Sciences. 106 (6): 1704–1709. Bibcode:2009PNAS..106.1704S. doi:10.1073/pnas.0812721106. PMC 2632717. PMID 19179281.
- ^ Katsman, Caroline A.; Sterl, A.; Beersma, J. J.; van den Brink, H. W.; Church, J. A.; Hazeleger, W.; Kopp, R. E.; Kroon, D.; Kwadijk, J. (2011). "Exploring high-end scenarios for local sea level rise to develop flood protection strategies for a low-lying delta—the Netherlands as an example". Climatic Change. 109 (3–4): 617–645. doi:10.1007/s10584-011-0037-5. ISSN 0165-0009. S2CID 2242594.
- ^ Bucx et al. 2010, p. 88;Tessler et al. 2015, p. 638
- ^ Bucx et al. 2010, pp. 81, 88, 90
- ^ Cazenave, Anny; Nicholls, Robert J. (2010). "Sea-Level Rise and Its Impact on Coastal Zones". Science. 328 (5985): 1517–1520. Bibcode:2010Sci...328.1517N. doi:10.1126/science.1185782. ISSN 0036-8075. PMID 20558707. S2CID 199393735.
- ^ "Why the U.S. East Coast could be a major 'hotspot' for rising seas". The Washington Post. 2016.
- ^ Jianjun Yin & Stephen Griffies (March 25, 2015). "Extreme sea level rise event linked to AMOC downturn". CLIVAR.
- ^ Mimura, Nobuo (2013). "Sea-level rise caused by climate change and its implications for society". Proceedings of the Japan Academy. Series B, Physical and Biological Sciences. 89 (7): 281–301. Bibcode:2013PJAB...89..281M. doi:10.2183/pjab.89.281. ISSN 0386-2208. PMC 3758961. PMID 23883609.
- ^ McLeman, Robert (2018). "Migration and displacement risks due to mean sea-level rise". Bulletin of the Atomic Scientists. 74 (3): 148–154. Bibcode:2018BuAtS..74c.148M. doi:10.1080/00963402.2018.1461951. ISSN 0096-3402. S2CID 150179939.
- ^ Nicholls, Robert J.; Marinova, Natasha; Lowe, Jason A.; Brown, Sally; Vellinga, Pier; Gusmão, Diogo de; Hinkel, Jochen; Tol, Richard S. J. (2011). "Sea-level rise and its possible impacts given a 'beyond 4°C world' in the twenty-first century". Philosophical Transactions of the Royal Society of London A: Mathematical, Physical and Engineering Sciences. 369 (1934): 161–181. Bibcode:2011RSPTA.369..161N. doi:10.1098/rsta.2010.0291. ISSN 1364-503X. PMID 21115518. S2CID 8238425.
- ^ Kulp, Scott A.; Strauss, Benjamin H. (29 October 2019). "New elevation data triple estimates of global vulnerability to sea-level rise and coastal flooding". Nature Communications. 10 (1): 4844. Bibcode:2019NatCo..10.4844K. doi:10.1038/s41467-019-12808-z. PMC 6820795. PMID 31664024.
- ^ Rosane, Olivia (October 30, 2019). "300 Million People Worldwide Could Suffer Yearly Flooding by 2050". Ecowatch. Retrieved 31 October 2019.
- ^ McMichael, Celia; Dasgupta, Shouro; Ayeb-Karlsson, Sonja; Kelman, Ilan (2020-11-27). "A review of estimating population exposure to sea-level rise and the relevance for migration". Environmental Research Letters. 15 (12): 123005. Bibcode:2020ERL....15l3005M. doi:10.1088/1748-9326/abb398. ISSN 1748-9326. PMC 8208600. PMID 34149864.
- ^ McGranahan, Gordon; Balk, Deborah; Anderson, Bridget (29 June 2016). "The rising tide: assessing the risks of climate change and human settlements in low elevation coastal zones". Environment and Urbanization. 19 (1): 17–37. doi:10.1177/0956247807076960. S2CID 154588933.
- ^ Sengupta, Somini (13 February 2020). "A Crisis Right Now: San Francisco and Manila Face Rising Seas". The New York Times. Photographer: Chang W. Lee. Retrieved 4 March 2020.
- ^ Storer, Rhi (2021-06-29). "Up to 410 million people at risk from sea level rises – study". The Guardian. Retrieved 2021-07-01.
- ^ Hooijer, A.; Vernimmen, R. (2021-06-29). "Global LiDAR land elevation data reveal greatest sea-level rise vulnerability in the tropics". Nature Communications. 12 (1): 3592. Bibcode:2021NatCo..12.3592H. doi:10.1038/s41467-021-23810-9. ISSN 2041-1723. PMC 8242013. PMID 34188026.
- ^ Calma, Justine (November 14, 2019). "Venice's historic flooding blamed on human failure and climate change". The Verge. Retrieved 17 November 2019.
- ^ Shepherd, Marshall (16 November 2019). "Venice Flooding Reveals A Real Hoax About Climate Change - Framing It As "Either/Or"". Forbes. Retrieved 17 November 2019.
- ^ "Florida Coastal Flooding Maps: Residents Deny Predicted Risks to Their Property". EcoWatch. 2020-02-10. Retrieved 2021-01-31.
- ^ a b Nagothu, Udaya Sekhar (2017-01-18). "Food security threatened by sea-level rise". Nibio. Retrieved 2018-10-21.
- ^ a b Michaelson, Ruth (25 August 2018). "Houses claimed by the canal: life on Egypt's climate change frontline". The Guardian. Retrieved 30 August 2018.
- ^ "Potential Impacts of Sea-Level Rise on Populations and Agriculture". www.fao.org. Retrieved 2018-10-21.
- ^ File:Projections of global mean sea level rise by Parris et al. (2012).png
- ^ Sea level rise chart
- ^ "IPCC's New Estimates for Increased Sea-Level Rise". Yale. 2013.
- ^ Cusick, Daniel (4 November 2020). "Miami Is the "Most Vulnerable" Coastal City Worldwide". Scientific American.
- ^ Gornitz, Vivien (2002). "Impact of Sea Level Rise in the New York City Metropolitan Area" (PDF). Global and Planetary Change. Retrieved 2020-08-09.
- ^ Thomas, Adelle; Baptiste, April; Martyr-Koller, Rosanne; Pringle, Patrick; Rhiney, Kevon (2020-10-17). "Climate Change and Small Island Developing States". Annual Review of Environment and Resources. 45 (1): 1–27. doi:10.1146/annurev-environ-012320-083355. ISSN 1543-5938.
- ^ Nurse, Leonard A.; McLean, Roger (2014). "29: Small Islands" (PDF). In Barros, VR; Field (eds.). AR5 WGII. Cambridge University Press.
- ^ Megan Angelo (1 May 2009). "Honey, I Sunk the Maldives: Environmental changes could wipe out some of the world's most well-known travel destinations".
- ^ Kristina Stefanova (19 April 2009). "Climate refugees in Pacific flee rising sea". The Washington Times.
- ^ Ford, Murray R.; Kench, Paul S. (2016). "Spatiotemporal variability of typhoon impacts and relaxation intervals on Jaluit Atoll, Marshall Islands". Geology. 44 (2): 159–162. Bibcode:2016Geo....44..159F. doi:10.1130/g37402.1.
- ^ "Vanua in the Anthropocene: Relationality and Sea Level Rise in Fiji" by Maebh Long, Symploke (2018), 26(1-2), 51-70.
- ^ Klein, Alice. "Five Pacific islands vanish from sight as sea levels rise". New Scientist. Retrieved 2016-05-09.
- ^ Alfred Henry Adriaan Soons (1989). Zeegrenzen en zeespiegelrijzing : volkenrechtelijke beschouwingen over de effecten van het stijgen van de zeespiegel op grenzen in zee : rede, uitgesproken bij de aanvaarding van het ambt van hoogleraar in het volkenrecht aan de Rijksuniversiteit te Utrecht op donderdag 13 april 1989 [Sea borders and rising sea levels: international law considerations about the effects of rising sea levels on borders at sea: speech, pronounced with the acceptance of the post of professor in international law at the University of Utrecht on 13 April 1989] (in Dutch). Kluwers. ISBN 978-90-268-1925-4.[page needed]
- ^ Pontee, Nigel (November 2013). "Defining coastal squeeze: A discussion". Ocean & Coastal Management. 84: 204–207. doi:10.1016/j.ocecoaman.2013.07.010.
- ^ "Mangroves - Northland Regional Council". www.nrc.govt.nz.
- ^ a b Kumara, M. P.; Jayatissa, L. P.; Krauss, K. W.; Phillips, D. H.; Huxham, M. (2010). "High mangrove density enhances surface accretion, surface elevation change, and tree survival in coastal areas susceptible to sea-level rise". Oecologia. 164 (2): 545–553. Bibcode:2010Oecol.164..545K. doi:10.1007/s00442-010-1705-2. JSTOR 40864709. PMID 20593198. S2CID 6929383.
- ^ Krauss, Ken W.; McKee, Karen L.; Lovelock, Catherine E.; Cahoon, Donald R.; Saintilan, Neil; Reef, Ruth; Chen, Luzhen (April 2014). "How mangrove forests adjust to rising sea level". New Phytologist. 202 (1): 19–34. doi:10.1111/nph.12605. PMID 24251960.
- ^ Soares, M.L.G. (2009). "A Conceptual Model for the Responses of Mangrove Forests to Sea Level Rise". Journal of Coastal Research: 267–271. JSTOR 25737579.
- ^ Crosby, Sarah C.; Sax, Dov F.; Palmer, Megan E.; Booth, Harriet S.; Deegan, Linda A.; Bertness, Mark D.; Leslie, Heather M. (November 2016). "Salt marsh persistence is threatened by predicted sea-level rise". Estuarine, Coastal and Shelf Science. 181: 93–99. Bibcode:2016ECSS..181...93C. doi:10.1016/j.ecss.2016.08.018.
- ^ Spalding, M.; McIvor, A.; Tonneijck, F.H.; Tol, S.; van Eijk, P. (2014). "Mangroves for coastal defence. Guidelines for coastal managers & policy makers" (PDF). Wetlands International and The Nature Conservancy.
- ^ Weston, Nathaniel B. (16 July 2013). "Declining Sediments and Rising Seas: an Unfortunate Convergence for Tidal Wetlands". Estuaries and Coasts. 37 (1): 1–23. doi:10.1007/s12237-013-9654-8. S2CID 128615335.
- ^ Wong, Poh Poh; Losado, I.J.; Gattuso, J.-P.; Hinkel, Jochen (2014). "Coastal Systems and Low-Lying Areas" (PDF). Climate Change 2014: Impacts, Adaptation, and Vulnerability. New York: Cambridge University Press.
- ^ Smith, Lauren (2016-06-15). "Extinct: Bramble Cay melomys". Australian Geographic. Retrieved 2016-06-17.
- ^ Hannam, Peter (2019-02-19). "'Our little brown rat': first climate change-caused mammal extinction". The Sydney Morning Herald. Retrieved 2019-06-25.
- ^ a b Fletcher, Cameron (2013). "Costs and coasts: an empirical assessment of physical and institutional climate adaptation pathways". Apo.
- ^ a b "Climate Adaptation and Sea Level Rise". US EPA, Climate Change Adaptation Resource Center (ARC-X). 2 May 2016.
- ^ Sovacool, Benjamin K. (2011). "Hard and soft paths for climate change adaptation" (PDF). Climate Policy. 11 (4): 1177–1183. doi:10.1080/14693062.2011.579315. S2CID 153384574.
- ^ Kimmelman, Michael; Haner, Josh (2017-06-15). "The Dutch Have Solutions to Rising Seas. The World Is Watching". The New York Times. ISSN 0362-4331. Retrieved 2019-02-02.
- ^ "Dutch draw up drastic measures to defend coast against rising seas". The New York Times. 3 September 2008.
- ^ "Bangladesh Delta Plan 2100 | Dutch Water Sector". www.dutchwatersector.com (in Dutch). Retrieved 2020-12-11.
- ^ "Bangladesh Delta Plan (BDP) 2100" (PDF).
- ^ "Delta Plan falls behind targets at the onset". The Business Standard. September 5, 2020.
- ^ Bangladesh Delta Plan 2100 Formulation project
- ^ "Climate Change, Sea Level Rise Spurring Beach Erosion". Climate Central. 2012.
- ^ Carpenter, Adam T. (2020-05-04). "Public priorities on locally-driven sea level rise planning on the East Coast of the United States". PeerJ. 8: e9044. doi:10.7717/peerj.9044. ISSN 2167-8359. PMC 7204830. PMID 32411525.
- ^ Grecequet, Martina; Noble, Ian; Hellmann, Jessica (2017-11-16). "Many small island nations can adapt to climate change with global support". The Conversation. Retrieved 2019-02-02.
- ^ "Adaptation to Sea Level Rise". UN Environment. 2018-01-11. Retrieved 2019-02-02.
- ^ Englander, John (3 May 2019). "As seas rise, Indonesia is moving its capital city. Other cities should take note". The Washington Post. Retrieved 31 August 2019.
- ^ Abidin, Hasanuddin Z.; Andreas, Heri; Gumilar, Irwan; Fukuda, Yoichi; Pohan, Yusuf E.; Deguchi, T. (11 June 2011). "Land subsidence of Jakarta (Indonesia) and its relation with urban development". Natural Hazards. 59 (3): 1753–1771. doi:10.1007/s11069-011-9866-9. S2CID 129557182.
- ^ Englander, John (May 3, 2019). "As seas rise, Indonesia is moving its capital city. Other cities should take note". The Washington Post. Retrieved 5 May 2019.
- ^ Rosane, Olivia (May 3, 2019). "Indonesia Will Move its Capital from Fast-Sinking Jakarta". Ecowatch. Retrieved 5 May 2019.
- ^ Erkens, G.; Bucx, T.; Dam, R.; de Lange, G.; Lambert, J. (2015-11-12). "Sinking coastal cities". Proceedings of the International Association of Hydrological Sciences. 372: 189–198. Bibcode:2015PIAHS.372..189E. doi:10.5194/piahs-372-189-2015. ISSN 2199-899X.
Sources[]
- IPCC AR4 WG1 (2007), Solomon, S.; Qin, D.; Manning, M.; Chen, Z.; Marquis, M.; Averyt, K.B.; Tignor, M.; Miller, H.L. (eds.), Climate Change 2007: The Physical Science Basis, Contribution of Working Group I to the Fourth Assessment Report of the Intergovernmental Panel on Climate Change, Cambridge University Press, ISBN 978-0-521-88009-1 (pb: 978-0-521-70596-7).
- IPCC AR4 WG2 (2007), Parry, M.L.; Canziani, O.F.; Palutikof, J.P.; van der Linden, P.J.; Hanson, C.E. (eds.), Climate Change 2007: Impacts, Adaptation and Vulnerability, Contribution of Working Group II to the Fourth Assessment Report of the Intergovernmental Panel on Climate Change, Cambridge University Press, ISBN 978-0-521-88010-7 (pb: 978-0-521-70597-4).
- IPCC AR5 WG2 (2014), C.B.Field; V.R.Barros; D.J.Dokken; K.J.Mach; M.D. Mastrandrea (eds.), Climate Change 2014: Impacts, Adaptation and Vulnerability, Contribution of Working Group II to the Fifth Assessment Report of the Intergovernmental Panel on Climate Change, Cambridge University Press
- IPCC AR5 WG1 (2013), Stocker, T.F.; Qin, G.; Plattner, K.; Tignor, M.; Allen, S.K.; Boschung, J.; Nauels, A.; Xia, Y. (eds.), Climate Change 2013: The Physical Science Basis, Contribution of Working Group I to the Fifth Assessment Report of the Intergovernmental Panel on Climate Change, Cambridge University Press, ISBN 978-0-521-88009-1 (pb: 978-0-521-70596-7).
- IPCC AR6 WG1 (2021). Masson-Delmotte, V.; Zhai, P.; Pirani, A.; Connors, S. L.; et al. (eds.). Climate Change 2021: The Physical Science Basis (PDF). Contribution of Working Group I to the Sixth Assessment Report of the Intergovernmental Panel on Climate Change. Cambridge University Press (In Press).
- USGCRP (2017), Wuebbles, D.J.; Fahey, D.W.; Hibbard, K.A.; Dokken, D.J.; Stewart, B.C.; T.K., Maycock (eds.), Climate Science Special Report: Fourth National Climate Assessment, I
- Bucx, T.; Marchand, M.; Makaske, A.; van de Guchte, C. (December 2010), Comparative assessment of the vulnerability and resilience of 10 deltas: synthesis report, Delta Alliance report number 1, Delft-Wageningen, The Netherlands: Delta Alliance International, ISBN 978-94-90070-39-7
- Hanson, S.; Nicholls, R.; Ranger, N.; Hallegatte, S.; Corfee-Morlot, J.; Herweijer, C.; Chateau, J. (2011), "A global ranking of port cities with high exposure to climate extremes", Climatic Change, 104 (1): 89–111, Bibcode:2011ClCh..104...89H, doi:10.1007/s10584-010-9977-4, S2CID 14989431
- Tessler, Z. D.; Vörösmarty, C. J.; Grossberg, M.; Gladkova, I.; Aizenman, H.; Syvitski, J. P. M.; Foufoula-Georgiou, E. (2015), "Profiling risk and sustainability in coastal deltas of the world" (PDF), Science, 349 (6248): 638–43, Bibcode:2015Sci...349..638T, doi:10.1126/science.aab3574, PMID 26250684, S2CID 12295500
Further reading[]
- Pilkey, O.H.; Young, R (2009). The Rising Sea. Shearwater. ISBN 978-1-59726-191-3.
- "Why does sea level rise threaten marine ecosystems?". Marine Conservation Institute. Retrieved 2018-10-07.
- Horton, Benjamin P.; Khan, Nicole S.; Cahill, Niamh; Lee, Janice S. H.; Shaw, Timothy A.; Garner, Andra J.; Kemp, Andrew C.; Engelhart, Simon E.; Rahmstorf, Stefan (2020). "Estimating global mean sea-level rise and its uncertainties by 2100 and 2300 from an expert survey". NPJ Climate and Atmospheric Science. 3 (1). doi:10.1038/s41612-020-0121-5. ISSN 2397-3722.
- Maguire, Amy (25 December 2020). "Climate Change-related displacement of coastal and island peoples: human rights implications". In McDonald, Jan; McGee, Jeffrey; Barnes, Richard (eds.). Research Handbook on Climate Change, Oceans and Coasts. Edward Elgar Publishing. ISBN 9781788112239.
External links[]
| The Wikibook Historical Geology has a page on the topic of: Sea level variations |
- NASA Satellite Data 1993-present
- Fourth National Climate Assessment Sea Level Rise Key Message
- Incorporating Sea Level Change Scenarios at the Local Level Outlines eight steps a community can take to develop site-appropriate scenarios
- The Global Sea Level Observing System (GLOSS)
- USA Sea Level Rise Viewer (NOAA)
Physical oceanography | ||
|---|---|---|
| Waves |
|  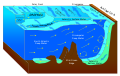 |
| Circulation |
| |
| Tides |
| |
| Landforms |
| |
| Plate tectonics |
| |
| Ocean zones |
| |
| Sea level |
| |
| Acoustics |
| |
| Satellites |
| |
| Related |
| |
| ||
Climate change | |||||||||||||
|---|---|---|---|---|---|---|---|---|---|---|---|---|---|
| |||||||||||||
| |||||||||||||
| |||||||||||||
| |||||||||||||
| |||||||||||||
| |||||||||||||
| |||||||||||||
Global catastrophic risks | |||||
|---|---|---|---|---|---|
| |||||
| Technological |
| ||||
| Sociological |
| ||||
| Ecological |
| ||||
| Biological |
| ||||
| Astronomical |
| ||||
| Eschatological |
| ||||
| Others |
| ||||
| Fictional |
| ||||
| Organizations |
| ||||
| |||||
- Oceanography
- Sea level
- Effects of climate change
- Coastal geography
- Climate change adaptation