Biomass
Biomass is plant or animal material used as fuel to produce electricity or heat. Examples are wood, energy crops and waste from forests, yards, or farms.[1] Since biomass technically can be used as a fuel directly (e.g. wood logs), some people use the terms biomass and biofuel interchangeably. More often than not, the word biomass simply denotes the biological raw material the fuel is made of. The word biofuel is usually reserved for liquid or gaseous fuels, used for transportation. The U.S. Energy Information Administration (EIA) follows this naming practice.[2]
The IPCC (Intergovernmental Panel on Climate Change) defines bioenergy as a renewable form of energy.[3] In 2017 the IEA (International Energy Agency) described bioenergy as the most important source of renewable energy.[a] IEA also argue that the current rate of bioenergy deployment is well below the levels required in low carbon scenarios, and that accelerated deployment is urgently needed.[b] Researchers have disputed that the use of forest biomass for energy is carbon neutral.[4][5]
Biomass feedstocks[]

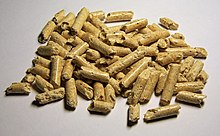
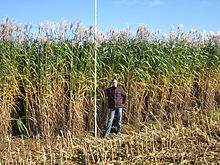
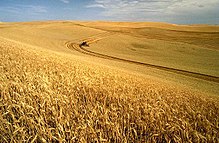
Wood and wood residues is the largest biomass energy source today. Wood can be used as a fuel directly or processed into pellet fuel or other forms of fuels. Other plants can also be used as fuel, for instance corn, switchgrass, miscanthus and bamboo.[6] The main waste energy feedstocks are wood waste, agricultural waste, municipal solid waste, manufacturing waste, and landfill gas. Sewage sludge is another source of biomass. There is ongoing research involving algae or algae-derived biomass.[7] Other biomass feedstocks are enzymes or bacteria from various sources, grown in cell cultures or hydroponics.[8]
Biomass is also used to produce fibers and industrial chemicals.
Based on the source of biomass, biofuels are classified broadly into three major categories:[9]
First-generation biofuels are derived from food sources, such as sugarcane and corn starch. Sugars present in this biomass are fermented to produce bioethanol, an alcohol fuel which serve as an additive to gasoline, or in a fuel cell to produce electricity.
Second-generation biofuels utilize non-food-based biomass sources such as perennial energy crops (low input crops), and agricultural/municipal waste. Proponents argue that there is huge potential for second generation biofuels. Third-generation biofuels refer to those derived from microalgae.
Biomass conversion[]

Upgrading raw biomass to higher grade fuels can be achieved by different methods, broadly classified as thermal, chemical, or biochemical.
Thermal conversions[]
Thermal conversion processes use heat as the dominant mechanism to upgrade biomass into a better and more practical fuel. The basic alternatives are torrefaction, pyrolysis, and gasification, these are separated principally by the extent to which the chemical reactions involved are allowed to proceed (mainly controlled by the availability of oxygen and conversion temperature).[10]
There are other less common, more experimental or proprietary thermal processes that may offer benefits, such as hydrothermal upgrading.[11] Some have been developed for use on high moisture content biomass, including aqueous slurries, and allow them to be converted into more convenient forms.
Chemical conversion[]
A range of chemical processes may be used to convert biomass into other forms, such as to produce a fuel that is more practical to store, transport and use, or to exploit some property of the process itself. Many of these processes are based in large part on similar coal-based processes, such as the Fischer-Tropsch synthesis.[12] Biomass can be converted into multiple commodity chemicals.[13]
Biochemical conversion[]
As biomass is a natural material, many highly efficient biochemical processes have developed in nature to break down the molecules of which biomass is composed, and many of these biochemical conversion processes can be harnessed. In most cases, microorganisms are used to perform the conversion process: anaerobic digestion, fermentation, and composting.[14]
Glycoside hydrolases are the enzymes involved in the degradation of the major fraction of biomass, such as polysaccharides present in starch and lignocellulose. Thermostable variants are gaining increasing roles as catalysts in biorefining applications, since recalcitrant biomass often needs thermal treatment for more efficient degradation.[15]
Electrochemical conversions[]
Biomass can be directly converted to electrical energy via electrochemical (electrocatalytic) oxidation of the material. This can be performed directly in a direct carbon fuel cell,[16] direct liquid fuel cells such as direct ethanol fuel cell, a direct methanol fuel cell, a direct formic acid fuel cell, a L-ascorbic Acid Fuel Cell (vitamin C fuel cell),[17] and a microbial fuel cell.[18] The fuel can also be consumed indirectly via a fuel cell system containing a reformer which converts the biomass into a mixture of CO and H2 before it is consumed in the fuel cell.[19]
Carbon neutrality for forest biomass[]

IEA defines carbon neutrality and carbon negativity like so: «Carbon neutrality, or 'net zero,' means that any CO2 released into the atmosphere from human activity is balanced by an equivalent amount being removed. Becoming carbon negative requires a company, sector or country to remove more CO2 from the atmosphere than it emits.»[21] The actual carbon intensity of biomass varies with production techniques and transportation lengths. According to the EU, typical greenhouse gas emissions savings when replacing fossil fuels with wood pellets from forest residues is 77% when the transport distance is between 0 and 500 km, also 77% when the transport distance is between 500 and 2500 km, 75% when the distance is between 2500 and 10 000 km, and 69% when the distance is above 10 000 km. When stemwood is used, the savings change only marginally, from between 70 and 77%. When wood industry residues are used, savings increase to between 79 and 87%.[c]
Likewise, Hanssen et al. argue that greenhouse gas emissions savings from wood pellets produced in the US southeast and shipped to the EU is between 65 and 75%, compared to fossil fuels.[d] They estimate that average net GHG emissions from wood pellets imported from the USA and burnt for electricity in the EU amounts to approximately 0.2 kg CO2 equivalents per kWh, while average emissions from the mix of fossil fuels that is currently burnt for electricity in the EU amounts to 0.67 kg CO2-eq per kWh (see chart on the right). Ocean transport emissions amounts to 7% of the fossil fuel mix emissions per produced kWh (equivalent to 93 kg CO2-eq/t vs 1288 kg CO2/t).[22]
IEA Bioenergy estimates that in a scenario where Canadian wood pellets are used to totally replace coal use in a European coal plant, the specific emissions originating from ocean transport of the pellets, going from Vancouver to Rotterdam, amounts to approximately 2% of the plant's total coal-related emissions.[23]
More CO2 from wood combustion than coal combustion[]
When combusted in combustion facilities with the same heat-to-electricity conversion efficiency, oven dry wood emits slightly less CO2 per unit of heat produced, compared to oven dry coal.[e] However, many biomass combustion facilities are relatively small and inefficient, compared to the typically much larger coal plants. Further, raw biomass can have higher moisture content compared to some common coal types. When this is the case, more of the wood’s inherent energy must be spent solely on evaporating moisture, compared to the drier coal, which means that the amount of CO2 emitted per unit of produced heat will be higher.

Some research groups (e.g. Chatham House) therefore argue that «[...] the use of woody biomass for energy will release higher levels of emissions than coal […].»[24]
How much «extra» CO2 that is released depends on local factors. Some research groups estimate relatively low extra emissions. IEA Bioenergy for instance estimates 10%.[25] The bioenergy consultant group FutureMetrics argue that wood pellets with 6% moisture content emits 22% less CO2 for the same amount of produced heat, compared to sub-bituminous coal with 15% moisture, when both fuels are combusted in facilities with the same conversion efficiency (here 37%).[f] Likewise, they state that «[…] dried wood at MC’s [moisture content] below 20% have the same or less CO2 emission per MMBTU [million British thermal units] as most coal. Wood pellets at under 10% MC result in less CO2 emission than any coal under otherwise equal circumstances.»[26] (Moisture content in wood pellets is usually below 10%, as defined in the ISO standard 17225-2:2014.)[27] However, when raw wood chips are used instead (45% moisture content), this wood biomass emits 9% more CO2 than coal in general, for the same amount of produced heat.[26] According to Indiana Center for Coal Technology Research, the coal type anthracite typically contains below 15% moisture, while bituminous contains 2–15%, sub-bituminous 10–45%, and lignite 30–60%.[28] The most common coal type in Europe is lignite.[29]
Other research groups estimate relatively high extra emissions. The Manomet Center for Conservation Sciences for instance, argue that for smaller scale utilities, with 32% conversion efficiency for coal, and 20-25% for biomass, coal emissions are 31% less than for wood chips. Assumed moisture content for wood chips is 45%, as above. The assumed moisture content for coal is not provided.[30]
The IPCC (Intergovernmental Panel on Climate Change) put their «extra CO2» estimates for biomass at roughly 16% extra for wood over coal in general, somewhere in the middle compared to the estimates above.[g] They argue that focusing on gross emissions misses the point, what counts is the net effect of emissions and absorption taken together: «Estimating gross emissions only, creates a distorted representation of human impacts on the land sector carbon cycle. While forest harvest for timber and fuelwood and land-use change (deforestation) contribute to gross emissions, to quantify impacts on the atmosphere, it is necessary to estimate net emissions, that is, the balance of gross emissions and gross removals of carbon from the atmosphere through forest regrowth […].»[31]

IEA Bioenergy provide a similar argument: «It is incorrect to determine the climate change effect of using biomass for energy by comparing GHG emissions at the point of combustion.»[25] They also argue that «[…] the misplaced focus on emissions at the point of combustion blurs the distinction between fossil and biogenic carbon, and it prevents proper evaluation of how displacement of fossil fuels with biomass affects the development of atmospheric GHG concentrations.»[32] IEA Bioenergy conclude that the additional CO2 from biomass «[…] is irrelevant if the biomass is derived from sustainably managed forests.»[25]
What is sustainable managed forests? The IPCC writes: «Sustainable Forest Management (SFM) is defined as ‘the stewardship and use of forests and forest lands in a way, and at a rate, that maintains their biodiversity, productivity, regeneration capacity, vitality and their potential to fulfill, now and in the future, relevant ecological, economic and social functions, at local, national, and global levels, and that does not cause damage to other ecosystems’ […]. This SFM definition was developed by the Ministerial Conference on the Protection of Forests in Europe and has since been adopted by the Food and Agriculture Organization [of the United Nations (FAO)].»[33] Further, IPCC writes: «Sustainable forest management can prevent deforestation, maintain and enhance carbon sinks and can contribute towards GHG emissions-reduction goals. Sustainable forest management generates socio-economic benefits, and provides fibre, timber and biomass to meet society’s growing needs.»[34]
In the context of CO2 mitigation, the key measure regarding sustainability is the size of the forest carbon stock. In a research paper for FAO, Reid Miner writes: «The core objective of all sustainable management programmes in production forests is to achieve a long-term balance between harvesting and regrowth. […] [T]he practical effect of maintaining a balance between harvesting and regrowth is to keep long-term carbon stocks stable in managed forests.»[35]
Globally, the forest carbon stock has decreased 0.9% and tree cover 4.2% between 1990 and 2020, according to FAO.[36] IPCC states that there is disagreement about whether the global forest is shrinking or not, and quote research indicating that tree cover has increased 7.1% between 1982 and 2016.[h] IPCC writes: «While above-ground biomass carbon stocks are estimated to be declining in the tropics, they are increasing globally due to increasing stocks in temperate and boreal forests […].»[37]
Forest protection[]
Some research groups seem to want more than «just» sustainably managed forests, they want to realize the forests full carbon storage potential. For instance EASAC writes: «There is a real danger that present policy over-emphasises the use of forests in energy production instead of increasing forest stocks for carbon storage.»[38] Further, they argue that «[…] it is the older, longer-rotation forests and protected old-growth forests that exhibit the highest carbon stocks.»[39] Chatham House argues that old trees have a very high carbon absorption, and that felling old trees means that this large potential for future carbon absorption is lost. In addition they argue that there is a loss of soil carbon due to the harvest operations.[40]
Research show that old trees absorb more CO2 than young trees, because of the larger leaf area in full grown trees.[41] However, the old forest (as a whole) will eventually stop absorbing CO2 because CO2 emissions from dead trees cancel out the remaining living trees’ CO2 absorption.[i] The old forest (or forest stands) are also vulnerable for natural disturbances that produces CO2. The IPCC writes: «When vegetation matures or when vegetation and soil carbon reservoirs reach saturation, the annual removal of CO2 from the atmosphere declines towards zero, while carbon stocks can be maintained (high confidence). However, accumulated carbon in vegetation and soils is at risk from future loss (or sink reversal) triggered by disturbances such as flood, drought, fire, or pest outbreaks, or future poor management (high confidence).»[42] Summing up, IPCC writes that «[…] landscapes with older forests have accumulated more carbon but their sink strength is diminishing, while landscapes with younger forests contain less carbon but they are removing CO2 from the atmosphere at a much higher rate [...].»[43] Regarding soil carbon, the IPCC writes: «Recent studies indicate, that effects of forest management actions on soil C [carbon] stocks can be difficult to quantify and reported effects have been variable and even contradictory (see Box 4.3a).» Because the «current scientific basis is not sufficient», the IPCC will not currently provide soil carbon emission factors for forest management.[44]
Regarding the net climate effect of conversion from natural to managed forests, the IPCC argues that it can swing both ways: «SFM [sustainable forest management] applied at the landscape scale to existing unmanaged forests can first reduce average forest carbon stocks and subsequently increase the rate at which CO2 is removed from the atmosphere, because net ecosystem production of forest stands is highest in intermediate stand ages (Kurz et al. 2013; Volkova et al. 2018; Tang et al. 2014). The net impact on the atmosphere depends on the magnitude of the reduction in carbon stocks, the fate of the harvested biomass (i.e. use in short – or long-lived products and for bioenergy, and therefore displacement of emissions associated with GHG-intensive building materials and fossil fuels), and the rate of regrowth. Thus, the impacts of SFM on one indicator (e.g., past reduction in carbon stocks in the forested landscape) can be negative, while those on another indicator (e.g., current forest productivity and rate of CO2 removal from the atmosphere, avoided fossil fuel emissions) can be positive. Sustainably managed forest landscapes can have a lower biomass carbon density than unmanaged forest, but the younger forests can have a higher growth rate, and therefore contribute stronger carbon sinks than older forests (Trofymow et al. 2008; Volkova et al. 2018; Poorter et al. 2016).»[33]
In other words, there is a tradeoff between the benefits of having a maximized forest carbon stock, not absorbing any more carbon, and the benefits of having a portion of that carbon stock «unlocked», and instead working as a renewable fossil fuel replacement tool. When put to work, this carbon is constantly replacing carbon in fossil fuels used in for instance heat production and baseload electricity production – sectors where it is un-economical or impossible to use intermittent power sources like wind or solar. Being a renewable carbon source, the unlocked portion keep cycling back and forth between forests and forest products like lumber and wood pellets. For each cycle it replaces more and more of the fossil based alternatives, e.g. cement and coal.
FAO researcher Reid Miner argues that the «competition» between locked-away and unlocked forest carbon is won by the unlocked carbon: «In the long term, using sustainably produced forest biomass as a substitute for carbon-intensive products and fossil fuels provides greater permanent reductions in atmospheric CO2 than preservation does.»[45]
Summing up the above, IEA Bioenergy writes: «As the IPCC has pointed out in several reports, forests managed for producing sawn timber, bioenergy and other wood products can make a greater contribution to climate change mitigation than forests managed for conservation alone, for three reasons. First, the sink strength diminishes as conservation forests approach maturity. Second, wood products displace GHG-intensive materials and fossil fuels. Third, carbon in forests is vulnerable to loss through natural events such as insect infestations or wildfires, as recently seen in many parts of the world including Australia and California. Managing forests can help to increase the total amount of carbon sequestered in the forest and wood products carbon pools, reduce the risk of loss of sequestered carbon, and reduce fossil fuel use.»[46]
The IPCC further suggest that the possibility to make a living out of forestry incentivize sustainable forestry practices: «[…] SFM [sustainable forest management] aimed at providing timber, fibre, biomass and non-timber resources can provide long-term livelihood for communities, reduce the risk of forest conversion to non-forest uses (settlement, crops, etc.), and maintain land productivity, thus reducing the risks of land degradation […].»[43] Further: «By providing long-term livelihoods for communities, sustainable forest management can reduce the extent of forest conversion to non-forest uses (e.g., cropland or settlements) (high confidence).»[47]
The National Association of University Forest Resources Programs agrees: «Research demonstrates that demand for wood helps keep land in forest and incentivizes investments in new and more productive forests, all of which have significant carbon benefits. […] Failing to consider the effects of markets and investment on carbon impacts can distort the characterization of carbon impacts from forest biomass energy.»[48]
Favero et al. focus on the potential future increase in demand and argues: «Increased bioenergy demand increases forest carbon stocks thanks to afforestation activities and more intensive management relative to a no-bioenergy case […] higher biomass demand will increase the value of timberland, incentivize additional investment in forest management and afforestation, and result in greater forest carbon stocks over time».[49]
Possibly strengthening the arguments above, data from FAO show that most wood pellets are produced in regions dominated by sustainably managed forests. Europe (including Russia) produced 54% of the world’s wood pellets in 2019, and the forest carbon stock in this area increased from 158.7 to 172.4 Gt between 1990 and 2020. Likewise, North America produced 29% of the worlds pellets in 2019, while forest carbon stock increased from 136.6 to 140 Gt in the same period. Carbon stock decreased from 94.3 to 80.9 Gt in Africa, 45.8 to 41.5 Gt in South and Southeast Asia combined, 33.4 to 33.1 Gt in Oceania,[j] 5 to 4.1 Gt in Central America, and from 161.8 to 144.8 Gt in South America. Wood pellet production in these areas combined was 13.2% in 2019.[k] Chatham House respond to the above argument like so: «Forest carbon stock levels may stay the same or increase for reasons entirely unconnected with use for energy.»[50]
Carbon payback time[]
Some research groups still argue that even if the European and North American forest carbon stock is increasing, it simply takes too long for harvested trees to grow back. EASAC for instance argues that since the world is on track to pass by the agreed target of 1.5 degrees temperature increase already in a decade or so, CO2 from burnt roundwood, which resides in the atmosphere for many decades before being re-absorbed, make it harder to achieve this goal. They therefore suggest that the EU should adjust its sustainability criteria so that only renewable energy with carbon payback times of less than 10 years is defined as sustainable,[l] for instance wind, solar, biomass from wood residues and tree thinnings that would otherwise be burnt or decompose relatively fast, and biomass from short rotation coppicing (SRC).[51] Chatham House agrees, and in addition argues that there could be tipping points along the temperature scale where warming accelerates.[m] Chatham House also argues that various types of roundwood (mostly pulpwood) is used in pellet production in the USA.[52]
FutureMetrics argues that it makes no sense for foresters to sell sawlog-quality roundwood to pellet mills, since they get a lot more money for this part of the tree from sawmills. Foresters make 80-90% of their income from sawlog-quality roundwood (the lower and thicker straight part of the tree stem), and only 10-15% from pulpwood, defined as a.) the middle part of mature trees (the thinner part of the stem that often bends a little, plus branches) and b.) tree thinnings (small, young trees cleared away for increased productivity of the whole forest stand.) This low-value biomass is mainly sold to pulp mills for paper production, but in some cases also to pellet mills for pellet production.[53] Pellets are typically made from sawmill residues in areas where there are sawmills, and from pulpwood in areas without sawmills.[n]
Chatham House further argue that almost all available sawmill residue is already being utilized for pellet production, so there is no room for expansion. For the bioenergy sector to significantly expand in the future, more of the harvested pulpwood must go to pellet mills. However, the harvest of pulpwood (tree thinnings) removes the possibility for these trees to grow old and therefore maximize their carbon holding capacity.[54] Compared to pulpwood, sawmill residues have lower net emissions: «Some types of biomass feedstock can be carbon-neutral, at least over a period of a few years, including in particular sawmill residues. These are wastes from other forest operations that imply no additional harvesting, and if otherwise burnt as waste or left to rot would release carbon to the atmosphere in any case.»[55]
An important presupposition for the «tree regrowth is too slow» argument is the view that carbon accounting should start when trees from particular, harvested forest stands are combusted, and not when the trees in those stands start to grow.[o] It is within this frame of thought it becomes possible to argue that the combustion event creates a carbon debt that has to be repaid through regrowth of the harvested stands.[p]
When instead assuming that carbon accounting should start when the trees start to grow, it becomes impossible to argue that the emitted carbon constitutes debt.[q] FutureMetrics for instance argue that the harvested carbon is not a debt but «[…] a benefit that was earned by 30 years of management and growth […].»[56] Other researchers however argue back that «[…] what is important to climate policy is understanding the difference in future atmospheric GHG levels, with and without switching to woody biomass energy. Prior growth of the forest is irrelevant to the policy question […].»[57]
Some researchers limit their carbon accounting to particular forest stands, ignoring the carbon absorption that takes place in the rest of the forest.[r] In opposition to this single forest stand accounting practice, other researchers include the whole forest when doing their carbon accounting. FutureMetrics for instance argue that the whole forest continually absorb CO2 and therefore immediately compensate for the relatively small amounts of biomass that is combusted in biomass plants from day to day.[s] Likewise, IEA Bioenergy criticizes EASAC for ignoring the carbon absorption of forests as a whole, noting that there is no net loss of carbon if annual harvest do not exceed the forest’s annual growth.[t]
IPCC argue along similar lines: «While individual stands in a forest may be either sources or sinks, the forest carbon balance is determined by the sum of the net balance of all stands.»[59] IPCC also state that the only universally applicable approach to carbon accounting is the one that accounts for both carbon emissions and carbon removals (absorption) for the whole landscape (see below). When the total is calculated, natural disturbances like fires and insect infestations are subtracted, and what remains is the human influence.[u] In this way, the whole landscape works as a proxy for calculating specifically human GHG emissions: «In the AFOLU [Agriculture, Forestry and Other Land Use] sector, the management of land is used as the best approximation of human influence and thus, estimates of emissions and removals on managed land are used as a proxy for anthropogenic emissions and removals on the basis that the preponderance of anthropogenic effects occurs on managed lands (see Vol. 4 Chapter 1). This allows for consistency, comparability, and transparency in estimation. Referred to as the Managed Land Proxy (MLP), this approach is currently recognised by the IPCC as the only universally applicable approach to estimating anthropogenic emissions and removals in the AFOLU sector (IPCC 2006, IPCC 2010).»[60]
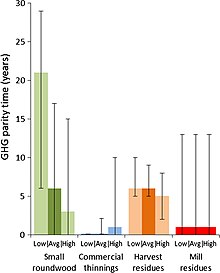
Hanssen et al. notes that when comparing continued wood pellet production to a potential policy change where the forest instead is protected, most researchers estimate a 20–50 year carbon parity (payback) time range for the burnt wood pellets. But when instead comparing continued pellet production to the more realistic alternative scenarios of 1.) instead using all harvested biomass to produce paper, pulp or wood panels, 2.) quitting the thinning practice altogether (leaving the small trees alone, realizing more of their growth potential but at the same time reduce the growth potential of the bigger trees), and 3.) leaving the forest residue alone, so it is decomposed in the forest over time, rather than being burned almost immediately in power plants, the result is that carbon payback (parity) times for wood pellets drop to 0-21 years in all demand scenarios (see chart on the right). The estimate is based on the landscape rather than the individual forest stand carbon accounting practice.[61]
Short-term vs long-term climate benefits[]
Researchers from both sides agree that in the short term, emissions might rise compared to a no-bioenergy scenario. IPCC for instance states that forest carbon emission avoidance strategies always give a short-term mitigation benefit, but argue that the long-term benefits from sustainable forestry activities are larger:[59]
Relative to a baseline, the largest short-term gains are always achieved through mitigation activities aimed at emission avoidance […]. But once an emission has been avoided, carbon stocks on that forest will merely be maintained or increased slightly. […] In the long term, sustainable forest management strategy aimed at maintaining or increasing forest carbon stocks, while producing an annual yield of timber, fibre, or energy from the forest, will generate the largest sustained mitigation benefit.
— IPCC 2007
Similarly, addressing the issue of climate consequences for modern bioenergy in general, IPCC states: «Life-cycle GHG emissions of modern bioenergy alternatives are usually lower than those for fossil fuels […].»[62] Consequently, most of IPCC’s GHG mitigation pathways include substantial deployment of bioenergy technologies.[63] Limited or no bioenergy pathways leads to increased climate change or shifting bioenergy’s mitigation load to other sectors.[v] In addition, mitigation cost increases.[w]
IEA Bioenergy also prioritize the long-term benefits: «Concern about near-term emissions is not a strong argument for stopping investments that contribute to net emissions reduction beyond 2030, be it the scaling-up of battery manufacturing to support electrification of car fleets, the development of rail infrastructure, or the development of biomass supply systems and innovation to provide biobased products displacing fossil fuels, cement and other GHG-intensive products. We assert that it is critical to focus on the global emissions trajectory required to achieve climate stabilization, acknowledging possible trade-offs between short- and long-term emissions reduction objectives. A strong focus on short-term carbon balances may result in decisions that make long-term climate objectives more difficult to meet.»[32] IEA states that «[…] the current rate of bioenergy deployment is well below the levels required in low carbon scenarios. Accelerated deployment is urgently needed to ramp up the contribution of sustainable bioenergy across all sectors […].»[64] They recommend a five-fold increase in sustainable bioenergy feedstock supply.[x]
The National Association of University Forest Resources Programs agrees, and argues that a timeframe of 100 years is recommended in order to produce a realistic assessment of cumulative emissions: «Comparisons between forest biomass emissions and fossil fuel emissions at the time of combustion and for short periods thereafter do not account for long term carbon accumulation in the atmosphere and can significantly distort or ignore comparative carbon impacts over time. […] The most common timeframe for measuring the impacts of greenhouse gases is 100 years, as illustrated by the widespread use of 100-year global warming potentials. This timeframe provides a more accurate accounting of cumulative emissions than shorter intervals.»[65]
Carbon neutrality for energy crops[]
Like with forests, it is the total amount of CO2 equivalent emissions and absorption together that determines if an energy crop project is carbon positive, carbon neutral or carbon negative. If emissions during agriculture, processing, transport and combustion are higher than what is absorbed, both above and below ground during crop growth, the project is carbon positive. Likewise, if total absorption over time is higher than total emissions, the project is carbon negative.
Many first generation biomass projects are carbon positive (have a positive GHG life cycle cost), especially if emissions caused by direct or indirect land use change are included in the GHG cost calculation. The IPCC state that indirect land use change effects are highly uncertain, though.[y] Some projects have higher total GHG emissions than some fossil based alternatives.[z][aa][ab] Transport fuels might be worse than solid fuels in this regard.[ac]
During plant growth, ranging from a few months to decades, CO2 is re-absorbed by new plants.[66] While regular forest stands have carbon rotation times spanning many decades, short rotation forestry (SRF) stands have a rotation time of 8–20 years, and short rotation coppicing (SRC) stands 2–4 years.[67] Perennial grasses like miscanthus or napier grass have a rotation time of 4–12 months. In addition to absorbing CO2 and storing it as carbon in its above-ground tissue, biomass crops also sequester carbon below ground, in roots and soil.[ad] Typically, perennial crops sequester more carbon than annual crops because the root buildup is allowed to continue undisturbed over many years. Also, perennial crops avoid the yearly tillage procedures (plowing, digging) associated with growing annual crops. Tilling helps the soil microbe populations to decompose the available carbon, producing CO2.[ae][af]
Soil organic carbon has been observed to be greater below switchgrass crops than under cultivated cropland, especially at depths below 30 cm (12 in).[68] A meta-study of 138 individual studies, done by Harris et al., revealed that second generation perennial grasses (miscanthus and switchgrass) planted on arable land on average store five times more carbon in the ground than short rotation coppice or short rotation forestry plantations (poplar and willow).[ag]
McCalmont et al. compared a number of individual European reports on Miscanthus x giganteus carbon sequestration, and found accumulation rates ranging from 0.42 to 3.8 tonnes per hectare per year,[ah] with a mean accumulation rate of 1.84 tonne (0.74 tonnes per acre per year),[ai] or 25% of total harvested carbon per year.[aj] When used as fuel, greenhouse gas (GHG) savings are large—even without considering the GHG effect of carbon sequestration, miscanthus fuel has a GHG cost of 0.4–1.6 grams CO2-equivalents per megajoule, compared to 33 grams for coal, 22 for liquefied natural gas, 16 for North Sea gas, and 4 for wood chips imported to Britain from the USA.[ak]

Likewise, Whitaker et al. argue that a miscanthus crop with a yield of 10 tonnes per hectare per year sequesters enough carbon below ground that the crop more than compensates for both agriculture, processing and transport emissions. The chart on the right displays two CO2 negative miscanthus production pathways, and two CO2 positive poplar production pathways, represented in gram CO2-equivalents per megajoule. The bars are sequential and move up and down as atmospheric CO2 is estimated to increase and decrease. The grey/blue bars represent agriculture, processing and transport related emissions, the green bars represents soil carbon change, and the yellow diamonds represent total final emissions.[al]

Successful sequestration is dependent on planting sites, as the best soils for sequestration are those that are currently low in carbon. The varied results displayed in the graph highlights this fact.[am] For the UK, successful sequestration is expected for arable land over most of England and Wales, with unsuccessful sequestration expected in parts of Scotland, due to already carbon rich soils (existing woodland) plus lower yields. Soils already rich in carbon includes peatland and mature forest.
Milner et al. further argue that the most successful carbon sequestration in the UK takes place below improved grassland.[an] However, Harris et al. notes that since the carbon content of grasslands vary considerably, so does the success rate of land use changes from grasslands to perennial.[ao] The bottom graphic displays the estimated yield necessary to achieve CO2 negativity for different levels of existing soil carbon saturation. The higher the yield, the more likely CO2 negativity becomes.
Environmental impact[]
Biodiversity and pollution[]
Gasparatos et al. reviews current research about the side effects of all kinds of renewable energy production, and argue that in general there is a conflict between "[...] site/local-specific conservation goals and national energy policy/climate change mitigation priorities [...]." The authors argue that for instance biodiversity should be seen as an equally "[...] legitimate goal of the Green Economy as curbing GHG emissions."[69] Oil palm and sugar cane are examples of crops that have been linked to reduced biodiversity.[70] Other problems are pollution of soil and water from fertiliser/pesticide use,[71] and emission of ambient air pollutants, mainly from open field burning of residues.[72]
The authors note that the extent of the environmental impact "[...] varies considerably between different biomass energy options."[70] For impact mitigation, they recommend "[...] adopting environmentally-friendly bioenergy production practices, for instance limiting the expansion of monoculture plantations, adopting wildlife-friendly production practices, installing pollution control mechanisms, and undertaking continuous landscape monitoring."[73] They also recommend "[...] multi-functional bioenergy landscapes."[73] Other measures include "[...] careful feedstock selection, as different feedstocks can have radically different environmental trade-offs. For example, US studies have demonstrated that 2nd generation feedstocks grown in unfertilized land could provide benefits to biodiversity when compared to monocultural annual crops such as maize and soy that make extensive use of agrochemicals."[73] Miscanthus and switchgrass are examples of such crops.[74]
Air quality[]
The traditional use of wood in cook stoves and open fires produces pollutants, which can lead to severe health and environmental consequences. However, a shift to modern bioenergy contribute to improved livelihoods and can reduce land degradation and impacts on ecosystem services.[ap] According to the IPCC, there is strong evidence that modern bioenergy have «large positive impacts» on air quality.[75] When combusted in industrial facilities, most of the pollutants originating from woody biomass reduce by 97-99%, compared to open burning.[76] A study of the giant brown haze that periodically covers large areas in South Asia determined that two thirds of it had been principally produced by residential cooking and agricultural burning, and one third by fossil-fuel burning.[77]
Consequences of low surface power production density[]
While bioenergy is generally agreed to have a net reducing impact on greenhouse gas emissions on the global scale, increasing biomass demand can create significant social and environmental pressure in locations where the biomass is produced.[78][79]
The impact is primarily related to the low surface power density of biomass (see below). The low surface power density has the effect that much larger land areas are needed in order to produce the same amount of energy, compared to for instance fossil fuels. In some cases, large areas of natural forests have been logged illegally (e.g. in Romania[80] and Siberia[81]), and the remaining forest has been put on fire to cover up illegal operations.[82]
Plans to remove encroaching bushes and trees on over 30 million hectares in Namibia, with most of the biomass contracted for German power plants, have caused protests from environmental organizations. The organizations argue that the trees and bushes store carbon, and that burning them releases more CO2 upfront than burning coal.[83] Namibian researchers argue that bush encroaching causes lower income for farmers, lower biodiversity, lower groundwater level and displacement of wildlife.[84] Protests against forest exports for biomass also happened in Sweden[85] and Canada.[86] In Mississippi a company producing wood pellets for UK power plants was fined $2.5m for exceeding volatile organic compounds pollution for a number of years.[87] Long-distance transport of biomass have been criticised as wasteful and unsustainable.[88]
Biomass surface power production densities compared to other renewables[]
To calculate land use requirements for different kinds of power production, it is essential to know the relevant surface power production densities. Vaclav Smil estimates that the average lifecycle surface power densities for biomass, wind, hydro and solar power production are 0.30 W/m2, 1 W/m2, 3 W/m2 and 5 W/m2, respectively (power in the form of heat for biomass, and electricity for wind, hydro and solar).[89] Lifecycle surface power density includes land used by all supporting infrastructure, manufacturing, mining/harvesting and decommissioning. Van Zalk et al. estimates 0.08 W/m2 for biomass, 0.14 W/m2 for hydro, 1.84 W/m2 for wind, and 6.63 W/m2 for solar (median values, with none of the renewable sources exceeding 10 W/m2). Fossil gas has the highest surface density at 482 W/m2 while nuclear power at 240 W/m2 is the only high-density and low-carbon energy source.[90] The average human power consumption on ice-free land is 0.125 W/m2 (heat and electricity combined),[91] although rising to 20 W/m2 in urban and industrial areas.[92]
Plants with low yields have lower surface power density compared to plants with high yields. Additionally, when the plants are only partially utilized, surface density drops even lower. This is the case when producing liquid fuels. For instance, ethanol is often made from sugarcane's sugar content or corn's starch content, while biodiesel is often made from rapeseed and soybean's oil content.
Smil estimates the following densities for liquid fuels:
Ethanol
- Winter wheat (USA) 0.08 W/m2 [93]
- Corn 0.26 W/m2 (yield 10 t/ha) [94]
- Wheat (Germany) 0.30 W/m2 [93]
- Miscanthus x giganteus 0.40 W/m2 (yield 15 t/ha) [95]
- Sugarcane 0.50 W/m2 (yield 80 t/ha wet) [96]
Jet fuel
Biodiesel
- Rapeseed 0.12 W/m2 (EU average)[97]
- Rapeseed (adjusted for energy input, the Netherlands) 0.08 W/m2 [98]
- Sugar beets (adjusted for energy input, Spain) 0.02 W/m2 [98]

Combusting solid biomass is more energy efficient than combusting liquids, as the whole plant is utilized. For instance, corn plantations producing solid biomass for combustion generate more than double the amount of power per square metre compared to corn plantations producing for ethanol, when the yield is the same: 10 t/ha generates 0.60 W/m2 and 0.26 W/m2 respectively.[99]
Oven dry biomass in general, including wood, miscanthus[100] and napier[101] grass, have a calorific content of roughly 18 GJ/t.[102] When calculating power production per square metre, every t/ha of dry biomass yield increases a plantation's power production by 0.06 W/m2.[aq] Consequently, Smil estimates the following:
- Large-scale plantations with pines, acacias, poplars and willows in temperate regions 0.30–0.90 W/m2 (yield 5–15 t/ha)[103]
- Large scale plantations with eucalyptus, acacia, leucaena, pinus and dalbergia in tropical and subtropical regions 1.20–1.50 W/m2 (yield 20–25 t/ha) [103]
In Brazil, the average yield for eucalyptus is 21 t/ha (1.26 W/m2), but in Africa, India and Southeast Asia, typical eucalyptus yields are below 10 t/ha (0.6 W/m2).[104]
FAO (Food and Agriculture Organization of the United Nations) estimate that forest plantation yields range from 1 to 25 m3 per hectare per year globally, equivalent to 0.02–0.7 W/m2 (0.4–12.2 t/ha):[ar]
- Pine (Russia) 0.02–0.1 W/m2 (0.4–2 t/ha or 1–5 m3)[ar]
- Eucalyptus (Argentina, Brazil, Chile and Uruguay) 0.5–0.7 W/m2 (7.8–12.2 t/ha or 25 m3)[ar]
- Poplar (France, Italy) 0.2–0.5 W/m2 (2.7–8.4 t/ha or 25 m3)[ar]
Smil estimate that natural temperate mixed forests yield on average 1.5–2 dry tonnes per hectare (2–2,5 m3, equivalent to 0.1 W/m2), ranging from 0.9 m3 in Greece to 6 m3 in France).[105] IPCC provides average net annual biomass growth data for natural forests globally. Net growth varies between 0.1 and 9.3 dry tonnes per hectare per year, with most natural forests producing between 1 and 4 tonnes, and with the global average at 2.3 tonnes. Average net growth for plantation forests varies between 0.4 and 25 tonnes, with most plantations producing between 5 and 15 tonnes, and with the global average at 9.1 tonnes.[106]
As mentioned above, Smil estimates that the world average for wind, hydro and solar power production is 1 W/m2, 3 W/m2 and 5 W/m2 respectively. In order to match these surface power densities, plantation yields must reach 17 t/ha, 50 t/ha and 83 t/ha for wind, hydro and solar respectively. This seems achievable for the tropical plantations mentioned above (yield 20–25 t/ha) and for elephant grasses, e.g. miscanthus (10–40 t/ha), and napier (15–80 t/ha), but unlikely for forest and many other types of biomass crops. To match the world average for biofuels (0.3 W/m2), plantations need to produce 5 tonnes of dry mass per hectare per year. When instead using the Van Zalk estimates for hydro, wind and solar (0.14, 1.84, and 6.63 W/m2 respectively), plantation yields must reach 2 t/ha, 31 t/ha and 111 t/ha in order to compete. Only the first two of those yields seem achievable, however.
Yields need to be adjusted to compensate for the amount of moisture in the biomass (evaporating moisture in order to reach the ignition point is usually wasted energy). The moisture of biomass straw or bales varies with the surrounding air humidity and eventual pre-drying measures, while pellets have a standardized (ISO-defined) moisture content of below 10% (wood pellets)[as] and below 15% (other pellets).[at] Likewise, for wind, hydro and solar, power line transmission losses amounts to roughly 8% globally and should be accounted for.[au] If biomass is to be utilized for electricity production rather than heat production, note that yields has to be roughly tripled in order to compete with wind, hydro and solar, as the current heat to electricity conversion efficiency is only 30–40%.[107] When simply comparing surface power density without regard for cost, this low heat to electricity conversion efficiency effectively pushes at least solar parks out of reach of even the highest yielding biomass plantations, surface power density wise.[av]
Worldwide production[]
| # | Country | 2020 |
|---|---|---|
| 1 | 17 784 | |
| 2 | 15 228 | |
| 3 | 10 518 | |
| 4 | 9 916 | |
| 5 | 5 393 | |
| 6 | 4 402 | |
| 7 | 3 835 | |
| 8 | 2 674 | |
| 9 | 2 481 | |
| 10 | 2 360 | |
| 11 | 1 990 | |
| 12 | 1 775 | |
| 13 | 1 470 | |
| 14 | 1 370 | |
| 15 | 1 339 | |
| 16 | 1 174 | |
| 17 | 1 085 | |
| 18 | 1 029 | |
| 19 | 951 | |
| 20 | 855 | |
| 21 | 822 | |
| 22 | 811 | |
| 23 | 798 | |
| 24 | 797 | |
| 25 | 678 | |
| 26 | 646 | |
| 27 | 624 | |
| 28 | 591 | |
| 29 | 533 | |
| 30 | 472 | |
| 31 | 423 | |
| 32 | 423 | |
| 33 | 410 | |
| 34 | 397 | |
| 35 | 393 | |
| 36 | 378 | |
| 37 | 339 | |
| 38 | 316 |
See also[]
| Part of a series on |
| Renewable energy |
|---|
|
|
- Biochar
- Biofact (biology)
- Biomass (ecology)
- Gasification
- Biomass heating system
- Biomass to liquid
- Bioproducts
- Biorefinery
- European Biomass Association
- Carbon footprint
- Cow dung
- Energy forestry
- Firewood
- Microgeneration
- Microbial electrolysis cell generates hydrogen or methane
- Permaculture
- Thermal mass
- Woodchips
- Renewable Energy Transition
Notes[]
- ^ "The recent discussions on renewable energy are mostly focused on the rapid growth of wind and solar deployment and their impressive drop in cost. While these developments are remarkable, they also overshadow what remains the most important source of renewable energy today – bioenergy." IEA 2017a.
- ^ "Bioenergy is the main source of renewable energy today. IEA modelling also indicates that modern bioenergy is an essential component of the future low carbon global energy system if global climate change commitments are to be met, playing a particularly important role in helping to decarbonise sectors such as aviation, shipping and long haul road transport. However, the current rate of bioenergy deployment is well below the levels required in low carbon scenarios. Accelerated deployment is urgently needed to ramp up the contribution of sustainable bioenergy across all sectors, notably in the transport sector where consumption is required to triple by 2030." IEA 2017b.
- ^ The estimates are for the "medium case" considered (case 2a); a pellet mill that uses wood for processing heat, but sources electricity from the grid. Estimates (for forest residue based pellets) reduce to 50–58% when fossil fuels is used for processing heat (case 1), but increase to 84-92% when electricity is sourced from a CHP biomass power plant (case 3a). See EUR-Lex 2018, p. Annex VI.
- ^ "[...] GHG emission reductions of wood-pellet electricity compared to fossil EU grid electricity are 71% (for small roundwood and harvest residues), 69% (for commercial thinnings) or 65% (for mill residues), as shown in more detail in Fig. S3. The GHG reduction percentage of wood-pellet electricity from mill residues was [...] 75% [...]." Hanssen et al. 2017, pp. 1415-1416.
- ^ See EPA 2020, p. 1. The emission factors are based on the higher heating value (HHV) of the different fuels. The HHV value reflects the actual chemical energy stored in the fuel, without taking moisture content into consideration. The fuel’s lower heating value (LHV) is the energy that remains after the necessary amount of energy has been spent to vaporize the fuel’s moisture (so that the fuel is able to reach the ignition point).
- ^ See FutureMetrics 2015a, p. 1-2. Chatham House notes that modern CHP plants (Combined Heat and Power) achieve much higher efficiencies, above 80%, for both fossil fuels and biomass. Chatham House 2017, p. 16.
- ^ The individual emission rates are: Wood 112 000 kg CO2eq per TJ, anthracite 98 300, coking coal 94 600, other bituminous 94 600, sub-bituminous 96 100, lignite 101 000. IPCC 2006a, p. 2.16–2.17.
- ^ «The trends of productivity shown by several remote-sensing studies (see previous section) are largely consistent with mapping of forest cover and change using a 34-year time series of coarse resolution satellite data (NOAA AVHRR) (Song et al. 2018). This study, based on a thematic classification of satellite data, suggests that (i) global tree canopy cover increased by 2.24 million km² between 1982 and 2016 (corresponding to +7.1%) but with regional differences that contribute a net loss in the tropics and a net gain at higher latitudes, and (ii) the fraction of bare ground decreased by 1.16 million km² (corresponding to –3.1%), mainly in agricultural regions of Asia (Song et al. 2018), see Figure 4.5. Other tree or land cover datasets show opposite global net trends (Li et al. 2018b), but high agreement in terms of net losses in the tropics and large net gains in the temperate and boreal zones (Li et al. 2018b; Song et al. 2018; Hansen et al. 2013).» IPCC 2019a, p. 367.
- ^ Stephenson et al. continue: «Second, our findings are similarly compatible with the well-known age-related decline in productivity at the scale of even-aged forest stands. […] We highlight the fact that increasing individual tree growth rate does not automatically result in increasing stand productivity because tree mortality can drive orders-of-magnitude reductions in population density. That is, even though the large trees in older, even-aged stands may be growing more rapidly, such stands have fewer trees. Tree population dynamics, especially mortality, can thus be a significant contributor to declining productivity at the scale of the forest stand. Stephenson et al. 2014, p. 92.
- ^ According to FAO, tree cover in Australia is increasing, but carbon stock is only provided for Oceania as a whole. FAO 2020, p. 136.
- ^ Wood chips, mainly used in the paper industry, have similar data; Europe (including Russia) produced 33% and North America 22%, while forest carbon stock increased in both areas. West, Central and East Asia combined produced 18%, and the forest carbon stock in this areas increased from 31.3 to 43.3 Gt. Wood chips production in the areas of the world were carbon stock is decreasing, was 26.9% in 2019. For wood pellet and wood chips production data, see FAOSTAT 2020. For carbon stock data, see FAO 2020, p. 52, table 43.
- ^ «The potentially very long payback periods for forest biomass raise important issues given the UNFCCC’s aspiration of limiting warming to 1.5 °C above preindustrial levels to ‘significantly reduce the risks and impacts of climate change’. On current trends, this may be exceeded in around a decade. Relying on forest biomass for the EU’s renewable energy, with its associated initial increase in atmospheric carbon dioxide levels, increases the risk of overshooting the 1.5°C target if payback periods are longer than this. The European Commission should consider the extent to which large-scale forest biomass energy use is compatible with UNFCCC targets and whether a maximum allowable payback period should be set in its sustainability criteria.» EASAC 2017, p. 34.
- ^ «Some have argued that the length of the carbon payback period does not matter as long as all emissions are eventually absorbed. This ignores the potential impact in the short term on climate tipping points (a concept for which there is some evidence) and on the world’s ability to meet the target set in the 2015 Paris Agreement to limit temperature increase to 1.5°C above pre-industrial levels, which requires greenhouse gas emissions to peak in the near term. This suggests that only biomass energy with the shortest carbon payback periods should be eligible for financial and regulatory support.» EASAC 2017, p. 4.
- ^ «In many locations sawmill residuals from structural lumber production are abundant and they supply much of the raw material needed to produce wood pellets. In other locations, there are insufficient sawmill residuals. In those locations, the pellet mills, just like the pulp mills, use the non-sawlog portions of the tree.» FutureMetrics 2017, p. 8.
- ^ «Harvesting immediately reduces the standing forest carbon stock compared with less (or no) harvesting (Bellassen and Luyssaert, 2014; Sievänen et al., 2014) and it may take from decades to centuries until regrowth restores carbon stocks to their former level—especially if oldgrowth forests are harvested.» EASAC 2017, p. 21.
- ^ «Following this argument, the carbon dioxide (and other greenhouse gases) released by the burning of woody biomass for energy, along with their associated life-cycle emissions, create what is termed a ‘carbon debt’ – i.e. the additional emissions caused by burning biomass instead of the fossil fuels it replaces, plus the emissions absorption foregone from the harvesting of the forests. Over time, regrowth of the harvested forest removes this carbon from the atmosphere, reducing the carbon debt. The period until carbon parity is achieved (i.e. the point at which the net cumulative emissions from biomass use are equivalent to those from a fossil fuel plant generating the same amount of energy) is usually termed the ‘carbon payback period’. After this point, as regrowth continues biomass may begin to yield ‘carbon dividends’ in the form of atmospheric greenhouse gas levels lower than would have occurred if fossil fuels had been used. Eventually carbon levels in the forest return to the level at which they would have been if they had been left unharvested. (Some of the literature employs the term ‘carbon payback period’ to describe this longer period, but it is more commonly used to mean the time to parity with fossil fuels; this meaning is used in this paper.)» Chatham House 2017, p. 27.
- ^ «There is no such thing as a carbon debt if the stock of carbon held in the forest [is] not reduced.» FutureMetrics 2017, p. 7.
- ^ «It has been argued that carbon balances should not be assessed at the stand level since at landscape level depletion of carbon in one stand may be compensated by growth in a stand elsewhere. For scientific analysis of the impact on climate forcing, however, it is necessary to compare the effects of various bioenergy harvest options against a baseline of no bioenergy harvest (or other credible counterfactual scenarios) for the same area of forest. Such studies provide information on the impacts of changes at the stand level, which can then be integrated with other factors (economic, regulatory and social) that may influence effects at landscape level.» EASAC 2017, p. 23.
- ^ «It is important to realize that our 3650 ton per year CHP plant does not receive 3650 tons in one delivery and does not release 3650 tons of wood’s worth of carbon in one lump either. In fact, the forest products industry can be characterized as a just-in-time manufacturing system. For our CHP plant, 10 tons per day are sustainably harvested and delivered off of our 3650 acre FSC or SFI certified forest. So the carbon released into the atmosphere that day is from 10 tons of wood. The atmosphere “sees” new carbon. But during that same day on our 3650 acre plot, 10 new tons of wood grow and sequester the amount of carbon that was just released.» FutureMetrics 2011b, p. 2.
- ^ «Forests are generally managed as a series of stands of different ages, harvested at different times, to produce a constant supply of wood products. When considered at plot level, long-rotation forests take many years to regrow after harvest, and the EASAC statement indicates this as a time gap between releasing forest carbon and its reabsorption from the atmosphere. However, across the whole forest estate or landscape, the temporal fluctuations are evened out since other stands continue to grow and sequester carbon, making the time gap as indicated by EASAC less relevant. If annual harvest does not exceed the annual growth in the forest, there is no net reduction in forest carbon.» IEA Bioenergy 2019: «The use of forest biomass for climate change mitigation: response to statements of EASAC» IEA Bioenergy 2019, p. 2.
- ^ «The natural disturbance component is subtracted from the total estimate of […] emissions and removals, yielding an estimate of the emissions and removals associated with human activity on managed land.» See IPCC 2019j, p. 2.72. «The 2006 IPCC Guidelines are designed to assist in estimating and reporting national inventories of anthropogenic greenhouse gas emissions and removals. For the AFOLU Sector, anthropogenic greenhouse gas emissions and removals by sinks are defined as all those occurring on ‘managed land’. Managed land is land where human interventions and practices have been applied to perform production, ecological or social functions. [...] This approach, i.e., the use of managed land as a proxy for anthropogenic effects, was adopted in the GPG–LULUCF and that use is maintained in the present guidelines. The key rationale for this approach is that the preponderance of anthropogenic effects occurs on managed lands. By definition, all direct human-induced effects on greenhouse gas emissions and removals occur on managed lands only. While it is recognized that no area of the Earth’s surface is entirely free of human influence (e.g., CO2 fertilization), many indirect human influences on greenhouse gases (e.g., increased N deposition, accidental fire) will be manifested predominately on managed lands, where human activities are concentrated. Finally, while local and short-term variability in emissions and removals due to natural causes can be substantial (e.g., emissions from fire, see footnote 1), the natural ‘background’ of greenhouse gas emissions and removals by sinks tends to average out over time and space. This leaves the greenhouse gas emissions and removals from managed lands as the dominant result of human activity. Guidance and methods for estimating greenhouse gas emissions and removals for the AFOLU Sector now include: • CO2 emissions and removals resulting from C stock changes in biomass, dead organic matter and mineral soils, for all managed lands; • CO2 and non-CO2 emissions from fire on all managed land; • N2O emissions from all managed soils; • CO2 emissions associated with liming and urea application to managed soils; • CH4 emissions from rice cultivation; • CO2 and N2O emissions from cultivated organic soils; • CO2 and N2O emissions from managed wetlands (with a basis for methodological development for CH4 emissions from flooded land in an Appendix 3); • CH4 emission from livestock (enteric fermentation); • CH4 and N2O emissions from manure management systems; and • C stock change associated with harvested wood products.» See IPCC 2006b, p. 1.5.
- ^ «For example, limiting deployment of a mitigation response option will either result in increased climate change or additional mitigation in other sectors. A number of studies have examined limiting bioenergy and BECCS. Some such studies show increased emissions (Reilly et al. 2012). Other studies meet the same climate goal, but reduce emissions elsewhere via reduced energy demand (Grubler et al. 2018; Van Vuuren et al. 2018), increased fossil carbon capture and storage (CCS), nuclear energy, energy efficiency and/or renewable energy (Van Vuuren et al. 2018; Rose et al. 2014; Calvin et al. 2014; Van Vuuren et al. 2017b), dietary change (Van Vuuren et al. 2018), reduced non-CO2 emissions (Van Vuuren et al. 2018), or lower population (Van Vuuren et al. 2018).» IPCC 2019e, p. 637.
- ^ «Limitations on bioenergy and BECCS can result in increases in the cost of mitigation (Kriegler et al. 2014; Edmonds et al. 2013). Studies have also examined limiting CDR, including reforestation, afforestation, and bioenergy and BECCS (Kriegler et al. 2018a,b). These studies find that limiting CDR can increase mitigation costs, increase food prices, and even preclude limiting warming to less than 1.5°C above pre-industrial levels (Kriegler et al. 2018a,b; Muratori et al. 2016).» IPCC 2019e, p. 638.
- ^ "Bioenergy has an essential and major role to play in a low-carbon energy system. For instance, modern bioenergy in final global energy consumption should increase four-fold by 2060 in the IEA's 2°C scenario (2DS), which seeks to limit global average temperatures from rising more than 2°C by 2100 to avoid some of the worst effects of climate change. It plays a particularly important role in the transport sector where it helps to decarbonize long-haul transport (aviation, marine and long-haul road freight), with a ten-fold increase in final energy demand from today’s 3 EJ to nearly 30 EJ. Bioenergy is responsible for nearly 20% of the additional carbon savings needed in the 2DS compared to an emissions trajectory based on meeting existing and announced policies. But the current rate of bioenergy deployment is well below these 2DS levels. In the transport sector, biofuel consumption must triple by 2030, with two-thirds of that coming from advanced biofuels. That means scaling up current advanced biofuels production by at least 50 times to keep pace with the 2DS requirements by 2030. In scenarios with more ambitious carbon reduction objectives, such as the IEA’s Beyond 2 Degree Scenario (B2DS), bioenergy linked to carbon capture and storage also becomes necessary. [...] The roadmap also points out the need for a five-fold increase in sustainable bioenergy feedstock supply, much of which can be obtained from mobilising the potential of wastes and residues." IEA 2017a.
- ^ «Bioenergy from dedicated crops are in some cases held responsible for GHG emissions resulting from indirect land use change (iLUC), that is the bioenergy activity may lead to displacement of agricultural or forest activities into other locations, driven by market-mediated effects. Other mitigation options may also cause iLUC. At a global level of analysis, indirect effects are not relevant because all land-use emissions are direct. iLUC emissions are potentially more significant for crop-based feedstocks such as corn, wheat and soybean, than for advanced biofuels from lignocellulosic materials (Chum et al. 2011; Wicke et al. 2012; Valin et al. 2015; Ahlgren and Di Lucia 2014). Estimates of emissions from iLUC are inherently uncertain, widely debated in the scientific community and are highly dependent on modelling assumptions, such as supply/demand elasticities, productivity estimates, incorporation or exclusion of emission credits for coproducts and scale of biofuel deployment (Rajagopal and Plevin 2013; Finkbeiner 2014; Kim et al. 2014; Zilberman 2017). In some cases, iLUC effects are estimated to result in emission reductions. For example, market-mediated effects of bioenergy in North America showed potential for increased carbon stocks by inducing conversion of pasture or marginal land to forestland (Cintas et al. 2017; Duden et al. 2017; Dale et al. 2017; Baker et al. 2019). There is a wide range of variability in iLUC values for different types of biofuels, from –75–55 gCO2 MJ–1 (Ahlgren and Di Lucia 2014; Valin et al. 2015; Plevin et al. 2015; Taheripour and Tyner 2013; Bento and Klotz 2014). There is low confidence in attribution of emissions from iLUC to bioenergy.» IPCC 2019i, p. 194.
- ^ "The environmental costs and benefits of bioenergy have been the subject of significant debate, particularly for first‐generation biofuels produced from food (e.g. grain and oil seed). Studies have reported life‐cycle GHG savings ranging from an 86% reduction to a 93% increase in GHG emissions compared with fossil fuels (Searchinger et al., 2008; Davis et al., 2009; Liska et al., 2009; Whitaker et al., 2010). In addition, concerns have been raised that N2O emissions from biofuel feedstock cultivation could have been underestimated (Crutzen et al., 2008; Smith & Searchinger, 2012) and that expansion of feedstock cultivation on agricultural land might displace food production onto land with high carbon stocks or high conservation value (i.e. iLUC) creating a carbon debt which could take decades to repay (Fargione et al., 2008). Other studies have shown that direct nitrogen‐related emissions from annual crop feedstocks can be mitigated through optimized management practices (Davis et al., 2013) or that payback times are less significant than proposed (Mello et al., 2014). However, there are still significant concerns over the impacts of iLUC, despite policy developments aimed at reducing the risk of iLUC occurring (Ahlgren & Di Lucia, 2014; Del Grosso et al., 2014)." Whitaker et al. 2018, p. 151.
- ^ "The impact of growing bioenergy and biofuel feedstock crops has been of particular concern, with some suggesting the greenhouse gas (GHG) balance of food crops used for ethanol and biodiesel may be no better or worse than fossil fuels (Fargione et al., 2008; Searchinger et al., 2008). This is controversial, as the allocation of GHG emissions to the management and the use of coproducts can have a large effect on the total carbon footprint of resulting bioenergy products (Whitaker et al., 2010; Davis et al., 2013). The potential consequences of land use change (LUC) to bioenergy on GHG balance through food crop displacement or 'indirect' land use change (iLUC) are also an important consideration (Searchinger et al., 2008)." Milner et al. 2016, pp. 317–318.
- ^ "While the initial premise regarding bioenergy was that carbon recently captured from the atmosphere into plants would deliver an immediate reduction in GHG emission from fossil fuel use, the reality proved less straightforward. Studies suggested that GHG emission from energy crop production and land-use change might outweigh any CO2 mitigation (Searchinger et al., 2008; Lange, 2011). Nitrous oxide (N2O) production, with its powerful global warming potential (GWP), could be a significant factor in offsetting CO2 gains (Crutzen et al., 2008) as well as possible acidification and eutrophication of the surrounding environment (Kim & Dale, 2005). However, not all biomass feedstocks are equal, and most studies critical of bioenergy production are concerned with biofuels produced from annual food crops at high fertilizer cost, sometimes using land cleared from natural ecosystems or in direct competition with food production (Naik et al., 2010). Dedicated perennial energy crops, produced on existing, lower grade, agricultural land, offer a sustainable alternative with significant savings in greenhouse gas emissions and soil carbon sequestration when produced with appropriate management (Crutzen et al., 2008; Hastings et al., 2008, 2012; Cherubini et al., 2009; Dondini et al., 2009a; Don et al., 2012; Zatta et al., 2014; Richter et al., 2015)." McCalmont et al. 2017, p. 490.
- ^ "Significant reductions in GHG emissions have been demonstrated in many LCA studies across a range of bioenergy technologies and scales (Thornley et al., 2009, 2015). The most significant reductions have been noted for heat and power cases. However, some other studies (particularly on transport fuels) have indicated the opposite, that is that bioenergy systems can increase GHG emissions (Smith & Searchinger, 2012) or fail to achieve increasingly stringent GHG savings thresholds. A number of factors drive this variability in calculated savings, but we know that where significant reductions are not achieved or wide variability is reported there is often associated data uncertainty or variations in the LCA methodology applied (Rowe et al., 2011). For example, data uncertainty in soil carbon stock change following LUC has been shown to significantly influence the GHG intensity of biofuel production pathways (Fig. 3), whilst the shorter term radiative forcing impact of black carbon particles from the combustion of biomass and biofuels also represents significant data uncertainty (Bond et al., 2013)." Whitaker et al. 2018, pp. 156–157.
- ^ "Soil carbon stocks are a balance between the soil organic matter decomposition rate and the organic material input each year by vegetation, animal manure, or any other organic input." McCalmont et al. 2017, p. 496.
- ^ "Any soil disturbance, such as ploughing and cultivation, is likely to result in short-term respiration losses of soil organic carbon, decomposed by stimulated soil microbe populations (Cheng, 2009; Kuzyakov, 2010). Annual disturbance under arable cropping repeats this year after year resulting in reduced SOC levels. Perennial agricultural systems, such as grassland, have time to replace their infrequent disturbance losses which can result in higher steady-state soil carbon contents (Gelfand et al., 2011; Zenone et al., 2013)." McCalmont et al. 2017, p. 493.
- ^ "Tillage breaks apart soil aggregates which, among other functions, are thought to inhibit soil bacteria, fungi and other microbes from consuming and decomposing SOM (Grandy and Neff 2008). Aggregates reduce microbial access to organic matter by restricting physical access to mineral-stabilised organic compounds as well as reducing oxygen availability (Cotrufo et al. 2015; Lehmann and Kleber 2015). When soil aggregates are broken open with tillage in the conversion of native ecosystems to agriculture, microbial consumption of SOC and subsequent respiration of CO2 increase dramatically, reducing soil carbon stocks (Grandy and Robertson 2006; Grandy and Neff 2008)." IPCC 2019a, p. 393.
- ^ "A systematic review and meta-analysis were used to assess the current state of knowledge and quantify the effects of land use change (LUC) to second generation (2G), non-food bioenergy crops on soil organic carbon (SOC) and greenhouse gas (GHG) emissions of relevance to temperate zone agriculture. Following analysis from 138 original studies, transitions from arable to short rotation coppice (SRC, poplar or willow) or perennial grasses (mostly Miscanthus or switchgrass) resulted in increased SOC (+5.0 ± 7.8% and +25.7 ± 6.7% respectively)." Harris, Spake & Taylor 2015, p. 27.
- ^ "[...] it seems likely that arable land converted to Miscanthus will sequester soil carbon; of the 14 comparisons, 11 showed overall increases in SOC over their total sample depths with suggested accumulation rates ranging from 0.42 to 3.8 Mg C ha−1 yr−1. Only three arable comparisons showed lower SOC stocks under Miscanthus, and these suggested insignificant losses between 0.1 and 0.26 Mg ha−1 yr−1." McCalmont et al. 2017, p. 493.
- ^ "The correlation between plantation age and SOC can be seen in Fig. 6, [...] the trendline suggests a net accumulation rate of 1.84 Mg C ha−1 yr−1 with similar levels to grassland at equilibrium." McCalmont et al. 2017, p. 496.
- ^ Given the EU average peak yield of 22 tonnes dry matter per hectare per year (approximately 15 tonnes during spring harvest). See Anderson et al. 2014, p. 79). 15 tonnes also explicitly quoted as the mean spring yield in Germany, see Felten & Emmerling 2012, p. 662. 48% carbon content; see Kahle et al. 2001, table 3, page 176.
- ^ "Our work shows that crop establishment, yield and harvesting method affect the C. cost of Miscanthus solid fuel which for baled harvesting is 0.4 g CO2 eq. C MJ−1 for rhizome establishment and 0.74 g CO2 eq. C MJ−1 for seed plug establishment. If the harvested biomass is chipped and pelletized, then the emissions rise to 1.2 and 1.6 g CO2 eq. C MJ−1, respectively. The energy requirements for harvesting and chipping from this study that were used to estimate the GHG emissions are in line with the findings of Meehan et al. (2013). These estimates of GHG emissions for Miscanthus fuel confirm the findings of other life-cycle assessment (LCA) studies (e.g., Styles and Jones, 2008) and spatial estimates of GHG savings using Miscanthus fuel (Hastings et al., 2009). They also confirm that Miscanthus has a comparatively small GHG footprint due to its perennial nature, nutrient recycling efficiency and need for less chemical input and soil tillage over its 20-year life-cycle than annual crops (Heaton et al., 2004, 2008; Clifton-Brown et al., 2008; Gelfand et al., 2013; McCalmont et al., 2015a; Milner et al., 2015). In this analysis, we did not consider the GHG flux of soil which was shown to sequester on average in the United Kingdom 0.5 g of C per MJ of Miscanthus derived fuel by McCalmont et al. (2015a). Changes in SOC resulting from the cultivation of Miscanthus depend on the previous land use and associated initial SOC. If high carbon soils such as peatland, permanent grassland, and mature forest are avoided and only arable and rotational grassland with mineral soil is used for Miscanthus then the mean increase in SOC for the first 20-year crop rotation in the United Kingdom is ∼ 1–1.4 Mg C ha−1 y−1 (Milner et al., 2015). In spite of ignoring this additional benefit, these GHG cost estimates compare very favorably with coal (33 g CO2 eq. C MJ−1), North Sea Gas (16), liquefied natural gas (22), and wood chips imported from the United States (4). In addition, although Miscanthus production C. cost is only < 1/16 of the GHG cost of natural gas as a fuel (16–22 g CO2 eq. C MJ-1), it is mostly due to the carbon embedded in the machinery, chemicals and fossil fuel used in its production. As the economy moves away from dependence on these fossil fuels for temperature regulation (heat for glasshouse temperature control or chilling for rhizome storage) or transport, then these GHG costs begin to fall away from bioenergy production. It should be noted, the estimates in this paper do not consider either the potential to sequester C. in the soil nor any impact or ILUC (Hastings et al., 2009)." Hastings et al. 2017, pp. 12–13.
- ^ See Whitaker et al. 2018, pp. 156, Appendix S1
- ^ "Whilst these values represent the extremes, they demonstrate that site selection for bioenergy crop cultivation can make the difference between large GHG [greenhouse gas] savings or losses, shifting life‐cycle GHG emissions above or below mandated thresholds. Reducing uncertainties in ∆C [carbon increase or decrease] following LUC [land use change] is therefore more important than refining N2O [nitrous oxide] emission estimates (Berhongaray et al., 2017). Knowledge on initial soil carbon stocks could improve GHG savings achieved through targeted deployment of perennial bioenergy crops on low carbon soils (see section 2). [...] The assumption that annual cropland provides greater potential for soil carbon sequestration than grassland appears to be over‐simplistic, but there is an opportunity to improve predictions of soil carbon sequestration potential using information on the initial soil carbon stock as a stronger predictor of ∆C [change in carbon amount] than prior land use." Whitaker et al. 2018, pp. 156, 160.
- ^ "Fig. 3 confirmed either no change or a gain of SOC [soil organic carbon] (positive) through planting Miscanthus on arable land across England and Wales and only a loss of SOC (negative) in parts of Scotland. The total annual SOC change across GB in the transition from arable to Miscanthus if all nonconstrained land was planted with would be 3.3 Tg C yr−1 [3.3 million tonnes carbon per year]. The mean changes for SOC for the different land uses were all positive when histosols were excluded, with improved grasslands yielding the highest Mg C ha−1 yr−1 [tonnes carbon per hectare per year] at 1.49, followed by arable lands at 1.28 and forest at 1. Separating this SOC change by original land use (Fig. 4) reveals that there are large regions of improved grasslands which, if planted with bioenergy crops, are predicted to result in an increase in SOC. A similar result was found when considering the transition from arable land; however for central eastern England, there was a predicted neutral effect on SOC. Scotland, however, is predicted to have a decrease for all land uses, particularly for woodland due mainly to higher SOC and lower Miscanthus yields and hence less input." Milner et al. 2016, p. 123.
- ^ "In summary, we have quantified the impacts of LUC [land use change] to bioenergy cropping on SOC and GHG balance. This has identified LUC from arable, in general to lead to increased SOC, with LUC from forests to be associated with reduced SOC and enhanced GHG emissions. Grasslands are highly variable and uncertain in their response to LUC to bioenergy and given their widespread occurrence across the temperate landscape, they remain a cause for concern and one of the main areas where future research efforts should be focussed." Harris, Spake & Taylor 2015, p. 37 (see also p. 33 regarding SOC variations). The authors note however that "[t]he average time since transition across all studies was 5.5 years (Xmax 16, Xmin 1) for SOC" and that "[...] the majority of studies considered SOC at the 0–30 cm profile only [...]." Harris, Spake & Taylor 2015, pp. 29–30. Low carbon accumulation rates for young plantations are to be expected, because of accelerated carbon decay at the time of planting (due to soil aeration), and relatively low mean carbon input to the soil during the establishment phase (2-3 years). Also, since dedicated energy crops like miscanthus produce significantly more biomass per year than regular grasslands, and roughly 25% of the carbon content of that biomass is successfully added to the soil carbon stock every year (see Net annual carbon accumulation), it seems reasonable to expect that over time, soil organic carbon will increase also on converted grasslands. The authors quote a carbon building phase of 30-50 years for perennials on converted grasslands, see Harris, Spake & Taylor 2015, p. 31.
- ^ «Traditional biomass (fuelwood, charcoal, agricultural residues, animal dung) used for cooking and heating by some 2.8 billion people (38% of global population) in non-OECD countries accounts for more than half of all bioenergy used worldwide (IEA 2017; REN21 2018) (Cross-Chapter Box 7 in Chapter 6). Cooking with traditional biomass has multiple negative impacts on human health, particularly for women, children and youth (Machisa et al. 2013; Sinha and Ray 2015; Price 2017; Mendum and Njenga 2018; Adefuye et al. 2007) and on household productivity, including high workloads for women and youth (Mendum and Njenga 2018; Brunner et al. 2018; Hou et al. 2018; Njenga et al. 2019). Traditional biomass is land-intensive due to reliance on open fires, inefficient stoves and overharvesting of woodfuel, contributing to land degradation, losses in biodiversity and reduced ecosystem services (IEA 2017; Bailis et al. 2015; Masera et al. 2015; Specht et al. 2015; Fritsche et al. 2017; Fuso Nerini et al. 2017). Traditional woodfuels account for 1.9–2.3% of global GHG emissions, particularly in ‘hotspots’ of land degradation and fuelwood depletion in eastern Africa and South Asia, such that one-third of traditional woodfuels globally are harvested unsustainably (Bailis et al. 2015). Scenarios to significantly reduce reliance on traditional biomass in developing countries present multiple co-benefits (high evidence, high agreement), including reduced emissions of black carbon, a short-lived climate forcer that also causes respiratory disease (Shindell et al. 2012). A shift from traditional to modern bioenergy, especially in the African context, contributes to improved livelihoods and can reduce land degradation and impacts on ecosystem services (Smeets et al. 2012; Gasparatos et al. 2018; Mudombi et al. 2018).» IPCC 2019a, p. 375.
- ^ Cf. Smil's estimate of 0.60 W/m2 for the 10 t/ha yield above. The calculation is: Yield (t/ha) multiplied with energy content (GJ/t) divided by seconds in a year (31 556 926) multiplied with the number of square metres in one hectare (10 000).
- ^ Jump up to: a b c d For yield estimates see FAO's "The global outlook for future wood supply from forest plantations", section 2.7.2 – 2.7.3. Scot's pine, native to Europe and northern Asia, weighs 390 kg/m3 oven dry (moisture content 0%). The oven dry weight of eucalyptus species commonly grown in plantations in South America is 487 kg/m3 (average of Lyptus, Rose Gum and Deglupta). The average weight of poplar species commonly grown in plantations in Europe is 335 kg/m3 (average of White Poplar and Black Poplar.
- ^ "The raw material for wood pellets is woody biomass in accordance with Table 1 of ISO 17225‑1. Pellets are usually manufactured in a die, with total moisture content usually less than 10 % of their mass on wet basis." ISO (International Organization for Standardization) 2014a.
- ^ "The raw material for non-woody pellets can be herbaceous biomass, fruit biomass, aquatic biomass or biomass blends and mixtures. These blends and mixtures can also include woody biomass. They are usually manufactured in a die with total moisture content usually less than 15 % of their mass." ISO (International Organization for Standardization) 2014b.
- ^ Transmission loss data from the World Bank, sourced from IEA. The World Bank 2010.
- ^ Additionally, Smil estimates that newly installed photovoltaic solar parks reaches 7–11 W/m2 in sunny regions of the world. Smil 2015, p. 191.
References[]
- ^ "Biomass – Energy Explained, Your Guide To Understanding Energy". U.S. Energy Information Administration. June 21, 2018.
- ^ The EIA states: "Biofuels are transportation fuels such as ethanol and biodiesel that are made from biomass materials." https://www.eia.gov/energyexplained/index.php?page=biofuel_home
- ^ "Renewable Energy Sources and Climate Change Mitigation. Special Report of the Intergovernmental Panel on Climate Change" (PDF). IPCC.
- ^ "Green groups dispute power station claim that biomass is carbon-neutral". the Guardian. 2021-03-23. Retrieved 2021-03-23.
- ^ Grunwald, Michael. "The 'Green Energy' That Might Be Ruining the Planet". POLITICO. Retrieved 2021-03-27.
If a tree falls in a forest—and then it’s driven to a mill, where it’s chopped and chipped and compressed into wood pellets, which are then driven to a port and shipped across the ocean to be burned for electricity in European power plants—does it warm the planet? Most scientists and environmentalists say yes: By definition, clear-cutting trees and combusting their carbon emits greenhouse gases that heat up the earth.
- ^ Darby, Thomas. "What Is Biomass Renewable Energy". Real World Energy. Archived from the original on 2014-06-08. Retrieved 12 June 2014.
- ^ Randor Radakovits; Robert E. Jinkerson; Al Darzins; Matthew C. Posewitz1 (2010). "Genetic Engineering of Algae for Enhanced Biofuel Production". Eukaryotic Cell. 9 (4): 486–501. doi:10.1128/EC.00364-09. PMC 2863401. PMID 20139239.
- ^ "Biomass-to-Fuel Conversion (Princeton University USA)". Archived from the original on 2015-02-01. Retrieved 2015-02-13.
- ^ Pishvaee, Mohseni & Bairamzadeh 2021, pp. 1–20.
- ^ Akhtar, Krepl & Ivanova 2018.
- ^ Smith, Aidan Mark; Whittaker, Carly; Shield, Ian; Ross, Andrew Barry (2018). "The potential for production of high quality bio-coal from early harvested Miscanthus by hydrothermal carbonisation". Fuel. 220: 546–557. doi:10.1016/j.fuel.2018.01.143.
- ^ Liu et al. 2011.
- ^ Conversion technologies Archived 2009-10-26 at the Wayback Machine. Biomassenergycentre.org.uk. Retrieved on 2012-02-28.
- ^ "Biochemical Conversion of Biomass". BioEnergy Consult. 2014-05-29. Retrieved 2016-10-18.
- ^ Linares-Pastén, J. A.; Andersson, M; Nordberg karlsson, E (2014). "Thermostable glycoside hydrolases in biorefinery technologies" (PDF). Current Biotechnology. 3 (1): 26–44. doi:10.2174/22115501113026660041.
- ^ Munnings, C.; Kulkarni, A.; Giddey, S.; Badwal, S.P.S. (August 2014). "Biomass to power conversion in a direct carbon fuel cell". International Journal of Hydrogen Energy. 39 (23): 12377–12385. doi:10.1016/j.ijhydene.2014.03.255.
- ^ Kim, Ye Eun (17 May 2011). "Surface Modifications of a Carbon Anode Catalyst by Control of Functional Groups for Vitamin C Fuel Cells". Electrocatalysis. 2 (3): 200–206. doi:10.1007/s12678-011-0055-0. S2CID 93344222.
- ^ Knight, Chris (2013). "Chapter 6 – Application of Microbial Fuel Cells to Power Sensor Networks for Ecological Monitoring". Wireless Sensor Networks and Ecological Monitoring. Smart Sensors, Measurement and Instrumentation. 3. pp. 151–178. doi:10.1007/978-3-642-36365-8_6. ISBN 978-3-642-36364-1.
- ^ Badwal, Sukhvinder P. S.; Giddey, Sarbjit S.; Munnings, Christopher; Bhatt, Anand I.; Hollenkamp, Anthony F. (24 September 2014). "Emerging electrochemical energy conversion and storage technologies (open access)". Frontiers in Chemistry. 2: 79. Bibcode:2014FrCh....2...79B. doi:10.3389/fchem.2014.00079. PMC 4174133. PMID 25309898.
- ^ Hanssen et al. 2017, p. 3 (Figure S3 in the Supporting Information document, link to document available at the bottom of the article).
- ^ IEA 2020.
- ^ Hanssen et al. 2017, pp. 3-4 (Figure S3 and Table S1 in the Supporting Information document, link to document available at the bottom of the article).
- ^ IEA Bioenergy 2006, pp. 1, 4 (table 4).
- ^ Chatham House 2017, p. 2.
- ^ Jump up to: a b c IEA Bioenergy 2019, p. 3.
- ^ Jump up to: a b FutureMetrics 2012, p. 2.
- ^ ISO (International Organization for Standardization) 2014.
- ^ Indiana Center for Coal Technology Research 2008, p. 13.
- ^ "EURACOAL statistics". The voice of coal in Europe. 2019. Retrieved 2021-03-10.
- ^ The Manomet Center for Conservation Sciences 2010, p. 103-104.
- ^ IPCC 2019a, p. 368.
- ^ Jump up to: a b IEA Bioenergy 2019, p. 4.
- ^ Jump up to: a b IPCC 2019a, p. 351.
- ^ IPCC 2019a, p. 348.
- ^ Reid Miner 2010, p. 39–40.
- ^ FAO 2020, p. 16, 52.
- ^ IPCC 2019a, p. 385.
- ^ EASAC 2017, p. 33.
- ^ EASAC 2017, p. 1.
- ^ Chatham House 2017, p. 3.
- ^ Stephenson et al. 2014.
- ^ IPCC 2019b, p. B.1.4.
- ^ Jump up to: a b IPCC 2019a, p. 386.
- ^ IPCC 2019f, p. 4.6.
- ^ Reid Miner 2010, p. 39.
- ^ IEA Bioenergy 2019, p. 4–5.
- ^ IPCC 2019b.
- ^ NAUFRP 2014, p. 2.
- ^ Favero, Daigneault & Sohngen 2020, p. 6.
- ^ Chatham House 2017, p. 7.
- ^ EASAC 2017, p. 23, 26, 35.
- ^ Chatham House 2017, p. 21–22.
- ^ FutureMetrics 2016, p. 5–9.
- ^ Chatham House 2017, p. 19.
- ^ Chatham House 2017, p. 68.
- ^ FutureMetrics 2011a, p. 5.
- ^ John Gunn 2011.
- ^ Hanssen et al. 2017, p. 1416.
- ^ Jump up to: a b IPCC 2007, p. 549.
- ^ IPCC 2019j, p. 2.67.
- ^ Hanssen et al. 2017, pp. 1408–1410.
- ^ IPCC 2019g, p. 194.
- ^ IPCC 2019b, p. B 7.4.
- ^ IEA 2017.
- ^ NAUFRP 2014, p. 1–2.
- ^ "Biomass explained". U.S. Energy Information Administration Federal Statistical System of the United States. 25 October 2019. Retrieved 31 October 2020.
- ^ "Short rotation forestry". Forest Research. 2018-05-29. Retrieved 2020-10-19.
- ^ Soil Carbon under Switchgrass Stands and Cultivated Cropland (Interpretive Summary and Technical Abstract). USDA Agricultural Research Service, April 1, 2005
- ^ Gasparatos et al. 2017, p. 174.
- ^ Jump up to: a b Gasparatos et al. 2017, p. 166.
- ^ Gasparatos et al. 2017, p. 172.
- ^ Gasparatos et al. 2017, p. 167.
- ^ Jump up to: a b c Gasparatos et al. 2017, p. 168.
- ^ Gasparatos et al. 2017, p. 173.
- ^ IPCC 2019h, p. 628.
- ^ Springsteen, Bruce; Christofk, Tom; Eubanks, Steve; Mason, Tad; Clavin, Chris; Storey, Brett (January 2011). "Emission Reductions from Woody Biomass Waste for Energy as an Alternative to Open Burning". Journal of the Air & Waste Management Association. 61 (1): 63–68. doi:10.3155/1047-3289.61.1.63. PMID 21305889.
- ^ Gustafsson, O.; Krusa, M.; Zencak, Z.; Sheesley, R. J.; Granat, L.; Engstrom, E.; Praveen, P. S.; Rao, P. S. P.; Leck, C.; Rodhe, H. (23 January 2009). "Brown Clouds over South Asia: Biomass or Fossil Fuel Combustion?". Science. 323 (5913): 495–498. Bibcode:2009Sci...323..495G. doi:10.1126/science.1164857. PMID 19164746. S2CID 44712883.
- ^ "Pulp Fiction, The Series". www.climatecentral.org. Retrieved 2021-03-05.
- ^ "Biomass Basics – biofuelwatch". Retrieved 2021-03-05.
- ^ Ribout, Benjamin (2020-06-03). "Illegal logging in Romania overwhelms authorities". www.euractiv.com. Retrieved 2021-03-05.
- ^ Wyatt, Tanya (2014-02-01). "The Russian Far East's illegal timber trade: an organized crime?". Crime, Law and Social Change. 61 (1): 15–35. doi:10.1007/s10611-013-9461-y. ISSN 1573-0751. S2CID 153645746.
- ^ "Illegal logging implicated in vast Siberian wild fires". The Irish Times. Retrieved 2021-03-05.
- ^ "Plans for burning Namibian wood in German power plants denounced". Robin Wood (in German). Retrieved 2021-03-05.
- ^ Shikangalah & Mapani 2020, pp. 251–266.
- ^ orchestrator (2021-03-20). "Standing up for forests and against the Swedish forestry model: A letter to EC policymakers". Forest Defenders Alliance. Retrieved 2021-04-19.
- ^ "Risk Map: Primary forest and threatened caribou habitat overlap with preliminary estimated wood pellet haul zones for Pinnacle/Drax in British Columbia". Stand.earth. 2021-03-23. Retrieved 2021-04-19.
- ^ Gatten, Emma (2021-02-19). "Mississippi wood pellet plant that supplies UK electricity grid fined $2.5m over air pollution". The Telegraph. ISSN 0307-1235. Retrieved 2021-03-05.
- ^ "British Power Stations Are Burning Wood From US Forests – To Meet Renewables Target". IFLScience. Retrieved 2021-03-05.
- ^ Smil 2015, pp. 26-27, 211, box 7.1.
- ^ Van Zalk, John; Behrens, Paul (2018-12-01). "The spatial extent of renewable and non-renewable power generation: A review and meta-analysis of power densities and their application in the U.S." Energy Policy. 123: 86. doi:10.1016/j.enpol.2018.08.023. ISSN 0301-4215.
- ^ Smil 2015, p. 170.
- ^ Smil 2015, p. 2095 (kindle location).
- ^ Jump up to: a b Smil 2015, p. 228.
- ^ Smil 2015, p. 89.
- ^ Smil 2015, p. 91.
- ^ Jump up to: a b c d Smil 2015, p. 227.
- ^ Smil 2015, p. 90.
- ^ Jump up to: a b Smil 2015, p. 229.
- ^ Smil 2015, pp. 80, 89.
- ^ Schwarz 1993, p. 413.
- ^ Flores et al. 2012, p. 831.
- ^ Ghose 2011, p. 263.
- ^ Jump up to: a b Smil 2015, p. 85.
- ^ Smil 2015, p. 86.
- ^ Smil 2008, p. 75-76.
- ^ IPCC 2019f, p. 4.34 – 4.41.
- ^ van den Broek 1996, p. 271.
- ^ "RENEWABLE CAPACITY STATISTICS 2021 page 41" (PDF). Retrieved 24 May 2021.
Sources[]
- Pishvaee, Mir Saman; Mohseni, Shayan; Bairamzadeh, Samira (2021). "An overview of biomass feedstocks for biofuel production". Biomass to Biofuel Supply Chain Design and Planning Under Uncertainty. Elsevier. doi:10.1016/b978-0-12-820640-9.00001-5. ISBN 978-0-12-820640-9.
- Akhtar, Ali; Krepl, Vladimir; Ivanova, Tatiana (2018-07-05). "A Combined Overview of Combustion, Pyrolysis, and Gasification of Biomass". Energy & Fuels. American Chemical Society (ACS). 32 (7): 7294–7318. doi:10.1021/acs.energyfuels.8b01678. ISSN 0887-0624.
- Liu, Guangjian; Larson, Eric D.; Williams, Robert H.; Kreutz, Thomas G.; Guo, Xiangbo (2011-01-20). "Making Fischer−Tropsch Fuels and Electricity from Coal and Biomass: Performance and Cost Analysis". Energy & Fuels. American Chemical Society (ACS). 25 (1): 415–437. doi:10.1021/ef101184e. ISSN 0887-0624.
- McCalmont, Jon P.; Hastings, Astley; McNamara, Niall P.; Richter, Goetz M.; Robson, Paul; Donnison, Iain S.; Clifton-Brown, John (March 2017). "Environmental costs and benefits of growing Miscanthus for bioenergy in the UK". GCB Bioenergy. 9 (3): 489–507. doi:10.1111/gcbb.12294. PMC 5340280. PMID 28331551.
- Kahle, Petra; Beuch, Steffen; Boelcke, Barbara; Leinweber, Peter; Schulten, Hans-Rolf (November 2001). "Cropping of Miscanthus in Central Europe: biomass production and influence on nutrients and soil organic matter". European Journal of Agronomy. 15 (3): 171–184. doi:10.1016/S1161-0301(01)00102-2.
- Whitaker, Jeanette; Field, John L.; Bernacchi, Carl J.; Cerri, Carlos E. P.; Ceulemans, Reinhart; Davies, Christian A.; DeLucia, Evan H.; Donnison, Iain S.; McCalmont, Jon P.; Paustian, Keith; Rowe, Rebecca L.; Smith, Pete; Thornley, Patricia; McNamara, Niall P. (March 2018). "Consensus, uncertainties and challenges for perennial bioenergy crops and land use". GCB Bioenergy. 10 (3): 150–164. doi:10.1111/gcbb.12488. PMC 5815384. PMID 29497458.
- Milner, Suzanne; Holland, Robert A.; Lovett, Andrew; Sunnenberg, Gilla; Hastings, Astley; Smith, Pete; Wang, Shifeng; Taylor, Gail (March 2016). "Potential impacts on ecosystem services of land use transitions to second-generation bioenergy crops in GB". GCB Bioenergy. 8 (2): 317–333. doi:10.1111/gcbb.12263. PMC 4974899. PMID 27547244.
- Harris, Z.M.; Spake, R.; Taylor, G. (November 2015). "Land use change to bioenergy: A meta-analysis of soil carbon and GHG emissions". Biomass and Bioenergy. 82: 27–39. doi:10.1016/j.biombioe.2015.05.008.
- Anderson, Eric; Arundale, Rebecca; Maughan, Matthew; Oladeinde, Adebosola; Wycislo, Andrew; Voigt, Thomas (9 April 2014). "Growth and agronomy of Miscanthus x giganteus for biomass production". Biofuels. 2 (1): 71–87. doi:10.4155/bfs.10.80.
- Felten, Daniel; Emmerling, Christoph (October 2012). "Accumulation of Miscanthus‐derived carbon in soils in relation to soil depth and duration of land use under commercial farming conditions". Journal of Plant Nutrition and Soil Science. 175 (5): 661–670. doi:10.1002/jpln.201100250.
- Hastings, Astley; Mos, Michal; Yesufu, Jalil A.; McCalmont, Jon; Schwarz, Kai; Ashman, Chris; Nunn, Chris; Schuele, Heinrich; Cosentino, Salvatore; Scalici, Giovanni; Scordia, Danilo; Wagner, Simon; Harding, Graham; Clifton-Brown, John (June 2017). "Economic and Environmental Assessment of Seed and Rhizome Propagated Miscanthus in the UK". Frontiers in Plant Science. 8: 1058. doi:10.3389/fpls.2017.01058. PMC 5491852. PMID 28713395.}
- van den Broek, Richard (1996). "Biomass combustion for power generation". Biomass and Bioenergy. 11 (4): 271–281. doi:10.1016/0961-9534(96)00033-5.
- Flores, Rilner A.; Urquiaga, Segundo; Alves, Bruno J. R.; Collier, Leonardo S.; Boddey, Robert M. (October 2012). "Yield and quality of elephant grass biomass produced in the cerrados region for bioenergy". Engenharia Agrícola. 32 (5): 831–839. doi:10.1590/s0100-69162012000500003.
- Ghose, Mrinal K. (2011). Speight, James (ed.). The Biofuels Handbook. Cambridge: Royal Society of Chemistry, The Ingram Publisher Services distributor. ISBN 978-1-84973-026-6. OCLC 798795266.
- ISO (International Organization for Standardization) (2014a). "ISO 17225-2:2014(en) Solid biofuels — Fuel specifications and classes — Part 2: Graded wood pellets". Retrieved 11 July 2020.
- ISO (International Organization for Standardization) (2014b). "ISO 17225-6:2014(en) Solid biofuels — Fuel specifications and classes — Part 6: Graded non-woody pellets". Retrieved 11 July 2020.
- Schwarz, H. (January 1993). "Miscanthus sinensis 'giganteus' production on several sites in Austria". Biomass and Bioenergy. 5 (6): 413–419. doi:10.1016/0961-9534(93)90036-4.
- Smil, Vaclav (2008). Energy in Nature and Society: General Energetics of Complex Systems. MIT Press. ISBN 978-0-262-69356-1.
- Smil, Vaclav (2015). Power density: a key to understanding energy sources and uses. Cambridge, Massachusetts: The MIT Press. ISBN 978-0-262-02914-8. OCLC 897401827.
- The World Bank (2010). "Electric power transmission and distribution losses (% of output)". Retrieved 11 July 2020.
- IEA (2017a). "Plotting a path for greater bioenergy use".
- IEA (2017b). "Technology Roadmap – Delivering Sustainable Bioenergy".
- EASAC (2017). "Multi-functionality and sustainability in the European Union's forests" (PDF).
- EPA (2020). "Emission Factors for Greenhouse Gas Inventories" (PDF).
- Chatham House (2017). "Woody Biomass for Power and Heat. Impacts on the Global Climate" (PDF).
- IEA Bioenergy (2019). "The use of forest biomass for climate change mitigation: response to statements of EASAC" (PDF).
- FutureMetrics (2015a). "Debunking two so-called "facts" about Wood Pellets" (PDF).
- FutureMetrics (2012). "A Look at the Details of CO2 Emissions from burning Wood vs. Coal" (PDF).
- ISO (International Organization for Standardization) (2014). "ISO 17225-2:2014(en) Solid biofuels — Fuel specifications and classes — Part 2: Graded wood pellets".
- Indiana Center for Coal Technology Research (2008). "Coal Characteristics - CCTR Basic Facts File # 8" (PDF).
- The Manomet Center for Conservation Sciences (2010). "Biomass Sustainability and Carbon Policy Study".
- IPCC (2006a). "2006 IPCC Guidelines for National Greenhouse Gas Inventories. Volume 2: Energy. Chapter 2: Stationary Combustion" (PDF).
- Reid Miner (2010). "Impact of the global forest industry on atmospheric greenhouse gases" (PDF).
- FAO (2020). "Global Forest Resources Assessment" (PDF).
- Stephenson, N. L.; Das, A. J.; Condit, R.; Russo, S. E.; Baker, P. J.; Beckman, N. G.; Coomes, D. A.; Lines, E. R.; Morris, W. K.; Rüger, N.; Álvarez, E.; Blundo, C.; Bunyavejchewin, S.; Chuyong, G.; Davies, S. J.; Duque, Á.; Ewango, C. N.; Flores, O.; Franklin, J. F.; Grau, H. R.; Hao, Z.; Harmon, M. E.; Hubbell, S. P.; Kenfack, D.; Lin, Y.; Makana, J.-R.; Malizia, A.; Malizia, L. R.; Pabst, R. J.; Pongpattananurak, N.; Su, S.-H.; Sun, I-F.; Tan, S.; Thomas, D.; van Mantgem, P. J.; Wang, X.; Wiser, S. K.; Zavala, M. A. (2014-01-15). "Rate of tree carbon accumulation increases continuously with tree size". Nature. Springer Science and Business Media LLC. 507 (7490): 90–93. Bibcode:2014Natur.507...90S. doi:10.1038/nature12914. ISSN 0028-0836. PMID 24429523. S2CID 4387375.
- NAUFRP (2014). "Letter of transmittal".
- Favero, Alice; Daigneault, Adam; Sohngen, Brent (2020). "Forests: Carbon sequestration, biomass energy, or both?". Science Advances. American Association for the Advancement of Science (AAAS). 6 (13): eaay6792. Bibcode:2020SciA....6.6792F. doi:10.1126/sciadv.aay6792. ISSN 2375-2548.
- FAOSTAT (2020). "Forestry Production and Trade".
- FutureMetrics (2016). "The Washington Post and 65 "Experts" that Wrote a Letter to Congress Are Wrong about Biomass for Energy" (PDF).
- FutureMetrics (2017). "'Alternative Facts' in the Recent Chatham House Paper" (PDF).
- FutureMetrics (2011a). "Response to the comments made by Manomet regarding the recent paper by FutureMetrics about the Manomet Study on biomass" (PDF).
- John Gunn (2011). "The Biomass Carbon Debate: When To Start Counting?".
- FutureMetrics (2011b). ""Good News, FutureMetrics and Manomet Agree (sort of – and of course that is our opinion)"" (PDF).
- IPCC (2007). "Climate Change 2007: Mitigation. Contribution of Working Group III to the Fourth Assessment Report of the Intergovernmental Panel on Climate Change. Chapter 9. Forestry" (PDF).
- IPCC (2019f). "2019 Refinement to the 2006 IPCC Guidelines for National Greenhouse Gas Inventories. Volume 4. Agriculture, Forestry and Other Land Use. Chapter 4. Forest Land" (PDF).
- IPCC (2006b). "2006 IPCC Guidelines for National Greenhouse Gas Inventories. Volume 4. Agriculture, Forestry and Other Land Use. Chapter 1: Introduction" (PDF).
- IEA Bioenergy (2006). "GHG Impacts of Pellet Production from Woody Biomass Sources in BC, Canada" (PDF).
- Hanssen, Steef V.; Duden, Anna S.; Junginger, Martin; Dale, Virginia H.; van der Hilst, Floor (2017-01-17). "Wood pellets, what else? Greenhouse gas parity times of European electricity from wood pellets produced in the south-eastern United States using different softwood feedstocks". GCB Bioenergy. Wiley. 9 (9): 1406–1422. doi:10.1111/gcbb.12426. ISSN 1757-1693.
- Gasparatos, Alexandros; Doll, Christopher N.H.; Esteban, Miguel; Ahmed, Abubakari; Olang, Tabitha A. (2017). "Renewable energy and biodiversity: Implications for transitioning to a Green Economy". Renewable and Sustainable Energy Reviews. Elsevier BV. 70: 161–184. doi:10.1016/j.rser.2016.08.030. ISSN 1364-0321.
- Shikangalah, Rosemary; Mapani, Benjamin (2020-07-01). "A Review of Bush Encroachment in Namibia: From a Problem to an Opportunity?". Journal of Rangeland Science. 10 (3): 251–266. ISSN 2008-9996. Retrieved 2021-06-15.
External links[]
| Look up biomass in Wiktionary, the free dictionary. |
| Wikimedia Commons has media related to Biomass. |
- Biomass interactive by PBL Netherlands Environmental Assessment Agency
- Forest, Nature and Biomass
- Mansoori, G. Ali; Enayati, Nader; Agyarko, L. Barnie (2015). Energy: Sources, Utilization, Legislation, Sustainability, Illinois As Model State. World Scientific. doi:10.1142/9699. ISBN 978-981-4704-02-1.
- "All Solid biomass barometers Archives". EurObserv'ER.
| show Authority control |
|---|
- Biomass
- Renewable energy
- Bioenergy
- Sustainable energy