Carbon dioxide in Earth's atmosphere

Carbon dioxide (CO
2) is an important trace gas in Earth's atmosphere. It is an integral part of the carbon cycle, a biogeochemical cycle in which carbon is exchanged between the Earth's oceans, soil, rocks and the biosphere. Plants and other photoautotrophs use solar energy to produce carbohydrate from atmospheric carbon dioxide and water by photosynthesis. Almost all other organisms depend on carbohydrate derived from photosynthesis as their primary source of energy and carbon compounds. CO
2 absorbs and emits infrared radiation at wavelengths of 4.26 μm (2347 cm−1) (asymmetric stretching vibrational mode) and 14.99 μm (667 cm−1) (bending vibrational mode) and consequently is a greenhouse gas that plays a significant role in influencing Earth's surface temperature through the greenhouse effect.[1]
Concentrations of CO
2 in the atmosphere were as high as 4,000 parts per million (ppm, on a molar basis) during the Cambrian period about 500 million years ago to as low as 180 ppm during the Quaternary glaciation of the last two million years.[2] Reconstructed temperature records for the last 420 million years indicate that atmospheric CO
2 concentrations peaked at ~2000 ppm during the Devonian (∼400 Myrs ago) period, and again in the Triassic (220–200 Myrs ago) period. Global annual mean CO
2 concentration has increased by 50% since the start of the Industrial Revolution, from 280 ppm during the 10,000 years up to the mid-18th century[2] to 420 ppm as of April 2021.[3] The present concentration is the highest for 14 million years.[4] The increase has been attributed to human activity, particularly deforestation and the burning of fossil fuels.[5] This increase of CO
2 and other long-lived greenhouse gases in Earth's atmosphere has produced the current episode of global warming. Between 30% and 40% of the CO
2 released by humans into the atmosphere dissolves into the oceans,[6][7] wherein it forms carbonic acid and effects changes in the oceanic pH balance.
Current concentration[]


Carbon dioxide concentrations have shown several cycles of variation from about 180 parts per million during the deep glaciations of the Holocene and Pleistocene to 280 parts per million during the interglacial periods. Following the start of the Industrial Revolution, atmospheric CO
2 concentration increased to over 400 parts per million and continues to increase, causing the phenomenon of global warming.[8] As of April 2019, the average monthly level of CO
2 in Earth's atmosphere exceeded 413 parts per million.[9] The daily average concentration of atmospheric CO
2 at Mauna Loa Observatory first exceeded 400 ppm on 10 May 2013[10][11] although this concentration had already been reached in the Arctic in June 2012.[12] Each part per million by volume of CO
2 in the atmosphere represents approximately 2.13 gigatonnes of carbon, or 7.82 gigatonnes of CO
2.[13] As of 2018, CO
2 constitutes about 0.041% by volume of the atmosphere, (equal to 410 ppm)[14][15][16][17][18] which corresponds to approximately 3210 gigatonnes of CO
2, containing approximately 875 gigatonnes of carbon. The global mean CO
2 concentration is currently rising at a rate of approximately 2 ppm/year and accelerating.[14][19] The current growth rate at Mauna Loa is 2.50 ± 0.26 ppm/year (mean ± 2 std dev).[20] As seen in the graph to the right, there is an annual fluctuation – the level drops by about 6 or 7 ppm (about 50 Gt) from May to September during the Northern Hemisphere's growing season, and then goes up by about 8 or 9 ppm. The Northern Hemisphere dominates the annual cycle of CO
2 concentration because it has much greater land area and plant biomass than the Southern Hemisphere. Concentrations reach a peak in May as the Northern Hemisphere spring greenup begins, and decline to a minimum in October, near the end of the growing season.[20][21]
Since global warming is attributed to increasing atmospheric concentrations of greenhouse gases such as CO
2 and methane, scientists closely monitor atmospheric CO
2 concentrations and their impact on the present-day biosphere. The National Geographic wrote that the concentration of carbon dioxide in the atmosphere is this high "for the first time in 55 years of measurement—and probably more than 3 million years of Earth history."[22] The current concentration may be the highest in the last 20 million years.[23]
Past concentration[]

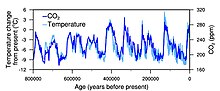
2 concentrations over the last 800,000 years

2 over the last 40,000 years, from the Last Glacial Maximum to the present day. The current rate of increase is much higher than at any point during the last deglaciation.
Carbon dioxide concentrations have varied widely over the Earth's 4.54 billion year history. It is believed to have been present in Earth's first atmosphere, shortly after Earth's formation. The second atmosphere, consisting largely of nitrogen and CO
2 was produced by outgassing from volcanism, supplemented by gases produced during the late heavy bombardment of Earth by huge asteroids.[24] A major part of carbon dioxide emissions were soon dissolved in water and incorporated in carbonate sediments.
The production of free oxygen by cyanobacterial photosynthesis eventually led to the oxygen catastrophe that ended Earth's second atmosphere and brought about the Earth's third atmosphere (the modern atmosphere) 2.4 billion years before the present. Carbon dioxide concentrations dropped from 4,000 parts per million during the Cambrian period about 500 million years ago to as low as 180 parts per million during the Quaternary glaciation of the last two million years.[2]
Drivers of ancient-Earth CO2 concentration[]
On long timescales, atmospheric CO
2 concentration is determined by the balance among geochemical processes including organic carbon burial in sediments, silicate rock weathering, and volcanic degassing. The net effect of slight imbalances in the carbon cycle over tens to hundreds of millions of years has been to reduce atmospheric CO
2. On a timescale of billions of years, such downward trend appears bound to continue indefinitely as occasional massive historical releases of buried carbon due to volcanism will become less frequent (as earth mantle cooling and progressive exhaustion of internal radioactive heat proceed further). The rates of these processes are extremely slow; hence they are of no relevance to the atmospheric CO
2 concentration over the next hundreds or thousands of years.
In billion-year timescales, it is predicted that plant, and therefore animal, life on land will die off altogether, since by that time most of the remaining carbon in the atmosphere will be sequestered underground, and natural releases of CO
2 by radioactivity-driven tectonic activity will have continued to slow down.[25][better source needed] The loss of plant life would also result in the eventual loss of oxygen. Some microbes are capable of photosynthesis at concentrations of CO
2 of a few parts per million and so the last life forms would probably disappear finally due to the rising temperatures and loss of the atmosphere when the sun becomes a red giant some four billion years from now.[26]
Measuring ancient-Earth CO2 concentration[]
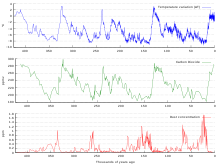
2 during the last 800,000 years
The most direct method for measuring atmospheric carbon dioxide concentrations for periods before instrumental sampling is to measure bubbles of air (fluid or gas inclusions) trapped in the Antarctic or Greenland ice sheets. The most widely accepted of such studies come from a variety of Antarctic cores and indicate that atmospheric CO
2 concentrations were about 260–280 ppmv immediately before industrial emissions began and did not vary much from this level during the preceding 10,000 years.[27] The longest ice core record comes from East Antarctica, where ice has been sampled to an age of 800,000 years.[28] During this time, the atmospheric carbon dioxide concentration has varied between 180 and 210 ppm during ice ages, increasing to 280–300 ppm during warmer interglacials.[29][30] The beginning of human agriculture during the current Holocene epoch may have been strongly connected to the atmospheric CO
2 increase after the last ice age ended, a fertilization effect raising plant biomass growth and reducing stomatal conductance requirements for CO
2 intake, consequently reducing transpiration water losses and increasing water usage efficiency.[31]
Various proxy measurements have been used to attempt to determine atmospheric carbon dioxide concentrations millions of years in the past. These include boron and carbon isotope ratios in certain types of marine sediments, and the number of stomata observed on fossil plant leaves.[32]
Phytane is a type of diterpenoid alkane. It is a breakdown product of chlorophyll and is now used to estimate ancient CO
2 levels.[33] Phytane gives both a continuous record of CO
2 concentrations but it also can overlap a break in the CO
2 record of over 500 million years.[33]
There is evidence for high CO
2 concentrations between 200 and 150 million years ago of over 3,000 ppm, and between 600 and 400 million years ago of over 6,000 ppm.[23] In more recent times, atmospheric CO
2 concentration continued to fall after about 60 million years ago. About 34 million years ago, the time of the Eocene–Oligocene extinction event and when the Antarctic ice sheet started to take its current form, CO
2 was about 760 ppm,[34] and there is geochemical evidence that concentrations were less than 300 ppm by about 20 million years ago. Decreasing CO
2 concentration, with a tipping point of 600 ppm, was the primary agent forcing Antarctic glaciation.[35] Low CO
2 concentrations may have been the stimulus that favored the evolution of C4 plants, which increased greatly in abundance between 7 and 5 million years ago.[32] Based on an analysis of fossil leaves, Wagner et al.[36] argued that atmospheric CO
2 concentrations during the last 7,000–10,000 year period were significantly higher than 300 ppm and contained substantial variations that may be correlated to climate variations. Others have disputed such claims, suggesting they are more likely to reflect calibration problems than actual changes in CO
2.[37] Relevant to this dispute is the observation that Greenland ice cores often report higher and more variable CO
2 values than similar measurements in Antarctica. However, the groups responsible for such measurements (e.g. H.J. Smith et al.[38]) believe the variations in Greenland cores result from in situ decomposition of calcium carbonate dust found in the ice. When dust concentrations in Greenland cores are low, as they nearly always are in Antarctic cores, the researchers report good agreement between measurements of Antarctic and Greenland CO
2 concentrations.
Atmospheric CO2 and the greenhouse effect[]
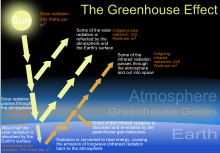
Earth's natural greenhouse effect makes life as we know it possible and carbon dioxide plays a significant role in providing for the relatively high temperature that the planet enjoys. The greenhouse effect is a process by which thermal radiation from a planetary atmosphere warms the planet's surface beyond the temperature it would have in the absence of its atmosphere.[39][40][41] Without the greenhouse effect, the Earth's average surface temperature would be about −18 °C (−0.4 °F)[42][43] compared to Earth's actual average surface temperature of approximately 14 °C (57.2 °F).[44]
Carbon dioxide is believed to have played an important effect in regulating Earth's temperature throughout its 4.7 billion year history. Early in the Earth's life, scientists have found evidence of liquid water indicating a warm world even though the Sun's output is believed to have only been 70% of what it is today. It has been suggested by scientists that higher carbon dioxide concentrations in the early Earth's atmosphere might help explain this faint young sun paradox. When Earth first formed, Earth's atmosphere may have contained more greenhouse gases and CO
2 concentrations may have been higher, with estimated partial pressure as large as 1,000 kPa (10 bar), because there was no bacterial photosynthesis to reduce the gas to carbon compounds and oxygen. Methane, a very active greenhouse gas which reacts with oxygen to produce CO
2 and water vapor, may have been more prevalent as well, with a mixing ratio of 10−4 (100 parts per million by volume).[45][46]

Though water is responsible for most (about 36-70%) of the total greenhouse effect, the role of water vapor as a greenhouse gas depends on temperature. On Earth, carbon dioxide is the most relevant, direct anthropologically influenced greenhouse gas. Carbon dioxide is often mentioned in the context of its increased influence as a greenhouse gas since the pre-industrial (1750) era. In the IPCC Fifth Assessment Report the increase in CO2 was estimated to be responsible for 1.82 W m−2 of the 2.63 W m−2 change in radiative forcing on Earth (about 70%).[47]
The concept of atmospheric CO2 increasing ground temperature was first published by Svante Arrhenius in 1896.[48] The increased radiative forcing due to increased CO2 in the Earth's atmosphere is based on the physical properties of CO2 and the non-saturated absorption windows where CO2 absorbs outgoing long-wave energy. The increased forcing drives further changes in Earth's energy balance and, over the longer term, in Earth's climate.[47]
Atmospheric CO2 and the carbon cycle[]
Atmospheric carbon dioxide plays an integral role in the Earth's carbon cycle whereby CO
2 is removed from the atmosphere by some natural processes such as photosynthesis and deposition of carbonates, to form limestones for example, and added back to the atmosphere by other natural processes such as respiration and the acid dissolution of carbonate deposits. There are two broad carbon cycles on Earth: the fast carbon cycle and the slow carbon cycle. The fast carbon cycle refers to movements of carbon between the environment and living things in the biosphere whereas the slow carbon cycle involves the movement of carbon between the atmosphere, oceans, soil, rocks, and volcanism. Both cycles are intrinsically interconnected and atmospheric CO
2 facilitates the linkage.
Natural sources of atmospheric CO
2 include volcanic outgassing, the combustion of organic matter, wildfires and the respiration processes of living aerobic organisms. Man-made sources of CO
2 include the burning of fossil fuels for heating, power generation and transport, as well as some industrial processes such as cement making. It is also produced by various microorganisms from fermentation and cellular respiration. Plants, algae and cyanobacteria convert carbon dioxide to carbohydrates by a process called photosynthesis. They gain the energy needed for this reaction from absorption of sunlight by chlorophyll and other pigments. Oxygen, produced as a by-product of photosynthesis, is released into the atmosphere and subsequently used for respiration by heterotrophic organisms and other plants, forming a cycle with carbon.
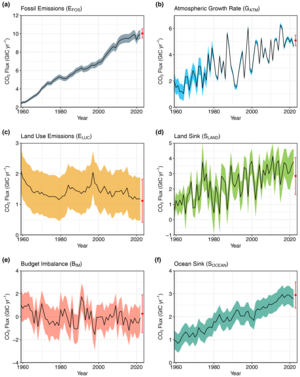
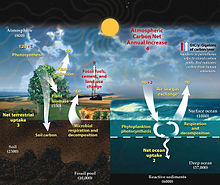
2 flows from anthropogenic sources (left) into Earth's atmosphere, land, and ocean sinks (right) since year 1960. Units in equivalent gigatonnes carbon per year.[50]
Most sources of CO
2 emissions are natural, and are balanced to various degrees by similar CO
2 sinks. For example, the decay of organic material in forests, grasslands, and other land vegetation - including forest fires - results in the release of about 436 gigatonnes of CO
2 (containing 119 gigatonnes carbon) every year, while CO
2 uptake by new growth on land counteracts these releases, absorbing 451 Gt (123 Gt C).[51] Although much CO
2 in the early atmosphere of the young Earth was produced by volcanic activity, modern volcanic activity releases only 130 to 230 megatonnes of CO
2 each year.[52] Natural sources are more or less balanced by natural sinks, in the form of chemical and biological processes which remove CO
2 from the atmosphere. By contrast, as of year 2019 the extraction and burning of geologic fossil carbon by humans releases over 30 gigatonnes of CO
2 (9 billion tonnes carbon) each year.[50] This larger disruption to the natural balance is responsible for recent growth in the atmospheric CO
2 concentration.[16][53]
Overall, there is a large natural flux of atmospheric CO
2 into and out of the biosphere, both on land and in the oceans.[54] In the pre-industrial era, each of these fluxes were in balance to such a degree that little net CO
2 flowed between the land and ocean reservoirs of carbon, and little change resulted in the atmospheric concentration. From the human pre-industrial era to 1940, the terrestrial biosphere represented a net source of atmospheric CO
2 (driven largely by land-use changes), but subsequently switched to a net sink with growing fossil carbon emissions.[55] In 2012, about 57% of human-emitted CO
2, mostly from the burning of fossil carbon, was taken up by land and ocean sinks.[56][55]
The ratio of the increase in atmospheric CO
2 to emitted CO
2 is known as the airborne fraction (Keeling et al., 1995). This ratio varies in the short-term and is typically about 45% over longer (5-year) periods.[55] Estimated carbon in global terrestrial vegetation increased from approximately 740 gigatonnes in 1910 to 780 gigatonnes in 1990.[57] By 2009, oceanic neutralization had decreased the pH of seawater by 0.11 due to uptake of emitted CO
2.[58]
Atmospheric CO2 and photosynthesis[]
−4500 — – — – −4000 — – — – −3500 — – — – −3000 — – — – −2500 — – — – −2000 — – — – −1500 — – — – −1000 — – — – −500 — – — – 0 — | Water P l a n t s Arthropods Molluscs Flowers Mammals Birds Primates |
| ||||||||||||||||||||||||||||||||||||||||||
(million years ago) | ||||||||||||||||||||||||||||||||||||||||||||
Carbon dioxide in the Earth's atmosphere is essential to life and to most of the planetary biosphere. Over the course of Earth's geologic history CO
2 concentrations have played a role in biological evolution. The first photosynthetic organisms probably evolved early in the evolutionary history of life and most likely used reducing agents such as hydrogen or hydrogen sulfide as sources of electrons, rather than water.[59] Cyanobacteria appeared later, and the excess oxygen they produced contributed to the oxygen catastrophe,[60] which rendered the evolution of complex life possible. In recent geologic times, low CO
2 concentrations below 600 parts per million might have been the stimulus that favored the evolution of C4 plants which increased greatly in abundance between 7 and 5 million years ago over plants that use the less efficient C3 metabolic pathway.[32] At current atmospheric pressures photosynthesis shuts down when atmospheric CO
2 concentrations fall below 150 ppm and 200 ppm although some microbes can extract carbon from the air at much lower concentrations.[61][62] Today, the average rate of energy capture by photosynthesis globally is approximately 130 terawatts,[63][64][65] which is about six times larger than the current power consumption of human civilization.[66] Photosynthetic organisms also convert around 100–115 billion metric tonnes of carbon into biomass per year.[67][68]
Photosynthetic organisms are photoautotrophs, which means that they are able to synthesize food directly from CO
2 and water using energy from light. However, not all organisms that use light as a source of energy carry out photosynthesis, since photoheterotrophs use organic compounds, rather than CO
2, as a source of carbon.[69] In plants, algae and cyanobacteria, photosynthesis releases oxygen. This is called oxygenic photosynthesis. Although there are some differences between oxygenic photosynthesis in plants, algae, and cyanobacteria, the overall process is quite similar in these organisms. However, there are some types of bacteria that carry out anoxygenic photosynthesis, which consumes CO
2 but does not release oxygen.
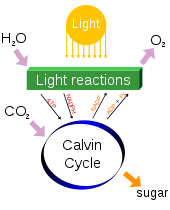
Carbon dioxide is converted into sugars in a process called carbon fixation. Carbon fixation is an endothermic redox reaction, so photosynthesis needs to supply both the source of energy to drive this process and the electrons needed to convert CO
2 into a carbohydrate. This addition of the electrons is a reduction reaction. In general outline and in effect, photosynthesis is the opposite of cellular respiration, in which glucose and other compounds are oxidized to produce CO
2 and water, and to release exothermic chemical energy to drive the organism's metabolism. However, the two processes take place through a different sequence of chemical reactions and in different cellular compartments.
Most organisms that utilize photosynthesis to produce oxygen use visible light to do so, although at least three use shortwave infrared or, more specifically, far-red radiation.[70]
Effects of increased CO2 on plants and crops[]
A 1993 review of scientific greenhouse studies found that a doubling of CO
2 concentration would stimulate the growth of 156 different plant species by an average of 37%. Response varied significantly by species, with some showing much greater gains and a few showing a loss. For example, a 1979 greenhouse study found that with doubled CO
2 concentration the dry weight of 40-day-old cotton plants doubled, but the dry weight of 30-day-old maize plants increased by only 20%.[71][72]
In addition to greenhouse studies, field and satellite measurements attempt to understand the effect of increased CO
2 in more natural environments. In free-air carbon dioxide enrichment (FACE) experiments plants are grown in field plots and the CO
2 concentration of the surrounding air is artificially elevated. These experiments generally use lower CO
2 levels than the greenhouse studies. They show lower gains in growth than greenhouse studies, with the gains depending heavily on the species under study. A 2005 review of 12 experiments at 475–600 ppm showed an average gain of 17% in crop yield, with legumes typically showing a greater response than other species and C4 plants generally showing less. The review also stated that the experiments have their own limitations. The studied CO
2 levels were lower, and most of the experiments were carried out in temperate regions.[73] Satellite measurements found increasing leaf area index for 25% to 50% of Earth's vegetated area over the past 35 years (i.e., a greening of the planet), providing evidence for a positive CO2 fertilization effect.[74][75]
A 2017 Politico article states that increased CO
2 levels may have a negative impact on the nutritional quality of various human food crops, by increasing the levels of carbohydrates, such as glucose, while decreasing the levels of important nutrients such as protein, iron, and zinc. Crops experiencing a decrease in protein include rice, wheat, barley and potatoes.[76][scientific citation needed]
Atmospheric CO2 and the oceanic carbon cycle[]
2
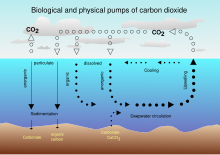
The Earth's oceans contain a large amount of CO
2 in the form of bicarbonate and carbonate ions—much more than the amount in the atmosphere. The bicarbonate is produced in reactions between rock, water, and carbon dioxide. One example is the dissolution of calcium carbonate:
- CaCO
3 + CO
2 + H
2O ⇌ Ca2+
+ 2 HCO−
3
Reactions like this tend to buffer changes in atmospheric CO
2. Since the right side of the reaction produces an acidic compound, adding CO
2 on the left side decreases the pH of seawater, a process which has been termed ocean acidification (pH of the ocean becomes more acidic although the pH value remains in the alkaline range). Reactions between CO
2 and non-carbonate rocks also add bicarbonate to the seas. This can later undergo the reverse of the above reaction to form carbonate rocks, releasing half of the bicarbonate as CO
2. Over hundreds of millions of years, this has produced huge quantities of carbonate rocks.
Ultimately, most of the CO
2 emitted by human activities will dissolve in the ocean;[77] however, the rate at which the ocean will take it up in the future is less certain.
Even if equilibrium is reached, including dissolution of carbonate minerals, the increased concentration of bicarbonate and decreased or unchanged concentration of carbonate ion will give rise to a higher concentration of un-ionized carbonic acid and dissolved CO
2. This higher concentration in the seas, along with higher temperatures, would mean a higher equilibrium concentration of CO
2 in the air.[78][79]
Carbon dioxide has unique long-term effects on climate change that are nearly "irreversible" for a thousand years after emissions stop (zero further emissions). The greenhouse gases methane and nitrous oxide do not persist over time in the same way as carbon dioxide. Even if human carbon dioxide emissions were to completely cease, atmospheric temperatures are not expected to decrease significantly in the short term. This is because the air temperature is determined by a balance between heating, due to greenhouse gases, and cooling due to heat transfer to the ocean. If emissions were to stop, CO
2 levels and the heating effect would slowly decrease, but simultaneously the cooling due to heat transfer would diminish (because sea temperatures would get closer to the air temperature), with the result that the air temperature would decrease only slowly. Sea temperatures would continue to rise, causing thermal expansion and some sea level rise.[78] Lowering global temperatures more rapidly would require carbon sequestration or geoengineering.
Carbon moves between the atmosphere, vegetation (dead and alive), the soil, the surface layer of the ocean, and the deep ocean. A detailed model has been developed by in Bern and colleagues, called the Bern model.[80]
A simpler model based on it gives the fraction of CO
2 remaining in the atmosphere as a function of the number of years after it is emitted into the atmosphere:[81]

According to this model, 21.7% of the carbon dioxide released into the air stays there forever, but of course this is not true if carbon-containing material is removed from the cycle (and stored) in ways that are not operative at present (artificial sequestration).
Anthropogenic CO2 emissions[]

While CO
2 absorption and release is always happening as a result of natural processes, the recent rise in CO
2 levels in the atmosphere is known to be mainly due to human (anthropogenic) activity.[85] There are four ways human activity, especially fossil fuel burning, is known to have caused the rapid increase in atmospheric CO
2 over the last few centuries:
- Various national statistics accounting for fossil fuel consumption, combined with knowledge of how much atmospheric CO
2 is produced per unit of fossil fuel (e.g. liter of gasoline).[86] - By examining the ratio of various carbon isotopes in the atmosphere.[85] The burning of long-buried fossil fuels releases CO
2 containing carbon of different isotopic ratios to those of living plants, enabling distinction between natural and human-caused contributions to CO
2 concentration. - Higher atmospheric CO
2 concentrations in the Northern Hemisphere, where most of the world's population lives (and emissions originate from), compared to the southern hemisphere. This difference has increased as anthropogenic emissions have increased.[87] - Atmospheric O2 levels are decreasing in Earth's atmosphere as it reacts with the carbon in fossil fuels to form CO
2.[88]
Burning fossil fuels such as coal, petroleum, and natural gas is the leading cause of increased anthropogenic CO
2; deforestation is the second major cause. In 2010, 9.14 gigatonnes of carbon (GtC, equivalent to 33.5 gigatonnes of CO
2 or about 4.3 ppm in Earth's atmosphere) were released from fossil fuels and cement production worldwide, compared to 6.15 GtC in 1990.[89] In addition, land use change contributed 0.87 GtC in 2010, compared to 1.45 GtC in 1990.[89] In 1997, human-caused Indonesian peat fires were estimated to have released between 13% and 40% of the average annual global carbon emissions caused by the burning of fossil fuels.[90][91][92] In the period 1751 to 1900, about 12 GtC were released as CO
2 to the atmosphere from burning of fossil fuels, whereas from 1901 to 2013 the figure was about 380 GtC.[93]
| Part of a series on the |
| Carbon cycle |
|---|
 |
The Integrated Carbon Observation System (ICOS) continuously releases data about CO
2 emissions, budget and concentration at individual observation stations.
| Year | Fossil fuels and industry Gt C |
Land use change Gt C |
Total Gt C |
Total Gt CO 2 |
|---|---|---|---|---|
| 2010 | 9.05 | 1.38 | 10.43 | 38.2 |
| 2011 | 9.35 | 1.34 | 10.69 | 39.2 |
| 2012 | 9.5 | 1.47 | 10.97 | 40.3 |
| 2013 | 9.54 | 1.52 | 11.06 | 40.6 |
| 2014 | 9.61 | 1.66 | 11.27 | 41.4 |
| 2015 | 9.62 | 1.7 | 11.32 | 41.5 |
| 2016 | 9.66 | 1.54 | 11.2 | 41.1 |
| 2017 | 9.77 | 1.47 | 11.24 | 41.3 |
| 2018 | 9.98 | 1.51 | 11.49 | 42.1 |
| 2019 (projection) |
10.0 | 1.8 | 11.8 | 43.1 |
Anthropogenic carbon emissions exceed the amount that can be taken up or balanced out by natural sinks.[96] As a result, carbon dioxide has gradually accumulated in the atmosphere, and as of 2019, its concentration is almost 48% above pre-industrial levels.[11] Various techniques have been proposed for removing excess carbon dioxide from the atmosphere (see Carbon sink#Artificial sequestration). Currently about half of the carbon dioxide released from the burning of fossil fuels is not absorbed by vegetation and the oceans and remains in the atmosphere.[97]
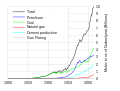
Global fossil carbon emissions 1800–2014
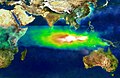
False-color image of smoke and ozone pollution from Indonesian fires, 1997
Biosphere CO
2 flux in the northern hemisphere winter (NOAA Carbon Tracker)
Biosphere CO
2 flux in the northern hemisphere summer (NOAA Carbon Tracker)


Ongoing measurements of atmospheric CO2[]

The first reproducibly accurate measurements of atmospheric CO2 were from flask sample measurements made by Dave Keeling at Caltech in the 1950s.[98] A few years later in March 1958 the first ongoing measurements were started by Keeling at Mauna Loa. Measurements at Mauna Loa have been ongoing since then. Now measurements are made at many sites globally. Additional measurement techniques are also used as well. Many measurement sites are part of larger global networks. Global network data are often made publicly available on the conditions of proper acknowledgment according to the respective data user policies.
There are several surface measurement (including flasks and continuous in situ) networks including NOAA/ERSL,[99] WDCGG,[100] and RAMCES.[101] The NOAA/ESRL Baseline Observatory Network, and the Scripps Institution of Oceanography Network[102] data are hosted at the CDIAC at ORNL. The World Data Centre for Greenhouse Gases (WDCGG), part of GAW, data are hosted by the JMA. The Reseau Atmospherique de Mesure des Composes an Effet de Serre database (RAMCES) is part of IPSL.
From these measurements, further products are made which integrate data from the various sources. These products also address issues such as data discontinuity and sparseness. GLOBALVIEW-CO2 is one of these products.[103]
Ongoing ground-based total column measurements began more recently. Column measurements typically refer to an averaged column amount denoted XCO2, rather than a surface only measurement. These measurements are made by the TCCON. These data are also hosted on the CDIAC, and made publicly available according to the data use policy.[104]
Satellite measurements are also a recent addition to atmospheric XCO2 measurements. SCIAMACHY aboard ESA's ENVISAT made global column XCO2 measurements from 2002 to 2012. AIRS aboard NASA's Aqua satellite makes global XCO2 measurements and was launched shortly after ENVISAT in 2012. More recent satellites have significantly improved the data density and precision of global measurements. Newer missions have higher spectral and spatial resolutions. JAXA's GOSAT was the first dedicated GHG monitoring satellite to successfully achieve orbit in 2009. NASA's OCO-2 launched in 2014 was the second. Various other satellites missions to measure atmospheric XCO2 are planned.
See also[]
- Carbon cycle
- Global temperature record
- Keeling Curve - a graph of the accumulation of carbon dioxide in the Earth's atmosphere based on measurements taken in Hawaii
References[]
- ^ Petty, G.W. (2004). "A First Course in Atmospheric Radiation". Eos Transactions. 85 (36): 229–51. Bibcode:2004EOSTr..85..341P. doi:10.1029/2004EO360007.
- ^ Jump up to: a b c Eggleton, Tony (2013). A Short Introduction to Climate Change. Cambridge University Press. p. 52. ISBN 9781107618763.
- ^ Bressan, David. "Carbon-Dioxide In Earth's Atmosphere Spikes To Record Level". Forbes. Retrieved 15 April 2021.
- ^ Zhang, Yi Ge; et al. (28 October 2013). "A 40-million-year history of atmospheric CO2". Philosophical Transactions of the Royal Society A. 371 (2001): 20130096. Bibcode:2013RSPTA.37130096Z. doi:10.1098/rsta.2013.0096. PMID 24043869.
- ^ Etheridge, D.M.; L.P. Steele; R.L. Langenfelds; R.J. Francey; J.-M. Barnola; V.I. Morgan (1996). "Natural and anthropogenic changes in atmospheric CO
2 over the last 1000 years from air in Antarctic ice and firn". Journal of Geophysical Research. 101 (D2): 4115–28. Bibcode:1996JGR...101.4115E. doi:10.1029/95JD03410. ISSN 0148-0227. - ^ Millero, Frank J. (1995). "Thermodynamics of the carbon dioxide system in the oceans". Geochimica et Cosmochimica Acta. 59 (4): 661–77. Bibcode:1995GeCoA..59..661M. doi:10.1016/0016-7037(94)00354-O.
- ^ Feely, R.A.; et al. (July 2004). "Impact of Anthropogenic CO2 on the CaCO3 System in the Oceans". Science. 305 (5682): 362–66. Bibcode:2004Sci...305..362F. doi:10.1126/science.1097329. PMID 15256664. S2CID 31054160.
- ^ IPCC AR5 WG1 (2013), Stocker, T.F.; et al. (eds.), Climate Change 2013: The Physical Science Basis. Working Group 1 (WG1) Contribution to the Intergovernmental Panel on Climate Change (IPCC) 5th Assessment Report (AR5), Cambridge University Press Climate Change 2013 Working Group 1 website.
- ^ https://www.co2.earth/
- ^ "Carbon dioxide passes symbolic mark". BBC. 10 May 2013. Retrieved 10 May 2013.
- ^ Jump up to: a b "Up-to-date weekly average CO
2 at Mauna Loa". NOAA. Retrieved 1 June 2019. - ^ "Greenhouse gas levels pass symbolic 400ppm CO
2 milestone". The Guardian. Associated Press. 1 June 2012. Retrieved 11 May 2013. - ^ "Conversion Tables". Carbon Dioxide Information Analysis Center. Oak Ridge National Laboratory. 18 July 2020. Archived from the original on 27 September 2017. Retrieved 18 July 2020. Alt URL
- ^ Jump up to: a b Tans, Pieter. "Trends in Carbon Dioxide". NOAA/ESRL. Retrieved 11 December 2009.
- ^ "Just CO2unting..." Archived from the original on 18 February 2010.
- ^ Jump up to: a b "Trends in Atmospheric Carbon Dioxide". Earth System Research Laboratory. NOAA.
- ^ Vaughan, A (6 May 2015). "Global carbon dioxide levels break 400ppm milestone". The Guardian. Retrieved 7 May 2015.
- ^ Dlugokencky, E; Tans, P (6 May 2015). "ESRL Global Monitoring Division". Earth System Research Laboratory. NOAA. Retrieved 7 May 2015.
- ^ "Carbon Budget 2009 Highlights". globalcarbonproject.org. Archived from the original on 16 December 2011. Retrieved 2 November 2012.
- ^ Jump up to: a b Rasmussen, Carl Edward. "Atmospheric Carbon Dioxide Growth Rate".
- ^ "Frequently Asked Questions". Carbon Dioxide Information Analysis Center (CDIAC). Archived from the original on 17 August 2011. Retrieved 13 June 2007.
- ^ Kunzig, Robert (9 May 2013). "Climate Milestone: Earth's CO
2 Level Passes 400 ppm". National Geographic. Retrieved 12 May 2013. - ^ Jump up to: a b IPCC: Climate Change 2001: The Scientific Basis
- ^ Zahnle, K.; Schaefer, L.; Fegley, B. (2010). "Earth's Earliest Atmospheres". Cold Spring Harbor Perspectives in Biology. 2 (10): a004895. doi:10.1101/cshperspect.a004895. PMC 2944365. PMID 20573713.
- ^ Ward, Peter D.; Brownlee, Donald (2003). The life and death of planet Earth. Macmillan. pp. 117–28. ISBN 978-0-8050-7512-0.
- ^ Caldeira, Ken; Kasting, James F. (December 1992). "The life span of the biosphere revisited". Nature. 360 (6406): 721–23. Bibcode:1992Natur.360..721C. doi:10.1038/360721a0. PMID 11536510. S2CID 4360963.
- ^ Etheridge, D.M.; Steele, L.P.; Langenfelds, R.L.; Francey, R.J.; Barnola, JM; Morgan, VI (June 1998). "Historical CO
2 record derived from a spline fit (20-year cutoff) of the Law Dome DE08 and DE08-2 ice cores". Carbon Dioxide Information Analysis Center. Oak Ridge National Laboratory. Archived from the original on 12 July 2012. Retrieved 12 June 2007. - ^ Amos, J. (4 September 2006). "Deep ice tells long climate story". BBC News. Retrieved 28 April 2010.
- ^ Hileman B. (November 2005). "Ice Core Record Extended: Analyses of trapped air show current CO
2 at highest level in 650,000 years". Chemical & Engineering News. 83 (48): 7. doi:10.1021/cen-v083n048.p007. ISSN 0009-2347. - ^ Vostok Ice Core Data, ncdc.noaa.gov
- ^ Richerson P.J.; Boyd R.; Bettinger R.L. (July 2001). "Was Agriculture Impossible During The Pleistocene But Mandatory During The Holocene?" (PDF). American Antiquity. 66 (3): 387–411. doi:10.2307/2694241. JSTOR 2694241. S2CID 163474968.
- ^ Jump up to: a b c Osborne, C.P.; Beerling, D.J. (2006). "Nature's green revolution: the remarkable evolutionary rise of C4 plants". Philosophical Transactions of the Royal Society B: Biological Sciences. 361 (1465): 173–94. doi:10.1098/rstb.2005.1737. PMC 1626541. PMID 16553316.
- ^ Jump up to: a b Witkowski, Caitlyn (28 November 2018). "Molecular fossils from phytoplankton reveal secular Pco2 trend over the Phanerozoic". Science Advances. 2 (11): eaat4556. Bibcode:2018SciA....4.4556W. doi:10.1126/sciadv.aat4556. PMC 6261654. PMID 30498776.
- ^ "New CO
2 data helps unlock the secrets of Antarctic formation". Physorg.com. 13 September 2009. - ^ Pagani, Mark; Huber, Matthew; Liu, Zhonghui; Bohaty, Steven M.; Henderiks, Jorijntje; Sijp, Willem; Krishnan, Srinath; Deconto, Robert M. (2 December 2011). "Drop in carbon dioxide levels led to polar ice sheet, study finds". Science. 334 (6060): 1261–4. Bibcode:2011Sci...334.1261P. doi:10.1126/science.1203909. PMID 22144622. S2CID 206533232. Retrieved 14 May 2013.
- ^ Wagner, Friederike; Bent Aaby; Henk Visscher (2002). "Rapid atmospheric O
2 changes associated with the 8,200-years-B.P. cooling event". Proc. Natl. Acad. Sci. USA. 99 (19): 12011–14. Bibcode:2002PNAS...9912011W. doi:10.1073/pnas.182420699. PMC 129389. PMID 12202744. - ^ Indermühle, Andreas; Bernhard Stauffer; Thomas F. Stocker (1999). "Early Holocene Atmospheric CO
2 Concentrations". Science. 286 (5446): 1815. doi:10.1126/science.286.5446.1815a. - ^ Smith, H.J.; M Wahlen; D. Mastroianni (1997). "The CO
2 concentration of air trapped in GISP2 ice from the Last Glacial Maximum-Holocene transition". Geophysical Research Letters. 24 (1): 1–4. Bibcode:1997GeoRL..24....1S. doi:10.1029/96GL03700. - ^ "Annex II Glossary". Intergovernmental Panel on Climate Change. Retrieved 15 October 2010.
- ^ A concise description of the greenhouse effect is given in the Intergovernmental Panel on Climate Change Fourth Assessment Report, "What is the Greenhouse Effect?" FAQ 1.3 – AR4 WGI Chapter 1: Historical Overview of Climate Change Science, IPCC Fourth Assessment Report, Chapter 1, p. 115: "To balance the absorbed incoming [solar] energy, the Earth must, on average, radiate the same amount of energy back to space. Because the Earth is much colder than the Sun, it radiates at much longer wavelengths, primarily in the infrared part of the spectrum (see Figure 1). Much of this thermal radiation emitted by the land and ocean is absorbed by the atmosphere, including clouds, and reradiated back to Earth. This is called the greenhouse effect."
Stephen H. Schneider, in Geosphere-biosphere Interactions and Climate, Lennart O. Bengtsson and Claus U. Hammer, eds., Cambridge University Press, 2001, ISBN 0-521-78238-4, pp. 90–91.
E. Claussen, V.A. Cochran, and D.P. Davis, Climate Change: Science, Strategies, & Solutions, University of Michigan, 2001. p. 373.
A. Allaby and M. Allaby, A Dictionary of Earth Sciences, Oxford University Press, 1999, ISBN 0-19-280079-5, p. 244. - ^ Vaclav Smil (2003). The Earth's Biosphere: Evolution, Dynamics, and Change. MIT Press. p. 107. ISBN 978-0-262-69298-4.
- ^ "Solar Radiation and the Earth's Energy Balance". The Climate System – EESC 2100 Spring 2007. Columbia University. Archived from the original on 4 November 2004. Retrieved 15 October 2010.
- ^ Le Treut H, Somerville R, Cubasch U, Ding Y, Mauritzen C, Mokssit A, Peterson T, Prather M (2007). "Historical Overview of Climate Change Science" (PDF). In Solomon S, Qin D, Manning M, Chen Z, Marquis M, Averyt KB, Tignor M, Miller HL (eds.). Climate Change 2007: The Physical Science Basis. Contribution of Working Group I to the Fourth Assessment Report of the Intergovernmental Panel on Climate Change. Cambridge, UK and New York, NY: Cambridge University Press. p. 97.
- ^ "The Elusive Absolute Surface Air Temperature (SAT)". Goddard Institute for Space Studies. NOAA.
- ^ Walker, James C.G. (June 1985). "Carbon dioxide on the early earth" (PDF). Origins of Life and Evolution of the Biosphere. 16 (2): 117–27. Bibcode:1985OrLi...16..117W. doi:10.1007/BF01809466. hdl:2027.42/43349. PMID 11542014. S2CID 206804461. Retrieved 30 January 2010.
- ^ Pavlov, Alexander A.; Kasting, James F.; Brown, Lisa L.; Rages, Kathy A.; Freedman, Richard (May 2000). "Greenhouse warming by CH4 in the atmosphere of early Earth". Journal of Geophysical Research. 105 (E5): 11981–90. Bibcode:2000JGR...10511981P. doi:10.1029/1999JE001134. PMID 11543544.
- ^ Jump up to: a b IPCC Fifth Assessment Report – Chapter 8: Anthropogenic and Natural Radiative Forcing. https://www.ipcc.ch/pdf/assessment-report/ar5/wg1/WG1AR5_Chapter08_FINAL.pdf
- ^ Arrhenius, Svante (1896). "On the influence of carbonic acid in the air upon the temperature of the ground" (PDF). Philosophical Magazine and Journal of Science: 237–76.
- ^ Riebeek, Holli (16 June 2011). "The Carbon Cycle". Earth Observatory. NASA. Archived from the original on 5 March 2016. Retrieved 5 April 2018.
- ^ Jump up to: a b Friedlingstein, P., Jones, M., O'Sullivan, M., Andrew, R., Hauck, J., Peters, G., Peters, W., Pongratz, J., Sitch, S., Le Quéré, C. and 66 others (2019) "Global carbon budget 2019". Earth System Science Data, 11(4): 1783–1838. doi:10.5194/essd-11-1783-2019.
 Material was copied from this source, which is available under a Creative Commons Attribution 4.0 International License.
- ^ Kayler, Z., Janowiak, M., Swanston, C. (2017). "The Global Carbon Cycle". Considering Forest and Grassland Carbon in Land Management (PDF). General Technical Report WTO-GTR-95. United States Department of Agriculture, Forest Service. pp. 3–9.CS1 maint: multiple names: authors list (link)
- ^ Gerlach, T.M. (4 June 1991). "Present-day CO
2 emissions from volcanoes". Eos, Transactions, American Geophysical Union. 72 (23): 249, 254–55. Bibcode:1991EOSTr..72..249.. doi:10.1029/90EO10192. - ^ Dlugokencky, E. (5 February 2016). "Annual Mean Carbon Dioxide Data". Earth System Research Laboratory. NOAA. Retrieved 12 February 2016.
- ^ Cappelluti, G.; Bösch, H.; Monks, P.S. (2009). Use of remote sensing techniques for the detection and monitoring of GHG emissions from the Scottish land use sector. Scottish Government. ISBN 978-0-7559-7738-3.
- ^ Jump up to: a b c Junling Huang; Michael B. McElroy (2012). "The Contemporary and Historical Budget of Atmospheric CO
2" (PDF). Canadian Journal of Physics. 90 (8): 707–16. Bibcode:2012CaJPh..90..707H. doi:10.1139/p2012-033. - ^ Canadell JG, Le Quéré C, Raupach MR, et al. (November 2007). "Contributions to accelerating atmospheric CO
2 growth from economic activity, carbon intensity, and efficiency of natural sinks". Proc. Natl. Acad. Sci. U.S.A. 104 (47): 18866–70. Bibcode:2007PNAS..10418866C. doi:10.1073/pnas.0702737104. PMC 2141868. PMID 17962418. - ^ Post WM, King AW, Wullschleger SD, Hoffman FM (June 1997). "Historical Variations in Terrestrial Biospheric Carbon Storage". DOE Research Summary. 34 (1): 99–109. Bibcode:1997GBioC..11...99P. doi:10.1029/96GB03942.
- ^ "Report of the Ocean Acidification and Oxygen Working Group, SCOR Biological Observatories Workshop" (PDF). scor-int.org/. International Council for Science's Scientific Committee on Ocean Research (SCOR). 30 September 2009.
- ^ Olson JM (May 2006). "Photosynthesis in the Archean era". Photosyn. Res. 88 (2): 109–17. doi:10.1007/s11120-006-9040-5. PMID 16453059. S2CID 20364747.
- ^ Buick R (August 2008). "When did oxygenic photosynthesis evolve?". Philos. Trans. R. Soc. Lond. B Biol. Sci. 363 (1504): 2731–43. doi:10.1098/rstb.2008.0041. PMC 2606769. PMID 18468984.
- ^ Lovelock, J. E. (1972). "Gaia as seen through the atmosphere". Atmospheric Environment. 6 (8): 579–580. Bibcode:1972AtmEn...6..579L. doi:10.1016/0004-6981(72)90076-5. Archived from the original on 3 November 2011. Retrieved 22 March 2014.
- ^ Li, K.-F. (30 May 2009). "Atmospheric pressure as a natural climate regulator for a terrestrial planet with a biosphere". Proceedings of the National Academy of Sciences. 106 (24): 9576–9579. Bibcode:2009PNAS..106.9576L. doi:10.1073/pnas.0809436106. PMC 2701016. PMID 19487662. Retrieved 22 March 2014.
- ^ Nealson KH, Conrad PG (December 1999). "Life: past, present and future". Philos. Trans. R. Soc. Lond. B Biol. Sci. 354 (1392): 1923–39. doi:10.1098/rstb.1999.0532. PMC 1692713. PMID 10670014.
- ^ Whitmarsh J, Govindjee (1999). "The photosynthetic process". In Singhal GS; Renger G; Sopory SK; Irrgang KD; Govindjee (eds.). Concepts in photobiology: photosynthesis and photomorphogenesis. Boston: Kluwer Academic Publishers. pp. 11–51. ISBN 978-0-7923-5519-9.
100 x 1015 grams of carbon/year fixed by photosynthetic organisms which is equivalent to 4 x 10¹⁸ kJ/yr = 4 x 10²¹J/yr of free energy stored as reduced carbon; (4 x 10¹⁸ kJ/yr) / (31,556,900 sec/yr) = 1.27 x 10¹⁴ J/yr; (1.27 x 10¹⁴ J/yr) / (1012 J/sec / TW) = 127 TW.
- ^ Steger U, Achterberg W, Blok K, Bode H, Frenz W, Gather C, Hanekamp G, Imboden D, Jahnke M, Kost M, Kurz R, Nutzinger HG, Ziesemer T (2005). Sustainable development and innovation in the energy sector. Berlin: Springer. p. 32. ISBN 978-3-540-23103-5.
The average global rate of photosynthesis is 130 TW (1 TW = 1 terawatt = 1012 watt).
- ^ "World Consumption of Primary Energy by Energy Type and Selected Country Groups, 1980–2004". Energy Information Administration. 31 July 2006. Archived from the original (XLS) on 9 November 2006. Retrieved 2007-01-20.
- ^ Field CB, Behrenfeld MJ, Randerson JT, Falkowski P (July 1998). "Primary production of the biosphere: integrating terrestrial and oceanic components". Science. 281 (5374): 237–40. Bibcode:1998Sci...281..237F. doi:10.1126/science.281.5374.237. PMID 9657713.
- ^ "Photosynthesis". McGraw-Hill Encyclopedia of Science & Technology. 13. New York: McGraw-Hill. 2007. ISBN 978-0-07-144143-8.
- ^ Bryant DA, Frigaard NU (November 2006). "Prokaryotic photosynthesis and phototrophy illuminated". Trends Microbiol. 14 (11): 488–96. doi:10.1016/j.tim.2006.09.001. PMID 16997562.
- ^ "Scientists discover unique microbe in California's largest lake". Retrieved 20 July 2009.
- ^ Poorter, Hendrik. "Interspecific variation in the growth response of plants to an elevated ambient CO2 concentration" (PDF).
- ^ Wong, S.C. (December 1979). "Elevated Partial Pressure of CO2 and Plant Growth". Oecologia. 44 (1): 68–74. Bibcode:1979Oecol..44...68W. doi:10.1007/BF00346400. PMID 28310466. S2CID 24541633.
- ^ Ainsworth, Lisa (February 2005). "What have we learned from 15 years of free-air CO2 enrichment (FACE)? A meta-analytic review of the responses of photosynthesis, canopy properties and plant production to rising CO2". New Phytol. 165 (2): 351–71. doi:10.1111/j.1469-8137.2004.01224.x. PMID 15720649.
- ^ Zhu, Zaichun; Piao, Shilong; Myneni, Ranga B.; Huang, Mengtian; Zeng, Zhenzhong; Canadell, Josep G.; Ciais, Philippe; Sitch, Stephen; Friedlingstein, Pierre (August 2016). "Greening of the Earth and its drivers". Nature Climate Change. 6 (8): 791–95. Bibcode:2016NatCC...6..791Z. doi:10.1038/nclimate3004. ISSN 1758-6798.
We show a persistent and widespread increase of growing season integrated LAI (greening) over 25% to 50% of the global vegetated area, whereas less than 4% of the globe shows decreasing LAI (browning). Factorial simulations with multiple global ecosystem models suggest that CO2 fertilization effects explain 70% of the observed greening trend
- ^ Hille, Karl (25 April 2016). "Carbon Dioxide Fertilization Greening Earth, Study Finds". NASA. Retrieved 4 February 2018.
- ^ Evich, Helena Bottemiller; Johnson, Geoff (13 September 2017). "The great nutrient collapse. The atmosphere is literally changing the food we eat, for the worse. And almost nobody is paying attention". Politico - The Agenda. Retrieved 22 September 2017.
- ^ Archer, D. (2005). "Fate of fossil fuel CO
2 in geologic time". J. Geophys. Res. 110. Bibcode:2005JGRC..11009S05A. doi:10.1029/2004JC002625. - ^ Jump up to: a b Susan Solomon; Gian-Kasper Plattner; Reto Knutti; Pierre Friedlingstein (February 2009). "Irreversible climate change due to carbon dioxide emissions". Proc. Natl. Acad. Sci. USA. 106 (6): 1704–09. Bibcode:2009PNAS..106.1704S. doi:10.1073/pnas.0812721106. PMC 2632717. PMID 19179281.
- ^ Archer, David; Eby, Michael; Brovkin, Victor; Ridgwell, Andy; Cao, Long; Mikolajewicz, Uwe; Caldeira, Ken; Matsumoto, Katsumi; Munhoven, Guy; Montenegro, Alvaro; Tokos, Kathy (2009). "Atmospheric Lifetime of Fossil Fuel Carbon Dioxide". Annual Review of Earth and Planetary Sciences. 37 (1): 117–34. Bibcode:2009AREPS..37..117A. doi:10.1146/annurev.earth.031208.100206. hdl:2268/12933. ISSN 0084-6597.
- ^ Fortunat Joos; et al. (December 2001). "Global warming feedbacks on terrestrial carbon uptake under the Intergovernmental Panel on Climate Change (IPCC) Emission Scenarios". Global Biogeochemical Cycles. 15 (4): 891–907. Bibcode:2001GBioC..15..891J. doi:10.1029/2000GB001375.
- ^ Morgan Edwards & Jessika Trancik (25 April 2014). "Supplementary Information" (PDF). Nature Climate Change. doi:10.1038/nclimate2204. hdl:1721.1/96138., supplement to Climate impacts of energy technologies depend on emissions timing
- ^ Buis, Alan; Ramsayer, Kate; Rasmussen, Carol (12 November 2015). "A Breathing Planet, Off Balance". NASA. Retrieved 13 November 2015.
- ^ Staff (12 November 2015). "Audio (66:01) - NASA News Conference – Carbon & Climate Telecon". NASA. Retrieved 12 November 2015.
- ^ St. Fleur, Nicholas (10 November 2015). "Atmospheric Greenhouse Gas Levels Hit Record, Report Says". The New York Times. Retrieved 11 November 2015.
- ^ Jump up to: a b e.g. Gosh, Prosenjit; Brand, Willi A. (2003). "Stable isotope ratio mass spectrometry in global climate change research" (PDF). International Journal of Mass Spectrometry. 228 (1): 1–33. Bibcode:2003IJMSp.228....1G. CiteSeerX 10.1.1.173.2083. doi:10.1016/S1387-3806(03)00289-6.
Global change issues have become significant due to the sustained rise in atmospheric trace gas concentrations (CO
2, N
2O, CH
4) over recent years, attributable to the increased per capita energy consumption of a growing global population. - ^ Mohr, S.H.; Wang, J.; Ellem, G.; Ward, J.; Giurco, D. (1 February 2015). "Projection of world fossil fuels by country". Fuel. 141: 120–135. doi:10.1016/j.fuel.2014.10.030. Retrieved 19 November 2016.
- ^ Keeling, Charles D.; Piper, Stephen C.; Whorf, Timothy P.; Keeling, Ralph F. (2011). "Evolution of natural and anthropogenic fluxes of atmospheric CO2 from 1957 to 2003". Tellus B. 63 (1): 1–22. Bibcode:2011TellB..63....1K. doi:10.1111/j.1600-0889.2010.00507.x. ISSN 0280-6509.
- ^ Bender, Michael L.; Ho, David T.; Hendricks, Melissa B.; Mika, Robert; Battle, Mark O.; Tans, Pieter P.; Conway, Thomas J.; Sturtevant, Blake; Cassar, Nicolas (2005). "Atmospheric O2/N2changes, 1993–2002: Implications for the partitioning of fossil fuel CO2sequestration". Global Biogeochemical Cycles. 19 (4): n/a. Bibcode:2005GBioC..19.4017B. doi:10.1029/2004GB002410. ISSN 0886-6236.
- ^ Jump up to: a b "Global carbon budget 2010 (summary)". Tyndall Centre for Climate Change Research. Archived from the original on 23 July 2012.
- ^ Page, S.; Siegert, F.; Rieley, J.; Boehm, H.; Jaya, A.; Limin, S. (2002). "The amount of carbon released from peat and forest fires in Indonesia during 1997". Nature. 420 (6911): 61–65. Bibcode:2002Natur.420...61P. doi:10.1038/nature01131. PMID 12422213. S2CID 4379529.
- ^ Lazaroff, Cat (8 November 2002). "Indonesian Wildfires Accelerated Global Warming". Environment New Service. Archived from the original on 8 September 2019. Retrieved 7 November 2011.
- ^ Pearce, Fred (6 November 2004). "Massive peat burn is speeding climate change". New Scientist.
- ^ Calculated from file global.1751_2013.csv in [1] Archived 22 October 2011 at the Wayback Machine from the Carbon Dioxide Information Analysis Center.
- ^ "Global Carbon Budget 2019". ICOS. Retrieved 26 January 2020.
- ^ Friedlingstein, Pierre; et al. (4 December 2019). "Global Carbon Budget 2019". Earth System Science Data. 11 (3): 1783–1838 (section 3.4.1). Bibcode:2019ESSD...11.1783F. doi:10.5194/essd-11-1783-2019.
- ^ Ballantyne, A.P.; Alden, C.B.; Miller, J.B.; Tans, P.P.; White, J.W.C. (2012). "Increase in observed net carbon dioxide uptake by land and oceans during the past 50 years". Nature. 488 (7409): 70–72. Bibcode:2012Natur.488...70B. doi:10.1038/nature11299. ISSN 0028-0836. PMID 22859203. S2CID 4335259.
- ^ A.P. Ballantyne; C.B. Alden; J.B. Miller; P.P. Tans; J.W. C. White (2012). "Increase in observed net carbon dioxide uptake by land and oceans during the past 50 years". Nature. 488 (7409): 70–72. Bibcode:2012Natur.488...70B. doi:10.1038/nature11299. PMID 22859203. S2CID 4335259.
- ^ The Early Keeling Curve, SIO. http://scrippsco2.ucsd.edu/history_legacy/early_keeling_curve. Accessed 4 March 2016
- ^ NOAA CCGG page http://www.esrl.noaa.gov/gmd/ccgg/index.html Retrieved 2 March 2016
- ^ WDCGG webpage http://ds.data.jma.go.jp/gmd/wdcgg/ Archived 6 April 2016 at the Wayback Machine Retrieved 2 March 2016
- ^ RAMCES webpage http://www.lsce.ispl.fr/[permanent dead link] Retrieved 2 March 2016
- ^ CDIAC CO2 page http://cdiac.ornl.gov/trends/co2/ Retrieved 9 February 2016
- ^ GLOBALVIEW-CO2 information page. http://www.esrl.noaa.gov/gmd/ccgg/globalview/co2/co2_intro.html. Retrieved 9 February 2016
- ^ TCCON data use policy webpage https://tccon-wiki.caltech.edu/Network_Policy/Data_Use_Policy. Retrieved 9 February 2016
External links[]
- Current global map of carbon dioxide concentrations in the atmosphere
- Global Carbon Dioxide Circulation (NASA; 13 December 2016)
- Video (03:10) – A Year in the Life of Earth's CO2 (NASA; 17 November 2014)
| show Authority control |
|---|
- Atmosphere of Earth
- Carbon dioxide
- Greenhouse gases