Greenhouse gas emissions
The lead section of this article may need to be rewritten. The reason given is: the lead should be an introduction to the article and a summary of its most important contents - it should not require any references and only include summaries of what is already covered and reliably sourced in the rest of the article - currently it contains content not fully covered elsewhere in the article. (August 2021) |
Greenhouse gas emissions are greenhouse gases vented to the Earth's atmosphere because of humans: the greenhouse effect of their 50 billion tons[2] a year causes climate change. Most is carbon dioxide from burning fossil fuels: coal, oil, and natural gas.[3] The largest polluters include coal in China and large oil and gas companies, many state-owned by OPEC and Russia. Human caused emissions have increased atmospheric carbon dioxide by about 50%.
Electricity generation and transport are large emitters. Deforestation and other changes in land use also emit carbon dioxide and methane.[4][5] The largest source of anthropogenic methane emissions is agriculture, closely followed by gas venting and fugitive emissions from the fossil-fuel industry.[6][7] The largest agricultural methane source is livestock. Agricultural soils emit nitrous oxide partly due to fertilizers.[8] Similarly, fluorinated gases from refrigerants play an outsized role in total human emissions.
At current emission rates, before 2030 temperatures may have increased by 1.5 °C (2.7 °F),[9][10] which is the limit for the G7 countries[11] and aspirational limit of the Paris Agreement.[3]
Measurements and calculations[]

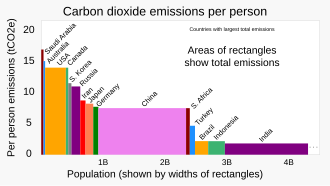
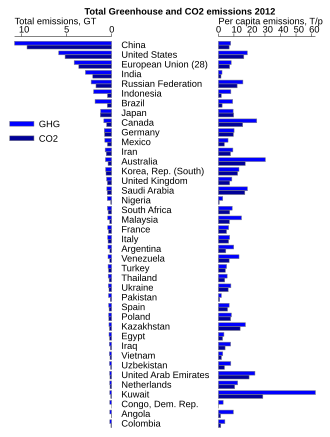
2 emissions, total by country, not per capita (2017 data)


Carbon dioxide (CO
2), nitrous oxide (N
2O), methane, three groups of fluorinated gases (sulfur hexafluoride (SF
6), hydrofluorocarbons (HFCs) and perfluorocarbons (PFCs)) are the major anthropogenic greenhouse gases, and are regulated under the Paris Agreement.[12]:147[13]
Although CFCs are greenhouse gases, they are regulated by the Montreal Protocol, which was motivated by CFCs' contribution to ozone depletion rather than by their contribution to global warming. Note that ozone depletion has only a minor role in greenhouse warming, though the two processes are sometimes confused in the media. In 2016, negotiators from over 170 nations meeting at the summit of the United Nations Environment Programme reached a legally binding accord to phase out hydrofluorocarbons (HFCs) in the Kigali Amendment to the Montreal Protocol.[14][15][16]
There are several ways of measuring greenhouse gas emissions. Some variables that have been reported include:[17]
- Definition of measurement boundaries: Emissions can be attributed geographically, to the area where they were emitted (the territory principle) or by the activity principle to the territory that produced the emissions. These two principles result in different totals when measuring, for example, electricity importation from one country to another, or emissions at an international airport.
- Time horizon of different gases: The contribution of given greenhouse gas is reported as a CO
2 equivalent. The calculation to determine this takes into account how long that gas remains in the atmosphere. This is not always known accurately[clarification needed] and calculations must be regularly updated to reflect new information. - What sectors are included in the calculation (e.g., energy industries, industrial processes, agriculture etc.): There is often a conflict between transparency and availability of data.[citation needed]
- The measurement protocol itself: This may be via direct measurement or estimation. The four main methods are the emission factor-based method, mass balance method, predictive emissions monitoring systems, and continuous emissions monitoring systems. These methods differ in accuracy, cost, and usability. Public information from space-based measurements of carbon dioxide by Climate Trace is expected to reveal individual large plants before the 2021 United Nations Climate Change Conference.[18]
These measures are sometimes used by countries to assert various policy/ethical positions on climate change.[19]:94 The use of different measures leads to a lack of comparability, which is problematic when monitoring progress towards targets. There are arguments for the adoption of a common measurement tool, or at least the development of communication between different tools.[17]
Emissions may be tracked over long time periods, known as historical or cumulative emissions measurements. Cumulative emissions provide some indicators of what is responsible for greenhouse gas atmospheric concentration build-up.[20]:199
The national accounts balance tracks emissions based on the difference between a country's exports and imports. For many richer nations, the balance is negative because more goods are imported than they are exported. This result is mostly due to the fact that it is cheaper to produce goods outside of developed countries, leading developed countries to become increasingly dependent on services and not goods. A positive account balance would mean that more production was occurring within a country, so more operational factories would increase carbon emission levels.[21]
Emissions may also be measured across shorter time periods. Emissions changes may, for example, be measured against the base year of 1990. 1990 was used in the United Nations Framework Convention on Climate Change (UNFCCC) as the base year for emissions, and is also used in the Kyoto Protocol (some gases are also measured from the year 1995).[12]:146, 149 A country's emissions may also be reported as a proportion of global emissions for a particular year.
Another measurement is of per capita emissions. This divides a country's total annual emissions by its mid-year population.[22]:370 Per capita emissions may be based on historical or annual emissions.[19]:106–107
While cities are sometimes considered to be disproportionate contributors to emissions, per-capita emissions tend to be lower for cities than the averages in their countries.[23]
Sources[]
Since about 1750 human activity has increased the concentration of carbon dioxide and other greenhouse gases. As of 2021, measured atmospheric concentrations of carbon dioxide were almost 50% higher than pre-industrial levels.[24] Natural sources of carbon dioxide are more than 20 times greater than sources due to human activity,[25] but over periods longer than a few years natural sources are closely balanced by natural sinks, mainly photosynthesis of carbon compounds by plants and marine plankton. As a result of this balance, the atmospheric mole fraction of carbon dioxide remained between 260 and 280 parts per million for the 10,000 years between the end of the last glacial maximum and the start of the industrial era.[26] Absorption of terrestrial infrared radiation by longwave absorbing gases makes Earth a less efficient emitter. Therefore, in order for Earth to emit as much energy as is absorbed, global temperatures must increase.
Burning fossil fuels is estimated to have emitted 62% of 2015 human GhG.[27]
The main sources of greenhouse gases due to human activity are:
- burning of fossil fuels and deforestation leading to higher carbon dioxide concentrations in the air. Land use change (mainly deforestation in the tropics) account for up to one third of total anthropogenic CO
2 emissions.[26] - livestock enteric fermentation and manure management,[28] paddy rice farming, land use and wetland changes, man-made lakes,[29] pipeline losses, and covered vented landfill emissions leading to higher methane atmospheric concentrations. Many of the newer style fully vented septic systems that enhance and target the fermentation process also are sources of atmospheric methane.
- use of chlorofluorocarbons (CFCs) in refrigeration systems, and use of CFCs and halons in fire suppression systems and manufacturing processes.
- agricultural activities, including the use of fertilizers, that lead to higher nitrous oxide (N
2O) concentrations.
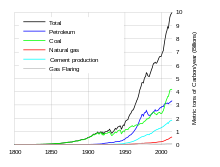
The seven sources of CO
2 from fossil fuel combustion are (with percentage contributions for 2000–2004):[30]
This list needs updating, as it uses an out-of-date source.[needs update]
- Liquid fuels (e.g., gasoline, fuel oil): 36%
- Solid fuels (e.g., coal): 35%
- Gaseous fuels (e.g., natural gas): 20%
- Cement production:3 %
- Flaring gas industrially and at wells: 1%
- Non-fuel hydrocarbons:1%
- "International bunker fuels" of transport not included in national inventories: 4%
A 2017 survey of corporations responsible for global emissions found that 100 companies were responsible for 71% of global direct and indirect emissions, and that state-owned companies were responsible for 59% of their emissions.[31][32]
Emissions by sector[]

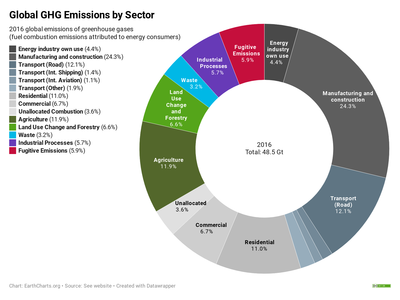
Global greenhouse gas emissions can be attributed to different sectors of the economy. This provides a picture of the varying contributions of different types of economic activity to global warming, and helps in understanding the changes required to mitigate climate change.
Manmade greenhouse gas emissions can be divided into those that arise from the combustion of fuels to produce energy, and those generated by other processes. Around two thirds of greenhouse gas emissions arise from the combustion of fuels.[34]
Energy may be produced at the point of consumption, or by a generator for consumption by others. Thus emissions arising from energy production may be categorized according to where they are emitted, or where the resulting energy is consumed. If emissions are attributed at the point of production, then electricity generators contribute about 25% of global greenhouse gas emissions.[35] If these emissions are attributed to the final consumer then 24% of total emissions arise from manufacturing and construction, 17% from transportation, 11% from domestic consumers, and 7% from commercial consumers.[36] Around 4% of emissions arise from the energy consumed by the energy and fuel industry itself.
The remaining third of emissions arise from processes other than energy production. 12% of total emissions arise from agriculture, 7% from land use change and forestry, 6% from industrial processes, and 3% from waste.[34] Around 6% of emissions are fugitive emissions, which are waste gases released by the extraction of fossil fuels.
As of 2020 Secunda CTL is the world's largest single emitter, at 56.5 million tonnes CO
2 a year.[37]
Agriculture[]
| Food Types | Greenhouse Gas Emissions (g CO2-Ceq per g protein) |
|---|---|
| Ruminant Meat | 62
|
| Recirculating Aquaculture | 30
|
| Trawling Fishery | 26
|
| Non-recirculating Aquaculture | 12
|
| Pork | 10
|
| Poultry | 10
|
| Dairy | 9.1
|
| Non-trawling Fishery | 8.6
|
| Eggs | 6.8
|
| Starchy Roots | 1.7
|
| Wheat | 1.2
|
| Maize | 1.2
|
| Legumes | 0.25
|
Traditional rice cultivation is the second biggest agricultural methane source after livestock, with a near-term warming impact equivalent to the carbon-dioxide emissions from all aviation.[39]
Aviation[]
Approximately 3.5% of the overall human impact on climate are from the aviation sector. The impact of the sector on climate in the late 20 years had doubled, but the part of the contribution of the sector in comparison to other sectors did not change because other sectors grew as well.[40]
Buildings and construction[]
In 2018, manufacturing construction materials and maintaining buildings accounted for 39% of carbon dioxide emissions from energy and process-related emissions. Manufacture of glass, cement, and steel accounted for 11% of energy and process-related emissions.[41] Because building construction is a significant investment, more than two-thirds of buildings in existence will still exist in 2050. Retrofitting existing buildings to become more efficient will be necessary to meet the targets of the Paris Agreement; it will be insufficient to only apply low-emission standards to new construction.[42] Buildings that produce as much energy as they consume are called zero-energy buildings, while buildings that produce more than they consume are energy-plus. Low-energy buildings are designed to be highly efficient with low total energy consumption and carbon emissions—a popular type is the passive house.[41]
Digital sector[]
The digital sector produces between 2% and 4% of global GHG emissions.[43] However the sector reduces emissions from other sectors which have a larger global share, such as transport of people,[44][45] and possibly buildings and industry.[46]
Health care[]
The healthcare sector produces 4.4% - 4.6% of global greenhouse gas emissions.[47]
Steel and aluminium[]
Steel and aluminium are key economic sectors for the carbon capture and storage. According to a 2013 study, "in 2004, the steel industry along emits about 590M tons of CO2, which accounts for 5.2% of the global anthropogenic GHG emissions. CO2 emitted from steel production primarily comes from energy consumption of fossil fuel as well as the use of limestone to purify iron oxides."[48]
Electricity generation[]
Coal-fired power stations are the single largest emitter, with over 20% of global GhG in 2018.[49] Although much less polluting than coal plants, natural gas-fired power plants are also major emitters,[50] taking electricity generation as a while over 25% in 2018.[51] Notably, just 5% of the world’s power plants account for almost three-quarters of carbon emissions from electricity generation, based on an inventory of more than 29,000 fossil-fuel power plants across 221 countries.[52]
Plastics[]
Plastics are produced mainly from fossil fuels. It was estimated that between 1% and 2% of global GHG emissions are associated with plastics' life cycles.[53] The EPA estimates[54] as many as five mass units of carbon dioxide are emitted for each mass unit of polyethylene terephthalate (PET) produced—the type of plastic most commonly used for beverage bottles,[55] the transportation produce greenhouse gases also.[56] Plastic waste emits carbon dioxide when it degrades. In 2018 research claimed that some of the most common plastics in the environment release the greenhouse gases methane and ethylene when exposed to sunlight in an amount that can affect the earth climate.[57][58]
Due to the lightness of plastic versus glass or metal, plastic may reduce energy consumption. For example, packaging beverages in PET plastic rather than glass or metal is estimated to save 52% in transportation energy, if the glass or metal package is single-use, of course.
In 2019 a new report "Plastic and Climate" was published. According to the report, the production and incineration of plastics will contribute in the equivalent of 850 million tonnes of carbon dioxide (CO2) to the atmosphere in 2019. With the current trend, annual life cycle greenhouse gas emissions of plastics will grow to 1.34 billion tonnes by 2030. By 2050, the life cycle emissions of plastics could reach 56 billion tonnes, as much as 14 percent of the Earth's remaining carbon budget.[59] The report says that only solutions which involve a reduction in consumption can solve the problem, while others like biodegradable plastic, ocean cleanup, using renewable energy in plastic industry can do little, and in some cases may even worsen it.[60]
Sanitation sector[]
Wastewater as well as sanitation systems are known to contribute to greenhouse-gas emissions (GHG)[quantify] mainly through the breakdown of excreta during the treatment process. This results in the generation of methane gas, that is then released into the environment. Emissions from the sanitation and wastewater sector have been focused mainly on treatment systems, particularly treatment plants, and this accounts for the bulk of the carbon footprint for the sector.[61]
In as much as climate impacts from wastewater and sanitation systems present global risks, low-income countries experience greater risks in many cases. In recent years,[when?] attention to adaptation needs within the sanitation sector is just beginning to gain momentum.[62]
Tourism[]
According to UNEP, global tourism is a significant contributor to the increasing concentrations of greenhouse gases in the atmosphere.[63]
Trucking and haulage[]
Over a quarter of global transport CO
2 emissions are from road freight,[64] so many countries are further restricting truck CO
2 emissions to help limit climate change.[65]
By socio-economic class[]
Fueled by the consumptive lifestyle of wealthy people, the wealthiest 5% of the global population has been responsible for 37% of the absolute increase in greenhouse gas emissions worldwide. Almost half of the increase in absolute global emissions has been caused by the richest 10% of the population.[66]
By energy source[]
| Technology | Min. | Median | Max. |
|---|---|---|---|
| Currently commercially available technologies | |||
| Coal – PC | 740 | 820 | 910 |
| Gas – combined cycle | 410 | 490 | 650 |
| Biomass – Dedicated | 130 | 230 | 420 |
| Solar PV – Utility scale | 18 | 48 | 180 |
| Solar PV – rooftop | 26 | 41 | 60 |
| Geothermal | 6.0 | 38 | 79 |
| Concentrated solar power | 8.8 | 27 | 63 |
| Hydropower | 1.0 | 24 | 22001 |
| Wind Offshore | 8.0 | 12 | 35 |
| Nuclear | 3.7 | 12 | 110 |
| Wind Onshore | 7.0 | 11 | 56 |
| Pre‐commercial technologies | |||
| Ocean (Tidal and wave) | 5.6 | 17 | 28 |
Relative CO
2 emission from various fuels[]
One liter of gasoline, when used as a fuel, produces 2.32 kg (about 1300 liters or 1.3 cubic meters) of carbon dioxide, a greenhouse gas. One US gallon produces 19.4 lb (1,291.5 gallons or 172.65 cubic feet).[69][70][71]
| Fuel name | CO 2 emitted (lbs/106 Btu) |
CO 2 emitted (g/MJ) |
CO 2 emitted (g/kWh) |
|---|---|---|---|
| Natural gas | 117 | 50.30 | 181.08 |
| Liquefied petroleum gas | 139 | 59.76 | 215.14 |
| Propane | 139 | 59.76 | 215.14 |
| Aviation gasoline | 153 | 65.78 | 236.81 |
| Automobile gasoline | 156 | 67.07 | 241.45 |
| Kerosene | 159 | 68.36 | 246.10 |
| Fuel oil | 161 | 69.22 | 249.19 |
| Tires/tire derived fuel | 189 | 81.26 | 292.54 |
| Wood and wood waste | 195 | 83.83 | 301.79 |
| Coal (bituminous) | 205 | 88.13 | 317.27 |
| Coal (sub-bituminous) | 213 | 91.57 | 329.65 |
| Coal (lignite) | 215 | 92.43 | 332.75 |
| Petroleum coke | 225 | 96.73 | 348.23 |
| Tar-sand bitumen | [citation needed] | [citation needed] | [citation needed] |
| Coal (anthracite) | 227 | 97.59 | 351.32 |
Regional and national attribution of emissions[]
From land-use change[]
Land-use change, e.g., the clearing of forests for agricultural use, can affect the concentration of greenhouse gases in the atmosphere by altering how much carbon flows out of the atmosphere into carbon sinks.[73] Accounting for land-use change can be understood as an attempt to measure "net" emissions, i.e., gross emissions from all sources minus the removal of emissions from the atmosphere by carbon sinks.[19]:92–93
There are substantial uncertainties in the measurement of net carbon emissions.[74] Additionally, there is controversy over how carbon sinks should be allocated between different regions and over time.[19]:93 For instance, concentrating on more recent changes in carbon sinks is likely to favour those regions that have deforested earlier, e.g., Europe.
Greenhouse gas intensity[]

Greenhouse gas intensity is a ratio between greenhouse gas emissions and another metric, e.g., gross domestic product (GDP) or energy use. The terms "carbon intensity" and "emissions intensity" are also sometimes used.[75] Emission intensities may be calculated using market exchange rates (MER) or purchasing power parity (PPP).[19]:96 Calculations based on MER show large differences in intensities between developed and developing countries, whereas calculations based on PPP show smaller differences.
Cumulative and historical emissions[]
Cumulative anthropogenic (i.e., human-emitted) emissions of CO
2 from fossil fuel use are a major cause of global warming,[76] and give some indication of which countries have contributed most to human-induced climate change,[77]:15 calculated per capita cumulative emissions based on then-current population. The ratio in per capita emissions between industrialized countries and developing countries was estimated at more than 10 to 1.
Non-OECD countries accounted for 42% of cumulative energy-related CO
2 emissions between 1890 and 2007.[78]:179–80 Over this time period, the US accounted for 28% of emissions; the EU, 23%; Japan, 4%; other OECD countries 5%; Russia, 11%; China, 9%; India, 3%; and the rest of the world, 18%.[78]:179–80
Overall, developed countries accounted for 83.8% of industrial CO
2 emissions over this time period, and 67.8% of total CO
2 emissions. Developing countries accounted for industrial CO
2 emissions of 16.2% over this time period, and 32.2% of total CO
2 emissions.
In comparison humans have emitted more greenhouse gases than the Chicxulub meteorite impact event which caused the extinction of the dinosaurs.[79]
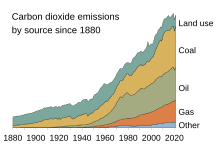
Estimates of total CO
2 emissions do include biotic carbon emissions, mainly from deforestation.[19]:94 Including biotic emissions brings about the same controversy mentioned earlier regarding carbon sinks and land-use change.[19]:93–94 The actual calculation of net emissions is very complex, and is affected by how carbon sinks are allocated between regions and the dynamics of the climate system.
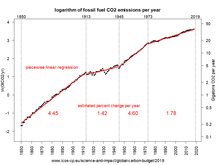
2 emissions on a log (natural and base 10) scale
The graphic shows the logarithm of 1850-2019 fossil fuel CO
2 emissions;[80] natural log on left, actual value of Gigatons per year on right. Although emissions increased during the 170 year period by about 3% per year overall, intervals of distinctly different growth rates (broken at 1913, 1945, and 1973) can be detected. The regression lines suggest that emissions can rapidly shift from one growth regime to another and then persist for long periods of time. The most recent drop in emissions growth - by almost 3 percentage points - was at about the time of the 1970s energy crisis. Percent changes per year were estimated by piecewise linear regression on the log data and are shown on the plot; the data are from The Integrated Carbon Observation system.[81]
Changes since a particular base year[]
Between 1970 and 2004, global growth in annual CO
2 emissions was driven by North America, Asia, and the Middle East.[82] The sharp acceleration in CO
2 emissions since 2000 to more than a 3% increase per year (more than 2 ppm per year) from 1.1% per year during the 1990s is attributable to the lapse of formerly declining trends in carbon intensity of both developing and developed nations. China was responsible for most of global growth in emissions during this period. Localised plummeting emissions associated with the collapse of the Soviet Union have been followed by slow emissions growth in this region due to more efficient energy use, made necessary by the increasing proportion of it that is exported.[30] In comparison, methane has not increased appreciably, and N
2O by 0.25% y−1.
Using different base years for measuring emissions has an effect on estimates of national contributions to global warming.[77]:17–18[83] This can be calculated by dividing a country's highest contribution to global warming starting from a particular base year, by that country's minimum contribution to global warming starting from a particular base year. Choosing between base years of 1750, 1900, 1950, and 1990 has a significant effect for most countries.[77]:17–18 Within the G8 group of countries, it is most significant for the UK, France and Germany. These countries have a long history of CO
2 emissions (see the section on Cumulative and historical emissions).
Annual emissions[]
Annual per capita emissions in the industrialized countries are typically as much as ten times the average in developing countries.[12]:144 Due to China's fast economic development, its annual per capita emissions are quickly approaching the levels of those in the Annex I group of the Kyoto Protocol (i.e., the developed countries excluding the US).[84] Other countries with fast growing emissions are South Korea, Iran, and Australia (which apart from the oil rich Persian Gulf states, now has the highest per capita emission rate in the world). On the other hand, annual per capita emissions of the EU-15 and the US are gradually decreasing over time.[84] Emissions in Russia and Ukraine have decreased fastest since 1990 due to economic restructuring in these countries.[85]
Energy statistics for fast-growing economies are less accurate than those for industrialized countries. For China's annual emissions in 2008, the Netherlands Environmental Assessment Agency estimated an uncertainty range of about 10%.[84]
The greenhouse gas footprint refers to the emissions resulting from the creation of products or services. It is more comprehensive than the commonly used carbon footprint, which measures only carbon dioxide, one of many greenhouse gases.
2015 was the first year to see both total global economic growth and a reduction of carbon emissions.[86]
Top emitter countries[]
Annual[]
In 2019, China, the United States, India, the EU27+UK, Russia, and Japan - the world’s largest CO
2 emitters - together accounted for 51% of the population, 62.5% of global gross domestic product, 62% of total global fossil fuel consumption and emitted 67% of total global fossil CO
2. Emissions from these five countries and the EU28 show different changes in 2019 compared to 2018: the largest relative increase is found for China (+3.4%), followed by India (+1.6%). On the contrary, the EU27+UK (-3.8%), the United States (-2.6%), Japan (-2.1%) and Russia (-0.8%) reduced their fossil CO
2 emissions.[87]
| Country | total emissions (Mton) |
Share (%) |
per capita (ton) |
per GDP (ton/k$) |
|---|---|---|---|---|
| Global Total | 38,016.57 | 100.00 | 4.93 | 0.29 |
| 11,535.20 | 30.34 | 8.12 | 0.51 | |
| 5,107.26 | 13.43 | 15.52 | 0.25 | |
| EU27+UK | 3,303.97 | 8.69 | 6.47 | 0.14 |
| 2,597.36 | 6.83 | 1.90 | 0.28 | |
| 1,792.02 | 4.71 | 12.45 | 0.45 | |
| 1,153.72 | 3.03 | 9.09 | 0.22 | |
| International Shipping | 730.26 | 1.92 | - | - |
| 702.60 | 1.85 | 8.52 | 0.16 | |
| 701.99 | 1.85 | 8.48 | 0.68 | |
| 651.87 | 1.71 | 12.70 | 0.30 | |
| International Aviation | 627.48 | 1.65 | - | - |
| 625.66 | 1.65 | 2.32 | 0.20 | |
| 614.61 | 1.62 | 18.00 | 0.38 | |
| 584.85 | 1.54 | 15.69 | 0.32 | |
| 494.86 | 1.30 | 8.52 | 0.68 | |
| 485.00 | 1.28 | 3.67 | 0.19 | |
| 478.15 | 1.26 | 2.25 | 0.15 | |
| 433.38 | 1.14 | 17.27 | 0.34 | |
| 415.78 | 1.09 | 5.01 | 0.18 | |
| 364.91 | 0.96 | 5.45 | 0.12 | |
| 331.56 | 0.87 | 5.60 | 0.13 | |
| 317.65 | 0.84 | 8.35 | 0.25 | |
| 314.74 | 0.83 | 4.81 | 0.10 | |
| 305.25 | 0.80 | 3.13 | 0.39 | |
| 277.36 | 0.73 | 14.92 | 0.57 | |
| 276.78 | 0.73 | 11.65 | 0.23 | |
| 275.06 | 0.72 | 3.97 | 0.21 | |
| 259.31 | 0.68 | 5.58 | 0.13 | |
| 255.37 | 0.67 | 2.52 | 0.22 | |
| 248.83 | 0.65 | 7.67 | 0.27 | |
| 223.63 | 0.59 | 1.09 | 0.22 | |
| 222.61 | 0.59 | 22.99 | 0.34 | |
| 199.41 | 0.52 | 4.42 | 0.20 | |
| 197.61 | 0.52 | 4.89 | 0.46 | |
| 196.40 | 0.52 | 4.48 | 0.36 | |
| 180.57 | 0.47 | 4.23 | 0.37 | |
| 156.41 | 0.41 | 9.13 | 0.16 | |
| 150.64 | 0.40 | 1.39 | 0.16 | |
| 110.16 | 0.29 | 0.66 | 0.14 | |
| 110.06 | 0.29 | 3.36 | 0.39 | |
| 106.53 | 0.28 | 38.82 | 0.41 | |
| 105.69 | 0.28 | 9.94 | 0.25 | |
| 104.41 | 0.27 | 9.03 | 0.18 | |
| 100.22 | 0.26 | 0.50 | 0.10 | |
| 98.95 | 0.26 | 23.29 | 0.47 | |
| 94.99 | 0.25 | 2.90 | 0.40 | |
| 92.78 | 0.24 | 18.55 | 0.67 | |
| 90.52 | 0.24 | 15.23 | 0.98 | |
| 89.89 | 0.24 | 4.90 | 0.20 | |
| 86.55 | 0.23 | 1.74 | 0.12 | |
| 78.63 | 0.21 | 4.04 | 0.14 | |
| 73.91 | 0.19 | 2.02 | 0.27 | |
| 72.36 | 0.19 | 8.25 | 0.14 | |
| 70.69 | 0.19 | 7.55 | 0.44 | |
| 68.33 | 0.18 | 7.96 | 0.18 | |
| 66.34 | 0.17 | 7.03 | 0.37 | |
| 65.57 | 0.17 | 5.89 | 0.20 | |
| 56.29 | 0.15 | 1.71 | 0.13 | |
| 53.37 | 0.14 | 9.09 | 0.10 | |
| 53.18 | 0.14 | 5.51 | 0.17 | |
| 52.05 | 0.14 | 7.92 | 0.51 | |
| 48.47 | 0.13 | 4.73 | 0.14 | |
| 48.31 | 0.13 | 0.89 | 0.17 | |
| 47.99 | 0.13 | 8.89 | 0.14 | |
| 44.75 | 0.12 | 4.45 | 0.08 | |
| 44.02 | 0.12 | 5.88 | 0.10 | |
| 43.41 | 0.11 | 7.81 | 0.16 | |
| 43.31 | 0.11 | 6.20 | 0.27 | |
| 42.17 | 0.11 | 1.64 | 0.36 | |
| 40.70 | 0.11 | 2.38 | 0.21 | |
| 39.37 | 0.10 | 4.57 | 0.07 | |
| 38.67 | 0.10 | 8.07 | 0.18 | |
| 36.55 | 0.10 | 7.54 | 0.09 | |
| 35.99 | 0.09 | 6.60 | 0.20 | |
| 35.98 | 0.09 | 3.59 | 0.25 | |
| 35.93 | 0.09 | 11.35 | 0.91 | |
| 35.44 | 0.09 | 21.64 | 0.48 | |
| 33.50 | 0.09 | 9.57 | 0.68 | |
| 32.74 | 0.09 | 23.81 | 0.90 | |
| 32.07 | 0.08 | 2.72 | 0.25 | |
| 31.12 | 0.08 | 5.39 | 0.09 | |
| 31.04 | 0.08 | 2.70 | 0.11 | |
| 29.16 | 0.08 | 1.58 | 1.20 | |
| 28.34 | 0.07 | 2.81 | 0.28 | |
| 27.57 | 0.07 | 1.31 | 0.10 | |
| 27.44 | 0.07 | 4.52 | 0.27 | |
| 27.28 | 0.07 | 2.48 | 0.14 | |
| 25.82 | 0.07 | 0.81 | 0.12 | |
| 24.51 | 0.06 | 2.15 | 0.24 | |
| 22.57 | 0.06 | 0.40 | 0.13 | |
| 21.20 | 0.06 | 1.21 | 0.15 | |
| 19.81 | 0.05 | 0.38 | 0.09 | |
| 19.12 | 0.05 | 4.62 | 0.16 | |
| 18.50 | 0.05 | 14.19 | 0.38 | |
| 18.25 | 0.05 | 0.17 | 0.07 | |
| 16.84 | 0.04 | 0.56 | 0.10 | |
| 16.49 | 0.04 | 1.00 | 0.23 | |
| 15.66 | 0.04 | 55.25 | 1.67 | |
| 15.37 | 0.04 | 7.38 | 0.19 | |
| 15.02 | 0.04 | 0.50 | 0.15 | |
| 13.77 | 0.04 | 4.81 | 0.13 | |
| 13.56 | 0.04 | 0.53 | 0.10 | |
| 13.47 | 0.04 | 3.45 | 0.24 | |
| 13.34 | 0.04 | 0.22 | 0.09 | |
| 11.92 | 0.03 | 1.92 | 0.35 | |
| 11.63 | 0.03 | 2.75 | 0.09 | |
| 11.00 | 0.03 | 0.30 | 0.13 | |
| 10.89 | 0.03 | 0.37 | 0.17 | |
| 10.86 | 0.03 | 0.63 | 0.26 | |
| 10.36 | 0.03 | 1.08 | 0.19 | |
| 10.10 | 0.03 | 0.40 | 0.11 | |
| 9.81 | 0.03 | 0.59 | 0.18 | |
| 9.74 | 0.03 | 16.31 | 0.14 | |
| 9.26 | 0.02 | 0.29 | 0.24 | |
| 9.23 | 0.02 | 2.29 | 0.27 | |
| 8.98 | 0.02 | 1.80 | 0.09 | |
| 8.92 | 0.02 | 4.28 | 0.26 | |
| 8.92 | 0.02 | 0.96 | 0.28 | |
| 8.47 | 0.02 | 1.21 | 0.09 | |
| 8.38 | 0.02 | 4.38 | 0.14 | |
| 8.15 | 0.02 | 0.69 | 0.21 | |
| 7.66 | 0.02 | 1.64 | 0.33 | |
| 7.50 | 0.02 | 0.41 | 0.12 | |
| 7.44 | 0.02 | 2.56 | 0.26 | |
| 7.41 | 0.02 | 6.19 | 0.21 | |
| 7.15 | 0.02 | 1.11 | 0.13 | |
| 7.04 | 0.02 | 2.96 | 0.17 | |
| 7.02 | 0.02 | 15.98 | 0.26 | |
| 6.78 | 0.02 | 0.96 | 0.12 | |
| 6.56 | 0.02 | 1.89 | 0.09 | |
| 5.92 | 0.02 | 2.02 | 0.15 | |
| 5.91 | 0.02 | 36.38 | 1.51 | |
| 5.86 | 0.02 | 0.92 | 0.17 | |
| 5.80 | 0.02 | 1.05 | 0.33 | |
| 5.66 | 0.01 | 1.93 | 0.14 | |
| 5.34 | 0.01 | 0.12 | 0.06 | |
| 4.40 | 0.01 | 1.67 | 0.18 | |
| 4.33 | 0.01 | 3.41 | 0.15 | |
| 4.20 | 0.01 | 0.16 | 0.09 | |
| 4.07 | 0.01 | 0.47 | 0.11 | |
| 3.93 | 0.01 | 11.53 | 0.19 | |
| 3.91 | 0.01 | 1.07 | 0.04 | |
| 3.83 | 0.01 | 13.34 | 0.85 | |
| 3.64 | 0.01 | 0.18 | 0.08 | |
| 3.58 | 0.01 | 0.32 | 0.18 | |
| 3.48 | 0.01 | 1.65 | 0.11 | |
| 3.47 | 0.01 | 2.55 | 0.14 | |
| 3.02 | 0.01 | 3.40 | - | |
| 2.98 | 0.01 | 0.03 | 0.03 | |
| 2.92 | 0.01 | 0.22 | 0.09 | |
| 2.85 | 0.01 | 0.35 | 0.22 | |
| 2.45 | 0.01 | 6.08 | 0.18 | |
| 2.36 | 0.01 | 0.10 | 0.08 | |
| 2.12 | 0.01 | 2.57 | 0.24 | |
| 2.06 | 0.01 | 3.59 | 0.22 | |
| 1.95 | 0.01 | 5.07 | - | |
| 1.87 | 0.00 | 4.17 | - | |
| 1.62 | 0.00 | 0.08 | 0.08 | |
| 1.52 | 0.00 | 1.94 | 0.20 | |
| 1.40 | 0.00 | 0.18 | 0.10 | |
| 1.36 | 0.00 | 1.48 | 0.11 | |
| 1.33 | 0.00 | 59.88 | 4.09 | |
| 1.27 | 0.00 | 1.98 | 0.02 | |
| 1.21 | 0.00 | 0.24 | 0.17 | |
| 1.15 | 0.00 | 0.09 | 0.04 | |
| 1.14 | 0.00 | 0.81 | 0.11 | |
| 1.05 | 0.00 | 1.06 | 0.20 | |
| 1.05 | 0.00 | 10.98 | 0.37 | |
| 1.04 | 0.00 | 2.41 | 0.05 | |
| 1.03 | 0.00 | 0.05 | 0.02 | |
| 1.02 | 0.00 | 1.83 | 0.26 | |
| 0.97 | 0.00 | 0.06 | 0.57 | |
| 0.91 | 0.00 | 2.02 | 0.09 | |
| 0.89 | 0.00 | 0.06 | 0.04 | |
| 0.78 | 0.00 | 7.39 | 0.19 | |
| 0.75 | 0.00 | 0.14 | 0.08 | |
| 0.75 | 0.00 | 0.33 | 0.13 | |
| 0.69 | 0.00 | 19.88 | 0.45 | |
| 0.61 | 0.00 | 2.06 | - | |
| 0.60 | 0.00 | 2.08 | 0.10 | |
| 0.59 | 0.00 | 0.27 | 0.11 | |
| 0.54 | 0.00 | 9.47 | 0.19 | |
| 0.51 | 0.00 | 4.90 | 0.24 | |
| 0.49 | 0.00 | 0.10 | 0.11 | |
| 0.44 | 0.00 | 0.22 | 0.11 | |
| 0.40 | 0.00 | 6.38 | 0.09 | |
| 0.38 | 0.00 | 0.28 | 0.10 | |
| 0.37 | 0.00 | 0.95 | 0.14 | |
| 0.35 | 0.00 | 5.75 | 0.14 | |
| 0.34 | 0.00 | 0.03 | 0.04 | |
| 0.30 | 0.00 | 1.65 | 0.11 | |
| 0.30 | 0.00 | 0.51 | - | |
| 0.23 | 0.00 | 2.10 | 0.12 | |
| 0.21 | 0.00 | 0.25 | 0.08 | |
| 0.19 | 0.00 | 3.44 | 0.14 | |
| 0.16 | 0.00 | 0.75 | 0.19 | |
| 0.15 | 0.00 | 1.32 | 0.11 | |
| 0.14 | 0.00 | 0.70 | 0.11 | |
| 0.14 | 0.00 | 0.22 | 0.09 | |
| 0.13 | 0.00 | 1.16 | 0.20 | |
| 0.13 | 0.00 | 3.70 | 0.13 | |
| 0.12 | 0.00 | 3.77 | 0.17 | |
| 0.10 | 0.00 | 1.38 | 0.12 | |
| 0.09 | 0.00 | 0.30 | 0.09 | |
| 0.06 | 0.00 | 9.72 | - | |
| 0.04 | 0.00 | 2.51 | - | |
| 0.03 | 0.00 | 10.87 | - | |
| 0.03 | 0.00 | 0.28 | 0.13 | |
| 0.02 | 0.00 | 1.54 | 0.12 | |
| 0.02 | 0.00 | 3.87 | - | |
| Faroes | 0.00 | 0.00 | 0.04 | 0.00 |


Embedded emissions[]
One way of attributing greenhouse gas emissions is to measure the embedded emissions (also referred to as "embodied emissions") of goods that are being consumed. Emissions are usually measured according to production, rather than consumption.[88] For example, in the main international treaty on climate change (the UNFCCC), countries report on emissions produced within their borders, e.g., the emissions produced from burning fossil fuels.[78]:179[89]:1 Under a production-based accounting of emissions, embedded emissions on imported goods are attributed to the exporting, rather than the importing, country. Under a consumption-based accounting of emissions, embedded emissions on imported goods are attributed to the importing country, rather than the exporting, country.
Davis and Caldeira (2010)[89]:4 found that a substantial proportion of CO
2 emissions are traded internationally. The net effect of trade was to export emissions from China and other emerging markets to consumers in the US, Japan, and Western Europe. Based on annual emissions data from the year 2004, and on a per-capita consumption basis, the top-5 emitting countries were found to be (in tCO
2 per person, per year): Luxembourg (34.7), the US (22.0), Singapore (20.2), Australia (16.7), and Canada (16.6).[89]:5 [needs update]Carbon Trust research revealed that approximately 25% of all CO
2 emissions from human activities 'flow' (i.e., are imported or exported) from one country to another.[citation needed] Major developed economies were found to be typically net importers of embodied carbon emissions—with UK consumption emissions 34% higher than production emissions, and Germany (29%), Japan (19%) and the US (13%) also significant net importers of embodied emissions.[90][needs update]
Effect of policy[]
This section needs to be updated. (December 2019) |
Governments have taken action to reduce greenhouse gas emissions to mitigate climate change. Assessments of policy effectiveness have included work by the Intergovernmental Panel on Climate Change,[91] International Energy Agency,[92][93] and United Nations Environment Programme.[94] Policies implemented by governments have included[95][96][97] national and regional targets to reduce emissions, promoting energy efficiency, and support for a renewable energy transition, such as Solar energy, as an effective use of renewable energy because solar uses energy from the sun and does not release pollutants into the air.
Countries and regions listed in Annex I of the United Nations Framework Convention on Climate Change (UNFCCC) (i.e., the OECD and former planned economies of the Soviet Union) are required to submit periodic assessments to the UNFCCC of actions they are taking to address climate change.[97]:3 Analysis by the UNFCCC (2011)[97]:8 suggested that policies and measures undertaken by Annex I Parties may have produced emission savings of 1.5 thousand Tg CO
2-eq in the year 2010, with most savings made in the energy sector. The projected emissions saving of 1.5 thousand Tg CO
2-eq is measured against a hypothetical "baseline" of Annex I emissions, i.e., projected Annex I emissions in the absence of policies and measures. The total projected Annex I saving of 1.5 thousand CO
2-eq does not include emissions savings in seven of the Annex I Parties.[97]:8
Due to the COVID-19 pandemic, there was a significant reduction in CO
2 emissions globally in 2020.
Projections[]
This section needs to be updated. (December 2019) |
A wide range of projections of future emissions have been produced.[98] Unless energy policies change substantially, the world will continue to depend on fossil fuels until 2025–2030.[99][100] Projections suggest that more than 80% of the world's energy will come from fossil fuels. This conclusion was based on "much evidence" and "high agreement" in the literature.[100] Projected annual energy-related CO
2 emissions in 2030 were 40–110% higher than in 2000, with two-thirds of the increase originating in developing countries.[100] Projected annual per capita emissions in developed country regions remained substantially lower (2.8–5.1 tonnes CO
2) than those in developed country regions (9.6–15.1 tonnes CO
2).[101] Projections consistently showed increase in annual world emissions of "Kyoto" gases,[102] measured in CO
2-equivalent) of 25–90% by 2030, compared to 2000.[100]
See also[]
- Attribution of recent climate change
- Carbon credit
- Carbon emissions reporting
- Carbon offset
- Carbon tax
- Emission standard
- List of countries by electricity production from renewable sources
- Low-carbon economy
- Paris Agreement
- Perfluorotributylamine
- World energy consumption
- Zero-emissions vehicle
- Orbiting Carbon Observatory 2
- Carbon Dioxide Information Analysis Center
References[]
- ^ "Historical GHG Emissions / Global Historical Emissions". ClimateWatchData.org. Climate Watch. 2021. Archived from the original on 21 May 2021. ● Population data from "List of the populations of the world's countries, dependencies, and territories". britannica.com. Encyclopedia Britannica. Archived from the original on 26 May 2021.
- ^ Ritchie, Hannah; Roser, Max (11 May 2020). "Greenhouse gas emissions". Our World in Data. Retrieved 2021-06-22.
- ^ Jump up to: a b Tollefson, Jeff (9 August 2021). Helmuth, Laura (ed.). "Earth Is Warmer Than It's Been in 125,000 Years". Scientific American. Berlin: Springer Nature. ISSN 0036-8733. Archived from the original on 9 August 2021. Retrieved 12 August 2021.
- ^ "Global Greenhouse Gas Emissions Data". U.S. Environmental Protection Agency. 12 January 2016. Retrieved 30 December 2019.
The burning of coal, natural gas, and oil for electricity and heat is the largest single source of global greenhouse gas emissions.
- ^ "AR4 SYR Synthesis Report Summary for Policymakers – 2 Causes of change". ipcc.ch. Archived from the original on 28 February 2018. Retrieved 9 October 2015.
- ^ "Global Methane Emissions and Mitigation Opportunities" (PDF). Global Methane Initiative. 2020.
- ^ "Sources of methane emissions". International Energy Agency. 2020-08-20.
- ^ Chrobak, Ula. "The world's forgotten greenhouse gas". www.bbc.com. Retrieved 2021-06-22.
- ^ "Analysis: When might the world exceed 1.5C and 2C of global warming?". Carbon Brief. 2020-12-04. Retrieved 2021-06-17.
- ^ "World now likely to hit watershed 1.5 °C rise in next five years, warns UN weather agency". UN News. 2021-05-26. Retrieved 2021-06-22.
- ^ Nishat (2021-06-14). "G7 countries agree to existing climate change policies". Open Access Government. Retrieved 2021-06-17.
- ^ Jump up to: a b c Grubb, M. (July–September 2003). "The economics of the Kyoto protocol" (PDF). World Economics. 4 (3). Archived from the original (PDF) on 17 July 2011.
- ^ Lerner & K. Lee Lerner, Brenda Wilmoth (2006). "Environmental issues: essential primary sources". Thomson Gale. Retrieved 11 September 2006.
- ^ Johnston, Chris; Milman, Oliver; Vidal, John (15 October 2016). "Climate change: global deal reached to limit use of hydrofluorocarbons". The Guardian. Retrieved 2018-08-21.
- ^ "Climate change: 'Monumental' deal to cut HFCs, fastest growing greenhouse gases". BBC News. 15 October 2016. Retrieved 15 October 2016.
- ^ "Nations, Fighting Powerful Refrigerant That Warms Planet, Reach Landmark Deal". The New York Times. 15 October 2016. Retrieved 15 October 2016.
- ^ Jump up to: a b Bader, N.; Bleichwitz, R. (2009). "Measuring urban greenhouse gas emissions: The challenge of comparability. S.A.P.I.EN.S. 2 (3)". S.a.p.i.en.s. Surveys and Perspectives Integrating Environment and Society. Sapiens.revues.org. 2 (3). Retrieved 2011-09-11.
- ^ "Transcript: The Path Forward: Al Gore on Climate and the Economy". Washington Post. ISSN 0190-8286. Retrieved 2021-05-06.
- ^ Jump up to: a b c d e f g Banuri, T. (1996). Equity and social considerations. In: Climate change 1995: Economic and social dimensions of climate change. Contribution of Working Group III to the Second Assessment Report of the Intergovernmental Panel on Climate Change (J.P. Bruce et al. Eds.). This version: Printed by Cambridge University Press, Cambridge, and New York. PDF version: IPCC website. doi:10.2277/0521568544. ISBN 978-0521568548.
- ^ World energy outlook 2007 edition – China and India insights. International Energy Agency (IEA), Head of Communication and Information Office, 9 rue de la Fédération, 75739 Paris Cedex 15, France. 2007. p. 600. ISBN 978-9264027305. Archived from the original on 15 June 2010. Retrieved 4 May 2010.
- ^ Holtz-Eakin, D. (1995). "Stoking the fires? CO
2 emissions and economic growth" (PDF). Journal of Public Economics. 57 (1): 85–101. doi:10.1016/0047-2727(94)01449-X. S2CID 152513329. - ^ "Selected Development Indicators" (PDF). World Development Report 2010: Development and Climate Change (PDF). Washington, DC: The International Bank for Reconstruction and Development / The World Bank. 2010. Tables A1 and A2. doi:10.1596/978-0-8213-7987-5. ISBN 978-0821379875.
- ^ Dodman, David (April 2009). "Blaming cities for climate change? An analysis of urban greenhouse gas emissions inventories". Environment and Urbanization. 21 (1): 185–201. doi:10.1177/0956247809103016. ISSN 0956-2478. S2CID 154669383.
- ^ Fox, Alex. "Atmospheric Carbon Dioxide Reaches New High Despite Pandemic Emissions Reduction". Smithsonian Magazine. Retrieved 2021-06-22.
- ^ "The present carbon cycle – Climate Change". Grida.no. Retrieved 2010-10-16.
- ^ Jump up to: a b Couplings Between Changes in the Climate System and Biogeochemistry (PDF). Retrieved 13 May 2008. in IPCC AR4 WG1 (2007)
- ^ "Climate Change: Causation Archives". EarthCharts. Retrieved 2021-06-22.
- ^ Steinfeld, H.; Gerber, P.; Wassenaar, T.; Castel, V.; Rosales, M.; de Haan, C. (2006). Livestock's long shadow (Report). FAO Livestock, Environment and Development (LEAD) Initiative.
- ^ Ciais, Phillipe; Sabine, Christopher; et al. "Carbon and Other Biogeochemical Cycles" (PDF). In Stocker Thomas F.; et al. (eds.). Climate Change 2013: The Physical Science Basis. IPCC. p. 473.
- ^ Jump up to: a b Raupach, M.R.; et al. (2007). "Global and regional drivers of accelerating CO
2 emissions" (PDF). Proc. Natl. Acad. Sci. USA. 104 (24): 10288–93. Bibcode:2007PNAS..10410288R. doi:10.1073/pnas.0700609104. PMC 1876160. PMID 17519334. - ^ "Just 100 companies responsible for 71% of global emissions, study says". The Guardian. 2017-07-10. Retrieved 2021-04-09.
- ^ Gustin, Georgina (2017-07-09). "25 Fossil Fuel Producers Responsible for Half Global Emissions in Past 3 Decades". Inside Climate News. Retrieved 2021-05-04.
- ^ "Global Greenhouse Gas Emissions by Sector". EarthCharts. 6 March 2020. Retrieved 15 March 2020.
- ^ Jump up to: a b "Climate Watch". www.climatewatchdata.org. Retrieved 2020-03-06.
- ^ IEA, CO2 Emissions from Fuel Combustion 2018: Highlights (Paris: International Energy Agency, 2018) p.98
- ^ IEA, CO2 Emissions from Fuel Combustion 2018: Highlights (Paris: International Energy Agency, 2018) p.101
- ^ "The World's Biggest Emitter of Greenhouse Gases". Bloomberg.com. 2020-03-17. Retrieved 2020-12-29.
- ^ Michael Clark; Tilman, David (November 2014). "Global diets link environmental sustainability and human health". Nature. 515 (7528): 518–522. Bibcode:2014Natur.515..518T. doi:10.1038/nature13959. ISSN 1476-4687. PMID 25383533. S2CID 4453972.
- ^ Reed, John (25 June 2020). "Thai rice farmers step up to tackle carbon footprint". Financial Times. Retrieved 25 June 2020.
- ^ Davidson, Jordan (4 September 2020). "Aviation Accounts for 3.5% of Global Warming Caused by Humans, New Research Says". Ecowatch. Retrieved 6 September 2020.
- ^ Jump up to: a b Ürge-Vorsatz, Diana; Khosla, Radhika; Bernhardt, Rob; Chan, Yi Chieh; Vérez, David; Hu, Shan; Cabeza, Luisa F. (2020). "Advances Toward a Net-Zero Global Building Sector". Annual Review of Environment and Resources. 45: 227–269. doi:10.1146/annurev-environ-012420-045843.
- ^ "Why the building sector?". Architecture 2020. Retrieved 1 April 2021.
- ^ Freitag, Charlotte; Berners-Lee, Mike (December 2020). "The climate impact of ICT: A review of estimates, trends and regulations". arXiv:2102.02622 [physics.soc-ph].
- ^ "Working from home is erasing carbon emissions -- but for how long?". Grist. 2020-05-19. Retrieved 2021-04-04.
- ^ "How digitalization acts as a driver of decarbonization". www.ey.com. Retrieved 2021-06-22.
- ^ Cunliff, Colin (2020-07-06). "Beyond the Energy Techlash: The Real Climate Impacts of Information Technology". Cite journal requires
|journal=(help) - ^ J. Eckelman, Matthew; Huang, Kaixin; Dubrow, Robert; D. Sherman, Jodi (December 2020). "Health Care Pollution And Public Health Damage In The United States: An Update". Health Affairs. 39 (12): 2071–2079. doi:10.1377/hlthaff.2020.01247. PMID 33284703.
- ^ Tsaia, I-Tsung; Al Alia, Meshayel; El Waddi, Sanaâ; Adnan Zarzourb, aOthman (2013). "Carbon Capture Regulation for The Steel and Aluminum Industries in the UAE: An Empirical Analysis". Energy Procedia. 37: 7732–7740. doi:10.1016/j.egypro.2013.06.719. ISSN 1876-6102. OCLC 5570078737.
- ^ "Emissions". www.iea.org. Archived from the original on 12 August 2019. Retrieved 2019-09-21.
- ^ "We have too many fossil-fuel power plants to meet climate goals". Environment. 2019-07-01. Retrieved 2019-09-21.
- ^ "March: Tracking the decoupling of electricity demand and associated CO2 emissions". www.iea.org. Retrieved 2019-09-21.
- ^ Grant, Don; Zelinka, David; Mitova, Stefania (2021-07-13). "Reducing CO2 emissions by targeting the world's hyper-polluting power plants". Environmental Research Letters. 16 (9): 094022. doi:10.1088/1748-9326/ac13f1. ISSN 1748-9326.
- ^ Zheng, Jiajia; Suh, Sangwon (May 2019). "Strategies to reduce the global carbon footprint of plastics". Nature Climate Change. 9 (5): 374–378. Bibcode:2019NatCC...9..374Z. doi:10.1038/s41558-019-0459-z. ISSN 1758-6798. S2CID 145873387.
- ^ "The Link Between Plastic Use and Climate Change: Nitty-gritty". stanfordmag.org. 2009. Retrieved March 5, 2021.
... According to the EPA, approximately one ounce of carbon dioxide is emitted for each ounce of polyethylene (PET) produced. PET is the type of plastic most commonly used for beverage bottles. ...'
- ^ Glazner, Elizabeth. "Plastic Pollution and Climate Change". Plastic Pollution Coalition. Plastic Pollution Coalition. Retrieved 6 August 2018.
- ^ Blue, Marie-Luise. "What Is the Carbon Footprint of a Plastic Bottle?". Sciencing. Leaf Group Ltd. Retrieved 6 August 2018.
- ^ Royer, Sarah-Jeanne; Ferrón, Sara; Wilson, Samuel T.; Karl, David M. (1 August 2018). "Production of methane and ethylene from plastics in the environment". PLOS ONE. 13 (Plastic, Climate Change): e0200574. Bibcode:2018PLoSO..1300574R. doi:10.1371/journal.pone.0200574. PMC 6070199. PMID 30067755.
- ^ Rosane, Olivia (2 August 2018). "Study Finds New Reason to Ban Plastic: It Emits Methane in the Sun" (Plastic, Climate Change). Ecowatch. Retrieved 6 August 2018.
- ^ "Sweeping New Report on Global Environmental Impact of Plastics Reveals Severe Damage to Climate". Center for International Environmental Law (CIEL). Retrieved 16 May 2019.
- ^ Plastic & Climate The Hidden Costs of a Plastic Planet (PDF). Center for International Environmental Law, Environmental Integrity Project, FracTracker Alliance, Global Alliance for Incinerator Alternatives, 5 Gyres, and Break Free From Plastic. May 2019. pp. 82–85. Retrieved 20 May 2019.
- ^ Dickin, Sarah; Bayoumi, Moustafa; Giné, Ricard; Andersson, Kim; Jiménez, Alejandro (2020-05-25). "Sustainable sanitation and gaps in global climate policy and financing". NPJ Clean Water. 3 (1): 1–7. doi:10.1038/s41545-020-0072-8. ISSN 2059-7037. S2CID 218865175.
- ^ World Health Organisation (1 July 2019). "Climate, Sanitation and Health" (PDF). WHO Discussion Paper.
- ^ "Environmental Impacts of Tourism – Global Level". UNEP.
- ^ "Cars, planes, trains: where do CO2 emissions from transport come from?". Our World in Data. Retrieved 2021-06-19.
- ^ "EU countries agree to 30 percent cut in truck CO2 emissions". Reuters. 20 December 2018.
- ^ Rapid Transition Alliance, 13 Apr. 2021 "Cambridge Sustainability Commission Report on Scaling Behaviour Change" p. 20
- ^ "IPCC Working Group III – Mitigation of Climate Change, Annex III: Technology - specific cost and performance parameters - Table A.III.2 (Emissions of selected electricity supply technologies (gCO 2eq/kWh))" (PDF). IPCC. 2014. p. 1335. Archived (PDF) from the original on 14 December 2018. Retrieved 14 December 2018.
- ^ "IPCC Working Group III – Mitigation of Climate Change, Annex II Metrics and Methodology - A.II.9.3 (Lifecycle greenhouse gas emissions)" (PDF). pp. 1306–1308. Archived (PDF) from the original on 23 April 2021. Retrieved 14 December 2018.
- ^ "Greenhouse Gas Emissions from a Typical Passenger Vehicle" (PDF). Epa.gov. US Environment Protection Agency. Retrieved 2011-09-11.
- ^ Engber, Daniel (1 November 2006). "How gasoline becomes CO
2, Slate Magazine". Slate Magazine. Retrieved 2011-09-11. - ^ "Volume calculation for carbon dioxide". Icbe.com. Retrieved 2011-09-11.
- ^ "Voluntary Reporting of Greenhouse Gases Program". Energy Information Administration. Archived from the original on 1 November 2004. Retrieved 21 August 2009.
- ^ B. Metz; O.R. Davidson; P.R. Bosch; R. Dave; L.A. Meyer (eds.), Annex I: Glossary J–P, archived from the original on 3 May 2010
- ^ Markandya, A. (2001). "7.3.5 Cost Implications of Alternative GHG Emission Reduction Options and Carbon Sinks". In B. Metz; et al. (eds.). Costing Methodologies. Climate Change 2001: Mitigation. Contribution of Working Group III to the Third Assessment Report of the Intergovernmental Panel on Climate Change. Print version: Cambridge University Press, Cambridge, and New York. This version: GRID-Arendal website. doi:10.2277/0521015022 (inactive 31 May 2021). ISBN 978-0521015028. Archived from the original on 5 August 2011. Retrieved 11 April 2011.CS1 maint: DOI inactive as of May 2021 (link)
- ^ Herzog, T. (November 2006). Yamashita, M.B. (ed.). Target: intensity – an analysis of greenhouse gas intensity targets (PDF). World Resources Institute. ISBN 978-1569736388. Retrieved 2011-04-11.
- ^
Botzen, W.J.W.; et al. (2008). "Cumulative CO
2 emissions: shifting international responsibilities for climate debt". Climate Policy. 8 (6): 570. doi:10.3763/cpol.2008.0539. S2CID 153972794. - ^ Jump up to: a b c Höhne, N.; et al. (24 September 2010). "Contributions of individual countries' emissions to climate change and their uncertainty" (PDF). Climatic Change. 106 (3): 359–91. doi:10.1007/s10584-010-9930-6. S2CID 59149563. Archived from the original (PDF) on 26 April 2012.
- ^ Jump up to: a b c World Energy Outlook 2009 (PDF), Paris: International Energy Agency (IEA), 2009, pp. 179–80, ISBN 978-9264061309, archived from the original (PDF) on 24 September 2015, retrieved 27 December 2011
- ^ Specktor, Brandon (2019-10-01). "Humans Are Disturbing Earth's Carbon Cycle More Than the Dinosaur-Killing Asteroid Did". livescience.com. Retrieved 2021-07-08.
- ^ Friedlingstein, P., et al. (2020). "Global Carbon Budget 2020." Earth Syst. Sci. Data 12(4): 3269-3340
- ^ "Global Carbon Budget 2019".
- ^ "Introduction", 1.3.1 Review of the last three decades, archived from the original on 21 January 2012, retrieved 14 January 2012 in Rogner et al. (2007)
- ^ The cited paper uses the term "start date" instead of "base year."
- ^ Jump up to: a b c "Global CO
2 emissions: annual increase halves in 2008". Netherlands Environmental Assessment Agency (PBL) website. 25 June 2009. Archived from the original on 19 December 2010. Retrieved 2010-05-05. - ^ "Global Carbon Mechanisms: Emerging lessons and implications (CTC748)". Carbon Trust. March 2009. p. 24. Retrieved 2010-03-31.
- ^ Vaughan, Adam (2015-12-07). "Global emissions to fall for first time during a period of economic growth". The Guardian. ISSN 0261-3077. Retrieved 2016-12-23.
- ^ Jump up to: a b "Fossil CO2 emissions of all world countries - 2020 report". EDGAR - Emissions Database for Global Atmospheric Research.
 This article incorporates text available under the CC BY 4.0 license.
- ^ Helm, D.; et al. (10 December 2007). Too Good To Be True? The UK's Climate Change Record (PDF). p. 3. Archived from the original (PDF) on 15 July 2011.
- ^ Jump up to: a b c
Davis, S.J.; K. Caldeira (8 March 2010). "Consumption-based Accounting of CO
2 Emissions" (PDF). Proceedings of the National Academy of Sciences of the United States of America. 107 (12): 5687–5692. Bibcode:2010PNAS..107.5687D. doi:10.1073/pnas.0906974107. PMC 2851800. PMID 20212122. Retrieved 2011-04-18. - ^ "International Carbon Flows". Carbon Trust. May 2011. Archived from the original on 1 August 2018. Retrieved 12 November 2012.
- ^ e.g., Gupta et al. (2007) assessed the scientific literature on climate change mitigation policy: Gupta, S.; et al. Policies, instruments, and co-operative arrangements. Archived from the original on 28 July 2012. Retrieved 4 September 2012. in Rogner et al. (2007)
- ^ "Energy Policy". Paris: International Energy Agency (IEA). 2012. Archived from the original on 8 September 2012. Retrieved 4 September 2012.
- ^ "IEA Publications on 'Energy Policy'". Paris: Organization for Economic Co-operation and Development (OECD) / International Energy Agency (IEA). 2012. Archived from the original on 12 June 2012. Retrieved 31 May 2012.
- ^ Bridging the Emissions Gap: A UNEP Synthesis Report (PDF), Nairobi, Kenya: United Nations Environment Programme (UNEP), November 2011, ISBN 978-9280732290 UNEP Stock Number: DEW/1470/NA
- ^ "4. Energizing development without compromising the climate" (PDF). World Development Report 2010: Development and Climate Change (PDF). Washington, DC: The International Bank for Reconstruction and Development / The World Bank. 2010. p. 192, Box 4.2: Efficient and clean energy can be good for development. doi:10.1596/978-0-8213-7987-5. ISBN 978-0821379875.
- ^ Sixth compilation and synthesis of initial national communications from Parties not included in Annex I to the Convention. Note by the secretariat. Executive summary (PDF). Geneva, Switzerland: United Nations Framework Convention on Climate Change (UNFCCC). 2005. pp. 10–12.
- ^ Jump up to: a b c d Compilation and synthesis of fifth national communications. Executive summary. Note by the secretariat (PDF). Geneva (Switzerland): United Nations Framework Convention on Climate Change (UNFCCC). 2011. pp. 9–10.
- ^ Fisher, B.; et al. "3.1 Emissions scenarios". Issues related to mitigation in the long-term context. in Rogner et al. (2007)
- ^ "1.3.2 Future outlook". Introduction. in Rogner et al. (2007)
- ^ Jump up to: a b c d "Introduction". Executive Summary. in Rogner et al. (2007)
- ^ "1.3.2.4 Total GHG emissions". Introduction. Archived from the original on 28 January 2013. Retrieved 4 September 2012. in Rogner et al. (2007)
- ^ carbon dioxide, methane, nitrous oxide, sulfur hexafluoride
Bibliography[]
- IPCC AR4 WG1 (2007), Solomon, S.; Qin, D.; Manning, M.; Chen, Z.; Marquis, M.; Averyt, K.B.; Tignor, M.; Miller, H.L. (eds.), Climate Change 2007: The Physical Science Basis – Contribution of Working Group I (WG1) to the Fourth Assessment Report (AR4) of the Intergovernmental Panel on Climate Change (IPCC), Cambridge University Press, ISBN 978-0521880091 (pb: ISBN 978-0521705967)
- Rogner, H.-H.; Zhou, D.; Bradley, R.; Crabbé, P.; Edenhofer, O.; Hare, B.; Kuijpers, L.; Yamaguchi, M. (2007), B. Metz; O.R. Davidson; P.R. Bosch; R. Dave; L.A. Meyer (eds.), Climate Change 2007: Mitigation. Contribution of Working Group III to the Fourth Assessment Report of the Intergovernmental Panel on Climate Change, Cambridge University Press, ISBN 978-0521880114, archived from the original on 21 January 2012, retrieved 14 January 2012
External links[]
| Wikimedia Commons has media related to Greenhouse gas emissions. |
- The official greenhouse gas emissions data of developed countries from the UNFCCC
- Annual Greenhouse Gas Index (AGGI) from NOAA
- NOAA CMDL CCGG – Interactive Atmospheric Data Visualization NOAA CO
2 data
| show Climate change |
|---|
- Greenhouse gas emissions
- Climate forcing