Greenhouse gas emissions by the United States

US greenhouse gas emissions by economic sector[2]
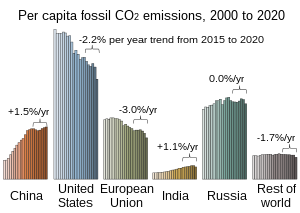
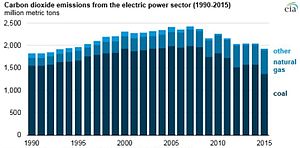
The United States produced 6.6 billion metric tons of carbon dioxide equivalent greenhouse gas (GHG) emissions in 2019,[3] the second largest in the world after greenhouse gas emissions by China and among the countries with the highest greenhouse gas emissions per person. In 2019 China is estimated to have emitted 27% of world GhG, followed by the United States with 11%, then India with 6.6%.[4] In total the United States has emitted 400 billion metric tons, more than any other country.[5] This is over 15 tonnes per person and, amongst the top ten emitters, is the second highest country by greenhouse gas emissions per person after Canada.[6] Because coal-fired power stations are gradually shutting down, in the 2010s emissions from electricity generation fell to second place behind transportation which is now the largest single source.[7] In 2019, 29% of the GHG emissions of the United States were from transportation, 25% from electricity, 23% from industry, 13% from commercial and residential buildings and 10% from agriculture.[8]
Although greenhouse gas emissions by the European Union will be net zero by 2050 and China by 2060, the United States has no target to stop emitting. These greenhouse gas emissions are contributing to climate change in the United States as well as worldwide.
Background[]
Sources and types of greenhouse gases[]
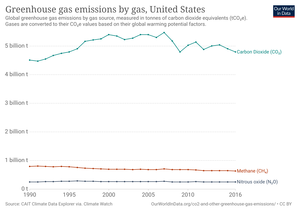

Greenhouse gases refer to any number of gases, including carbon dioxide, nitrous oxide, ozone, methane, fluorinted gases and others, that absorb and emit radiant energy in the atmosphere. Atmospheric concentrations of greenhouse gases have increased significantly since the Industrial Revolution, which most scientists concur is due to anthropogenic causes. Human powered force and activity is known as anthropogenic activity, which is causing a lot of detrimental effects on the planet. Such effects include erratic weather patterns, droughts and heat waves, wildfires, ocean acidification, sea level rise, glacial melting, increased average global temperatures, extinction, and many more.[9]
The main greenhouse gases are carbon dioxide, methane, nitrous oxide, and fluorinated gases. Carbon dioxide enters the atmosphere through the mass burning of fossil fuels such as coal, natural gas, and oil along with trees, solid waste, and biological materials. In 2018, it was estimated to approximately be 81% of all greenhouse gases emitted in 2018. Natural sinks and reservoirs absorb carbon dioxide emissions through a process called the carbon cycle. Sinks and reservoirs can include the ocean, forests and vegetation, and the ground.[10] Methane is mainly produced by livestock and agricultural practices. Methane was estimated to take up 10% of emitted greenhouse gases. [11] Nitrous oxide is a greenhouse gas produced by the combustion of industrial practices, agricultural processes, the burning of fossil fuels and solid waste, and lastly the treatment of wastewater. [11] Fluorinated gases are synthetically produced and used as substitutes for stratospheric ozone-depleting substances. [11]
Greenhouse gases have a range in how long they remain in the atmosphere. Regardless of where it was emitted from, emissions are roughly spread across the world and become mixed into a heterogeneous mixture. They are calculated in parts per million (ppm), parts per billion (ppb), and parts per trillion (ppt). In 2019, data states that there was 409.8 parts per million of carbon dioxide in the atmosphere.[12] This strongly impacts the atmosphere in that it causes global warming, creating a thick blanket over the Earth's atmosphere. [11]
Greenhouse gases are produced from a wide variety of human activities, though some of the greatest impacts come from burning fossil fuels, deforestation, agriculture and industrial manufacturing. In the United States, power generation was the largest source of emissions for many years, but in 2017, the transportation sector overtook it as the leading emissions source. As of that year, the breakdown was transportation at 29%, followed by electricity generation at 28% and industry at 22%.[13]
After carbon dioxide, the next most abundant compound is methane, though there have been methodological differences in how to measure its effects. According to a 2016 study, US methane emissions were underestimated by the EPA for at least a decade, by some 30 to 50 percent.[14] Currently, the US government is working to reduce methane emissions in the agriculture, mining, landfill, and petroleum industries.[15]
Another area of concern is that of ozone-depleting substances such as chlorofluorocarbons (CFCs) and hydrofluorocarbons (HFCs), which are often potent greenhouse gases with serious global warming potential (GWP). However, significant progress has been made in reducing the usage of these gases as a result of the Montreal Protocol, the international treaty that took effect in 1989.
Major emissions-creating events[]
In February 2018, an explosion and blowout in a natural gas well in Belmont County, Ohio was detected by the Copernicus Sentinel-5P satellite's . The well was owned by XTO Energy. About 30 homes were evacuated, and brine and produced water were discharged into streams flowing into the Ohio River. The blowout lasted 20 days, releasing more than 50,000 tons of methane into the atmosphere. The blowout leaked more methane than is discharged by most European nations in a year from their oil and gas industries.[16][17][18][19]

2 emissions in China and the rest of world have eclipsed the output of the United States and Europe.[20]
Reporting requirement[]
Reporting of greenhouse gases was first implemented on a voluntary basis with the creation of a federal register of greenhouse gas emissions authorized under Section 1605(b) of the Energy Policy Act of 1992. This program provides a means for utilities, industries, and other entities to establish a public record of their emissions and the results of voluntary measures to reduce, avoid, or sequester GHG emission
In 2009, the United States Environmental Protection Agency established a similar program mandating reporting for facilities that produce 25,000 or more metric tons of carbon dioxide per year. This has resulted in thousands of US companies monitoring and reporting their greenhouse gas emissions, covering about half of all GHG emissions in the United States.[21]
A separate inventory of fossil fuel CO
2 emissions is provided by Project Vulcan, a NASA/DOE funded effort to quantify North American fossil fuel emissions over time.[22]
Mitigation[]
This section needs to be updated. (February 2021) |
Federal Policies[]
The United States government has held shifting attitudes toward addressing greenhouse gas emissions. The George W. Bush administration opted not to sign the Kyoto Protocol,[23] but the Obama administration attempted to adopt some Kyoto Protocol goals.[citation needed] The Trump administration withdrew from the Paris Agreement while increasing the export of crude oil and gas, making the United States the largest producer.[24] In April 2021, the Biden administration committed to reducing emissions to half of 2005 levels by 2030.[25]
In 2007, the United States Department of State offered a nation-level perspective in the Fourth US Climate Action Report (USCAR) to the United Nations Framework Convention on Climate Change, including measures to address climate change.[26]
Cross-sectoral[]
Greenhouse gases other than CO2[]
- Environmental Stewardship —The objective of this initiative is to limit emissions of HFCs, PFCs, and SF6 in three industrial applications: semiconductor production, electric power distribution, and magnesium production.[27]
Transportation[]
Passenger vehicles in the United States are estimated to emit 2.4% of global greenhouse gas emissions.[28] As of 2011, 71% of petroleum consumed in the United States was used for transportation.[29] Programs to reduce greenhouse gas emissions from the transportation sector include:
- The Corporate Average Fuel Economy (CAFE) program requires automobile manufacturers to meet average fuel economy standards for the light-duty vehicles, large passenger vans and SUVs sold in the United States. Fuel economy standards vary according to the size of the vehicle.
- SmartWay
- Renewable Fuel Standard: Under the Energy Policy Act of 2005, United States Environmental Protection Agency is responsible for promulgating regulations to ensure that gasoline sold in the United States contains a specific volume of renewable fuel.[29]
- FreedomCAR and and Vehicle Technologies Program:
- The program[30] works jointly with DOE's hydrogen, fuel cell, and infrastructure R&D efforts and the efforts to develop improved technology for hybrid electric vehicle, which include the hybrid electric components (such as batteries and electric motors).
- The U.S. government uses six "criteria pollutants" as indicators of air quality: ozone, carbon monoxide, sulfur dioxide, nitrogen dioxides, particulate matter, and lead and does not include carbon dioxide and other greenhouse gases.
- Clean Cities: a network of local coalitions created by DOE in 1993 that works to support energy efficiency and clean fuel efforts in local transportation contexts.[31]
- (CMAQ) Program.[32]
- Aviation industry regulation: emissions from commercial and business jets make up 10% of U.S. transportation sector emissions and 3% of total national GHG emissions.[33] In 2016, the EPA issued an "endangerment finding" that allowed the agency to regulate aircraft emissions, and the first proposed standards under that legal determination were issued in July 2020.[34]
- Developing alternative energy sources: The Department of Energy’s Bioenergy Technologies Office (BETO) supports research into biofuels as part of that agency's efforts to reduce transportation-related GHG emissions.[35][36]
Energy consumption, residential and commercial[]
This section needs to be updated. (January 2020) |
As of 2010, buildings in the United States consume roughly 48% of the country's electricity and contribute a similar percentage of GHGs.[37]
- EPA Clean Energy Programs - Energy Star
- Commercial Building Integration[38] and Residential Building Integration (Build America).[39]
- Weatherization Assistance Program[40]
- State Energy Program[41]
Energy consumption, industrial[]
- Energy Star for industry
- Industrial Technologies Program (ITP)[42]
Energy supply[]
- The Coalbed Methane Outreach Program (CMOP) works to reduce methane released into the atmosphere as a result of coal mining by supporting recovery of naturally occurring coal mine gases and encouraging the production of coalbed methane energy, among other uses.[43]
- Natural Gas STAR Program
- The government also supports alternative energy sources that do not rely on fossil fuels, including wind power,[44] solar power,[45] geothermal power,[46] and biofuel.[47]
- These clean energy sources can often be integrated into the electric grid in what are known as distributed generation systems.[48]
- EPA Clean Energy Programs - Green Power Partnership[49]
- EPA Clean Energy Programs - Combined Heat and Power Partnership[50]
- Carbon capture and storage Research Program[51]
Agriculture[]
- Environmental Quality Incentives Program
- Conservation Reserve Program
- Conservation Security Program
- AgSTAR Program
Forestry[]
Waste management[]
- The Landfill Methane Outreach Program (LMOP) promotes the use of landfill gas, a naturally occurring byproduct of decaying landfill waste, as a sustainable energy source.[55] Besides reducing emissions, landfill gas utilization has also been credited for reductions in air pollution, improvements to health and safety conditions, and economic benefits for local communities.[56]
- In addition to reducing emissions from waste already in landfills, the EPA's WasteWise program works with businesses to encourage recycling and source reduction to keep waste out of landfills in the first place.[57]
Regional initiatives[]
- Western Climate Initiative
- The Regional Greenhouse Gas Initiative (RGGI), founded in 2007, is a state-level emissions capping and trading program by nine northeastern U.S. states: Connecticut, Delaware, Maine, Maryland, Massachusetts, New Hampshire, New York, Rhode Island, and Vermont. It is a cap and trade program in which states "sell nearly all emission allowances through auctions and invest proceeds in energy efficiency, renewable energy and other consumer benefit programs".[58]
- Western Governors Association Clean and Diversified Energy Initiative
- Powering the Plains[59]
- Carbon Sequestration Regional Partnerships[60]
- U.S. Mayors Climate Protection Agreement
- National Governors Association (NGA)´s Securing a Clean Energy Future.[61]
- In 2007 NGA announced plans to expand statewide regulations on GHG emissions and clean energy initiatives. Governors Tim Pawlenty of Minnesota and Kathleen Sebelius of Kansas led a task force along with six other governors to promote renewable energy, conservation, and a reduction in GHG emissions through statewide policies. The US Department of Energy provided $610,000 in support for this initiative.
- As chairman of NGA, Governor Tim Pawlenty (R-MN) said that on energy issues, "We have a federal government that doesn't seem to want to move as fast or as bold as many would like." With states creating their own emissions standards, Pawlenty said, there will be a push for the federal government to come up with a nationwide energy policy to address global warming. If enough states act to reduce GHG emissions, it would "become a de facto national policy".[62]
State Policies[]
California[]
- Vehicle Air Pollution (SR 27)- States and implies that California Senate does not have to adhere to cutbacks in emissions standards further allowing stricter emissions standards than the federal government for the state of California.[63] Under this senate resolution the current administration or other federal powers will be opposed by California in any reduction or cutback of the Clean Air Act policies that are currently in place; allowing California to have higher emissions and air quality standards. This policy is because of the threat by the current administration's efforts to reverse environmental policies, in this case vehicle emissions standards.[64] This opposition of federal policy changes is allowed through California's Clean Air Act preemption waiver granted to the state by the EPA on July 8, 2009.[65] California's waiver applies to vehicles made in 2009 and later.[65] The current standard being followed by the state is a goal of all vehicles reaching an average of 35 miles per gallon.[66][65] California saw a large decline in vehicle emissions from 2007 to 2013 as well as a rise in emissions following 2013 which can be attributed to different circumstances some of which include increased population, increased employment, increase in overall state GDP meaning more productivity in the state.[67]
- Vehicle Registration: Environmental Rebates (SB 745)- Establishes a rebate for any transportation improvement fee on a vehicle. This Senate Bill allots funds from the Greenhouse Gas Reduction Fund to the Climate Policy Special rebate fund and which are then transferred to the department of motor vehicles to pay for newly registered vehicles or renewed vehicles. According to the policy the cost per vehicle is to be displayed in the registration paperwork.[63]
Lead by example programs[]
- New Hampshire's Building Energy Conservation Initiative
- New Jersey's Green Power Purchasing Program
- Atlanta's Virginia Highland - 1st Carbon Neutral Zone in the United States[68][69]
Non-governmental responses[]
Individual action[]
Actions taken by individuals on climate change include diet, travel alternatives, household energy use, reduced consumption[70] and family size.[71][72][73] Individuals can also engage in local and political advocacy around issues of climate change.[74] Individuals have a variety of carbon offsetting options available to mitigate their environmental impact through non-profit organizations like Carbonfund.org Foundation.[75]
Business community[]
Numerous large businesses have started cutting emissions and committed to eliminate net emissions by various dates in the future, resulting in higher demand for renewable energy and lower demand for fossil fuel energy.[76] Businesses may also go carbon neutral by enrolling in Carbonfree® Programs[77] or certifying their products as Carbonfree®[78] through carbon offset organizations like Carbonfund.org Foundation.[79]
Technologies in development[citation needed][]
- Carbon Sequestration Regional Partnerships[60]
- Nuclear:
- Generation IV Nuclear Energy Systems Initiative
- Nuclear Hydrogen Initiative
- Advanced Fuel Cycle Initiative
- Global Nuclear Energy Partnership
- Clean Automotive Technology
- Hydrogen Technology[80]
- and High-temperature superconductivity
See also[]
- Climate Registry
- Coal in the United States
- Energy conservation in the United States
- Greenhouse gas emissions in Kentucky
- List of countries by carbon dioxide emissions
- List of U.S. states by carbon dioxide emissions
- Phase-out of fossil fuel vehicles
- Politics of global warming
- Post–Kyoto Protocol negotiations on greenhouse gas emissions
- Regulation of Greenhouse Gases Under the Clean Air Act
- Select Committee on Energy Independence and Global Warming
- U.S. Climate Change Science Program
- List of coal-fired power station in the United States
- List of natural gas-fired power stations in the United States
References[]
- ^ "Historical GHG Emissions / Global Historical Emissions". ClimateWatchData.org. Climate Watch. 2021. Archived from the original on 21 May 2021. ● Population data from "List of the populations of the world's countries, dependencies, and territories". britannica.com. Encyclopedia Britannica. Archived from the original on 26 May 2021.
- ^ "Greenhouse Gas Inventory Data Explorer | US EPA". cfpub.epa.gov. Retrieved 17 April 2021.
- ^ "Fast Facts 1990–2018 National-Level U.S. Greenhouse Gas Inventory" (PDF). US EPA. April 2021.
- ^ "Report: China emissions exceed all developed nations combined". BBC News. 2021-05-07.
- ^ "Cumulative CO2 emissions globally by country 2018". Statista. Retrieved 2021-02-19.
- ^ "4 Charts Explain Greenhouse Gas Emissions by Countries and Sectors". World Resources Institute. 2020-02-06. Retrieved 2020-04-29.
- ^ EPA,OA, US (2015-12-29). "Sources of Greenhouse Gas Emissions - US EPA". US EPA. Retrieved 19 April 2018.
- ^ EPA, OA, US (2015-12-29). "Sources of Greenhouse Gas Emissions - US EPA". US EPA. Retrieved 19 April 2018.
- ^ Jackson, Randal. "The Effects of Climate Change". Climate Change: Vital Signs of the Planet. Retrieved 2020-08-22.
- ^ "Sources & Sinks". The Environmental Literacy Council. Retrieved 2020-08-23.
- ^ Jump up to: a b c d US EPA, OAR (2015-12-23). "Overview of Greenhouse Gases". US EPA. Retrieved 2020-08-23.
- ^ "Climate Change: Atmospheric Carbon Dioxide | NOAA Climate.gov". www.climate.gov. Retrieved 2020-08-23.
- ^ US EPA, OAR (2015-12-29). "Sources of Greenhouse Gas Emissions". US EPA. Retrieved 2020-03-03.
- ^ "US methane emissions are drastically underestimated, a new study shows". PRI. 2016.
- ^ US EPA, OAR (June 26, 2018). "What the U.S. is Doing in the Global Methane Initiative". US EPA. Retrieved 2019-12-24.
- ^ "Exxon's XTO caps leaking Ohio gas well, 20 days after blowout". Reuters. 2018-03-07. Retrieved 2019-12-24.
- ^ Pandey, Sudhanshu; Gautam, Ritesh; Houweling, Sander; Gon, Hugo Denier van der; Sadavarte, Pankaj; Borsdorff, Tobias; Hasekamp, Otto; Landgraf, Jochen; Tol, Paul; Kempen, Tim van; Hoogeveen, Ruud (2019-12-12). "Satellite observations reveal extreme methane leakage from a natural gas well blowout". Proceedings of the National Academy of Sciences. 116 (52): 26376–26381. Bibcode:2019PNAS..11626376P. doi:10.1073/pnas.1908712116. ISSN 0027-8424. PMC 6936547. PMID 31843920.
- ^ Falconer, Rebecca (December 17, 2009). "Satellite reveals Ohio gas well blowout to be a massive methane "super-emitter"". Axios. Retrieved 2019-12-24.
- ^ European Space Agency (2019-12-20). "Massive Methane Leak Visible From Space". SciTechDaily. Retrieved 2019-12-24.
- ^ Jump up to: a b Friedlingstein et al. 2019, Table 7.
- ^ US EPA, OAR (2014-09-22). "Learn About the Greenhouse Gas Reporting Program (GHGRP)". US EPA. Retrieved 2020-08-05.
- ^ Gurney, Kevin. "The Vulcan Project - Index". vulcan.project.asu.edu. Retrieved 19 April 2018.
- ^ Dessai, S. (December 2001), Tyndall Centre Working Paper 12: The climate regime from The Hague to Marrakech: Saving or sinking the Kyoto Protocol?, Norwich, UK: Tyndall Centre, archived from the original on 31 October 2012. p. 5.
- ^ "Effect of the US withdrawal from the Paris Agreement | Climate Action Tracker". climateactiontracker.org. Retrieved 2020-08-22.
- ^ Plumer, Brad; Popovich, Nadja (2021-04-22). "The U.S. Has a New Climate Goal. How Does It Stack Up Globally?". The New York Times. ISSN 0362-4331. Retrieved 2021-07-15.
- ^ "Fourth Climate Action Report to the UN Framework Convention on Climate Change". 2009-2017.state.gov. Retrieved 2020-04-22.
- ^ 4. Policies and Measures
- ^ "Abolishing California Passenger Cars Could Reduce Global Greenhouse Gases – by 0.26%". Cato Institute. 2020-09-25. Retrieved 2020-09-28.
- ^ Jump up to: a b US Energy Information Administration, Primary energy by source and sector, 2011, PDF.
- ^ "EERE: Vehicle Technologies Program Home Page". Archived from the original on 2007-09-25. Retrieved 2007-09-11.
- ^ "Clean Cities Coalition Network: About Clean Cities". cleancities.energy.gov. Retrieved 2020-08-05.
- ^ "CMAQ - Air Quality - Environment - FHWA". www.fhwa.dot.gov. Retrieved 19 April 2018.
- ^ US EPA, OAR (2016-09-09). "Regulations for Greenhouse Gas Emissions from Aircraft". US EPA. Retrieved 2020-08-06.
- ^ Davenport, Coral (2020-07-22). "E.P.A. Proposes Airplane Emission Standards That Airlines Already Meet". The New York Times. ISSN 0362-4331. Retrieved 2020-08-06.
- ^ "About the Bioenergy Technologies Office: Growing America's Energy Future". Energy.gov. Retrieved 2020-08-06.
- ^ "Bioenergy Technologies Office Fiscal Year 2014 Annual Report" (PDF). U.S. Department of Energy.
- ^ Mazria, Ed. "2030 Challenge". Archived from the original on 2009-12-24.
- ^ "DOE: High Performance Buildings". Archived from the original on 2007-09-03. Retrieved 2007-09-11.
- ^ "Building Technologies Program: Building America". Archived from the original on 2006-03-05. Retrieved 2007-09-11.
- ^ "Weatherization Assistance Program". Archived from the original on 2008-08-29. Retrieved 2008-09-24.
- ^ "EERE: State Energy Program Home Page". Archived from the original on 2007-09-25. Retrieved 2007-09-11.
- ^ "Industrial Technologies Program BestPractices". Archived from the original on 2010-08-27. Retrieved 2007-09-11.
- ^ US EPA, OAR (2015-12-07). "Mitigating Coal Mine Methane Emissions". US EPA. Retrieved 2020-08-06.
- ^ "Wind and Hydropower Technologies Program: Wind Energy Research". Archived from the original on 2007-08-27. Retrieved 2007-09-11.
- ^ "Office of Energy Efficiency & Renewable Energy | Department of Energy". Eere.energy.gov. Retrieved 2018-07-11.
- ^ "EERE: Geothermal Technologies Program Home Page". Archived from the original on 2007-09-25. Retrieved 2007-09-11.
- ^ "EERE: Biomass Program Home Page". Archived from the original on 2007-09-13. Retrieved 2007-09-11.
- ^ "OE: Distributed Energy Program Home Page". Archived from the original on 2007-09-29. Retrieved 2007-09-11.
- ^ "Green Power Partnership". www.epa.gov. U.S. Environmental Protection Agency. Retrieved 28 July 2014.
- ^ "Combined Heat and Power Partnership". www.epa.gov. U.S. Environmental Protection Agency. Retrieved 28 July 2014.
- ^ "Carbon Capture and Storage Research". Energy.gov. U.S. Department of Energy, Office of Fossil Energy. Retrieved 28 July 2014.
- ^ "Advanced Energy Systems Program". NETL website. National Energy Technology Laboratory, U.S. Department of Energy. Retrieved 28 July 2014.
- ^ "Carbon Capture". NETL website. National Energy Technology Laboratory, U.S. Department of Energy. Retrieved 28 July 2014.
- ^ "Carbon Storage Technology". NETL website. National Energy Technology Laboratory, U.S. Department of Energy. Retrieved 28 July 2014.
- ^ US EPA, OAR (2016-06-29). "About the Landfill Methane Outreach Program". US EPA. Retrieved 2020-08-06.
- ^ US EPA, OAR (2016-04-15). "Benefits of Landfill Gas Energy Projects". US EPA. Retrieved 2020-08-06.
- ^ US EPA, OLEM (2016-03-11). "WasteWise". US EPA. Retrieved 2020-08-06.
- ^ "Welcome". Regional Greenhouse Gas Initiative, Inc. n.d. Retrieved 9 February 2015.
- ^ "Powering the Plains: Energy Transition Roadmap" (PDF). GPI website. Great Plains Institute. Retrieved 28 July 2014.[permanent dead link]
- ^ Jump up to: a b "Regional Carbon Sequestration Partnerships". NETL website. National Energy Technology Laboratory, U.S. Department of Energy. Retrieved 28 July 2014.
- ^ National Governors Association]. "2007-2008 NGA Chair's Initiative". Archived from the original on 2007-10-27.
- ^ [1][dead link] "NGA Officially Launches Chair's Initiative: Securing a Clean Energy Future". 2007-09-12. Archived from the original on 2007-10-27. Retrieved 2007-09-17.
- ^ Jump up to: a b Board, California Air Resources. "Air Quality Legislation". www.arb.ca.gov. Retrieved 2018-09-07.
- ^ "California Senate approves Wieckowski Clean Air Act resolution". Senator Bob Wieckowski. 2017-04-03. Retrieved 2018-09-07.
- ^ Jump up to: a b c EPA; OAR; OTAQ (2016-10-14). "California Greenhouse Gas Waiver Request | US EPA". US EPA. Retrieved 2018-09-07.
- ^ Federal Register (2009) Part III Environmental Protection Agency, Federal Register / Vol. 74, No. 129 / Wednesday, July 8, 2009 / Notice
- ^ "California's Greenhouse Gas Emission Inventory". www.arb.ca.gov. Retrieved 2018-09-07.
- ^ Jay, Kate (November 14, 2008). "First Carbon Neutral Zone Created in the United States". Reuters. Archived from the original on September 7, 2009.
- ^ Auchmutey, Jim (January 26, 2009). "Trying on carbon-neutral trend". Atlanta Journal-Constitution.
- ^ "Carbon Footprint Factsheet - Center for Sustainable Systems". css.umich.edu. Retrieved 19 April 2018.
- ^ Perkins, Sid (July 11, 2017). "The best way to reduce your carbon footprint is one the government isn't telling you about". Science. Archived from the original on 1 December 2017. Retrieved 29 March 2019.
- ^ "Want to fight climate change? Have fewer children". 12 July 2017. Archived from the original on 6 November 2019. Retrieved 21 March 2019.
- ^ "Population Matters: Climate change". 16 October 2018. Archived from the original on 15 May 2019. Retrieved 21 March 2019.
- ^ Frankel, Jeffrey (2020-01-20). "The best way to help the climate is to increase the price of CO2 emissions | Jeffrey Frankel". The Guardian. ISSN 0261-3077. Retrieved 2020-01-20.
- ^ "For Individuals - Offset Your Carbon Footprint". Carbonfund.org. Retrieved 2021-07-15.
- ^ "Growing renewable power: companies seizing leadership opportunities". TheRe100.org. December 2020. Retrieved 2021-03-04.
- ^ "Carbonfree® Partner Programs for Businesses". Carbonfund.org. Retrieved 2021-07-15.
- ^ "Carbonfree® Product Certification Process". Carbonfund.org. Retrieved 2021-07-15.
- ^ "Carbon Neutrality for Individuals and Businesses". Carbonfund.org. Retrieved 2021-07-15.
- ^ "Technologies for Hydrogen Production". Gasifipedia. National Energy Technology Laboratory, U.S. Department of Energy. Retrieved 28 July 2014.
External links[]
| Wikisource has original text related to this article: |
- Live carbon emissions from electricity generation in some states
- U.S. Emissions Data (Energy Information Administration).
| show Greenhouse gas emissions by the Americas |
|---|

- Greenhouse gas emissions in the United States
- Transportation in the United States
- Energy in the United States
- Greenhouse gas emissions by country